. 2021 Apr;24(4):504-515.
doi: 10.1038/s41593-021-00810-y. Epub 2021 Mar 15.

Divergent pallidal pathways underlying distinct Parkinsonian behavioral deficits

Affiliations

Divergent pallidal pathways underlying distinct Parkinsonian behavioral deficits

Varoth Lilascharoen et al. Nat Neurosci. 2021 Apr.

Abstract

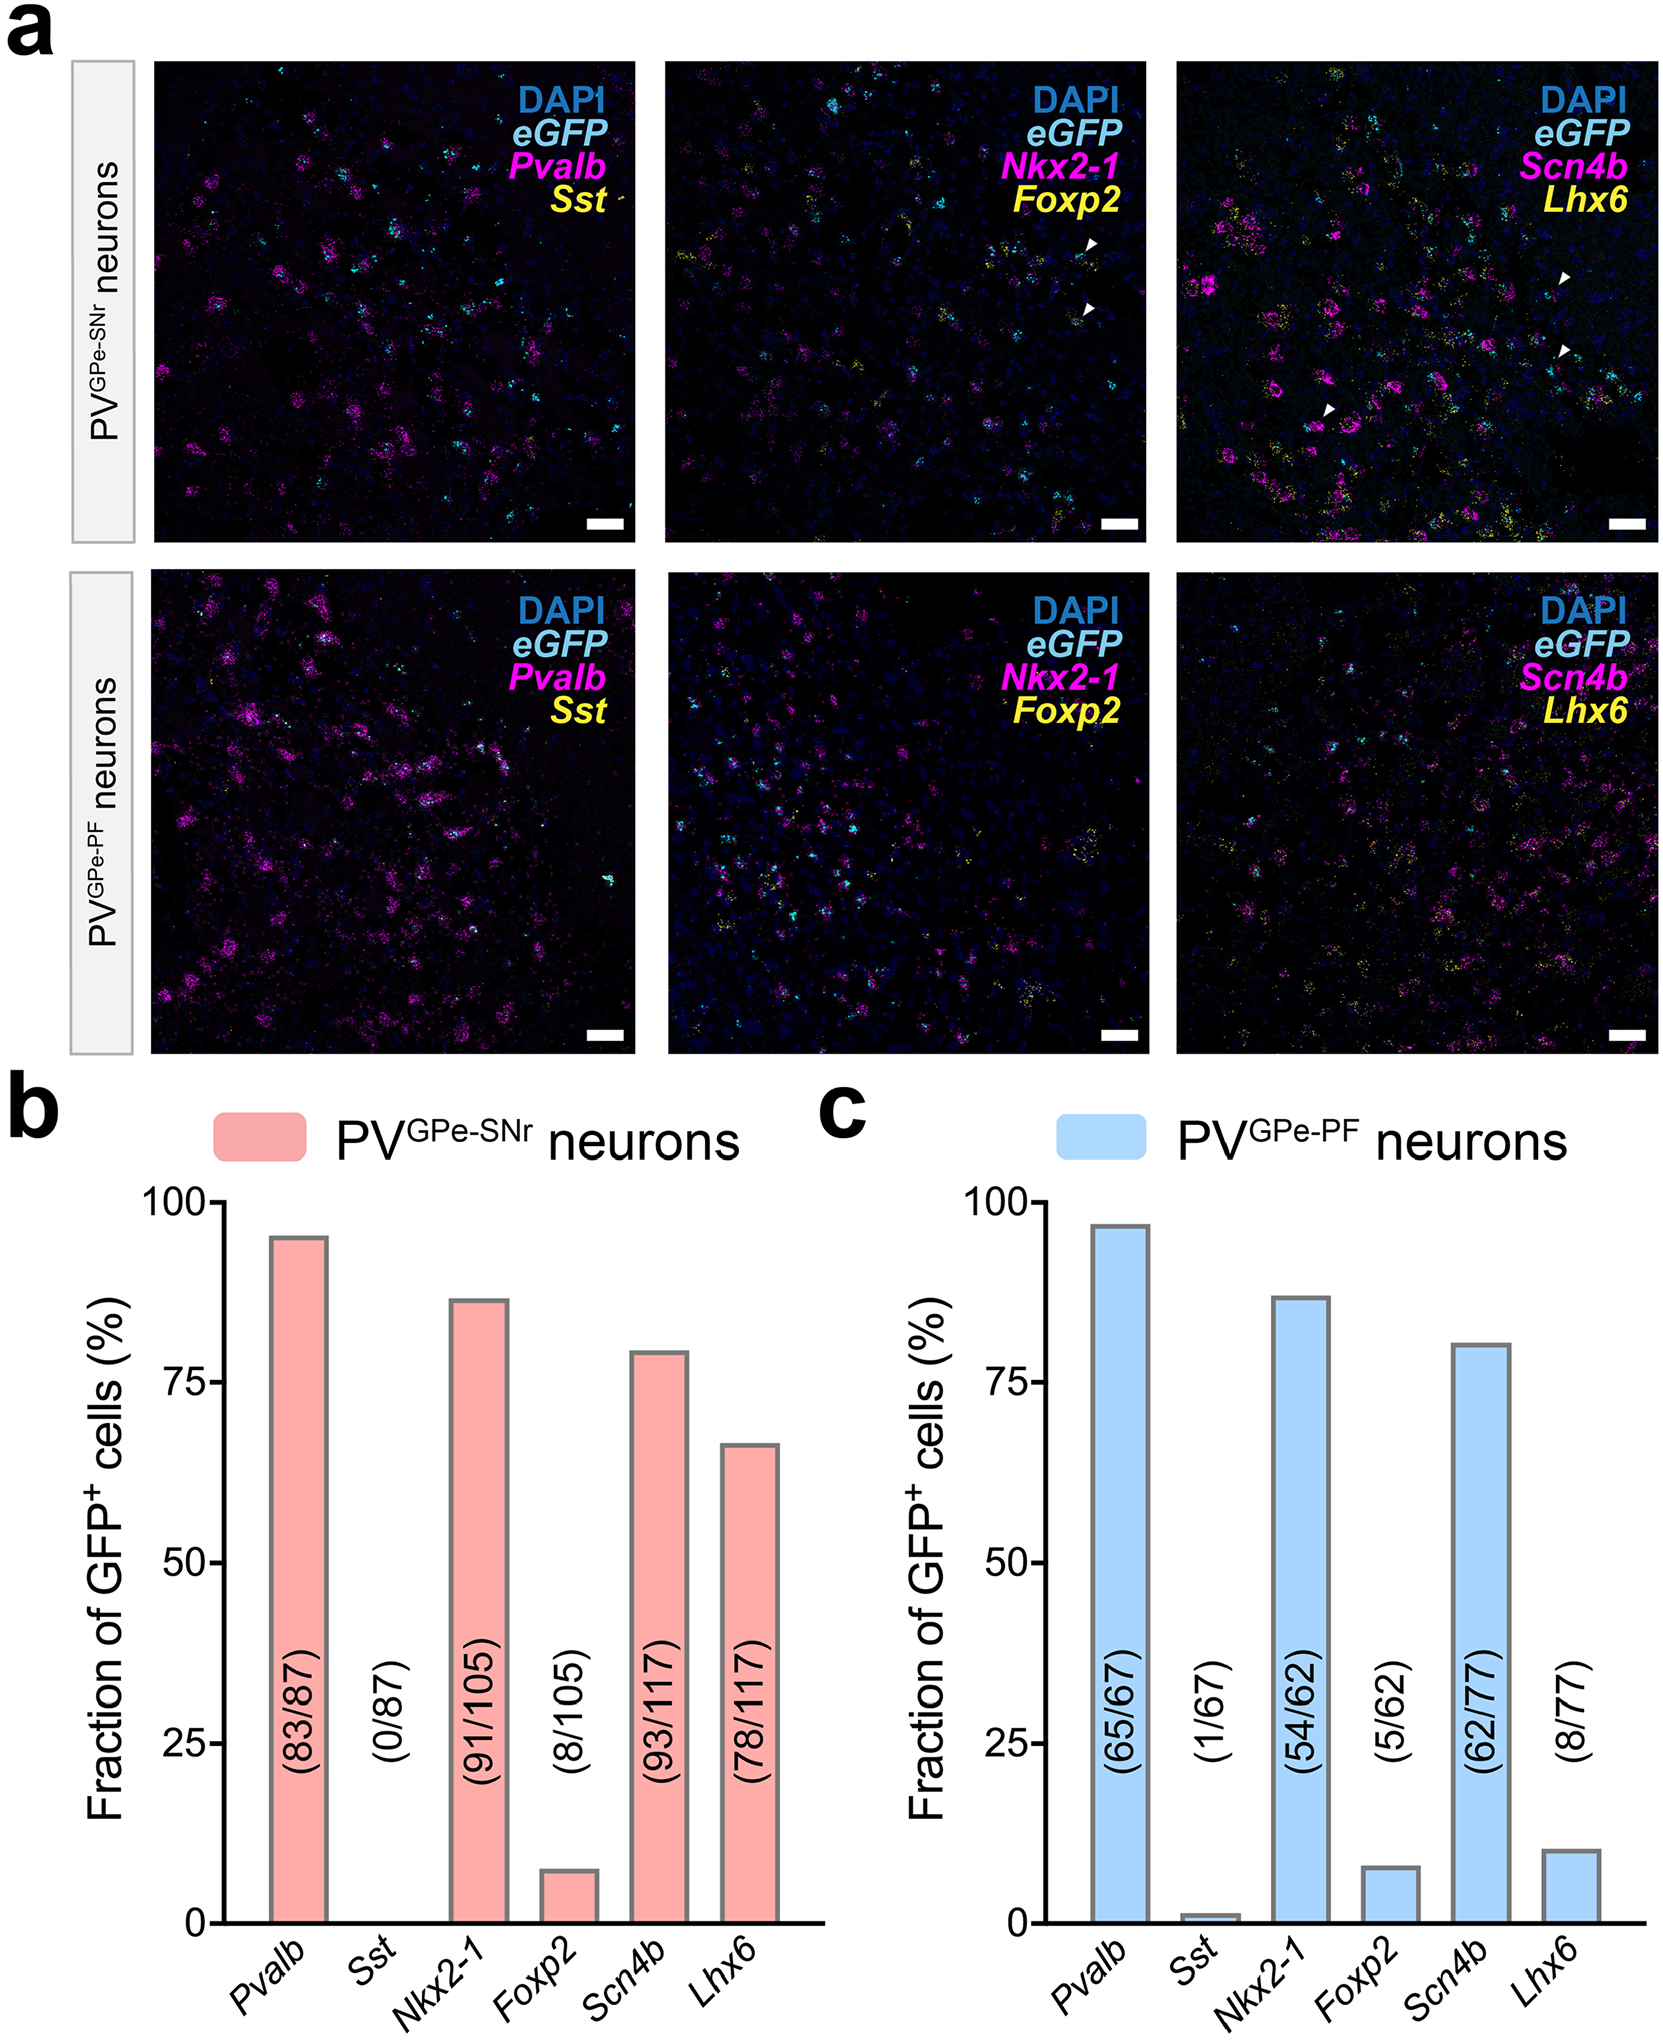
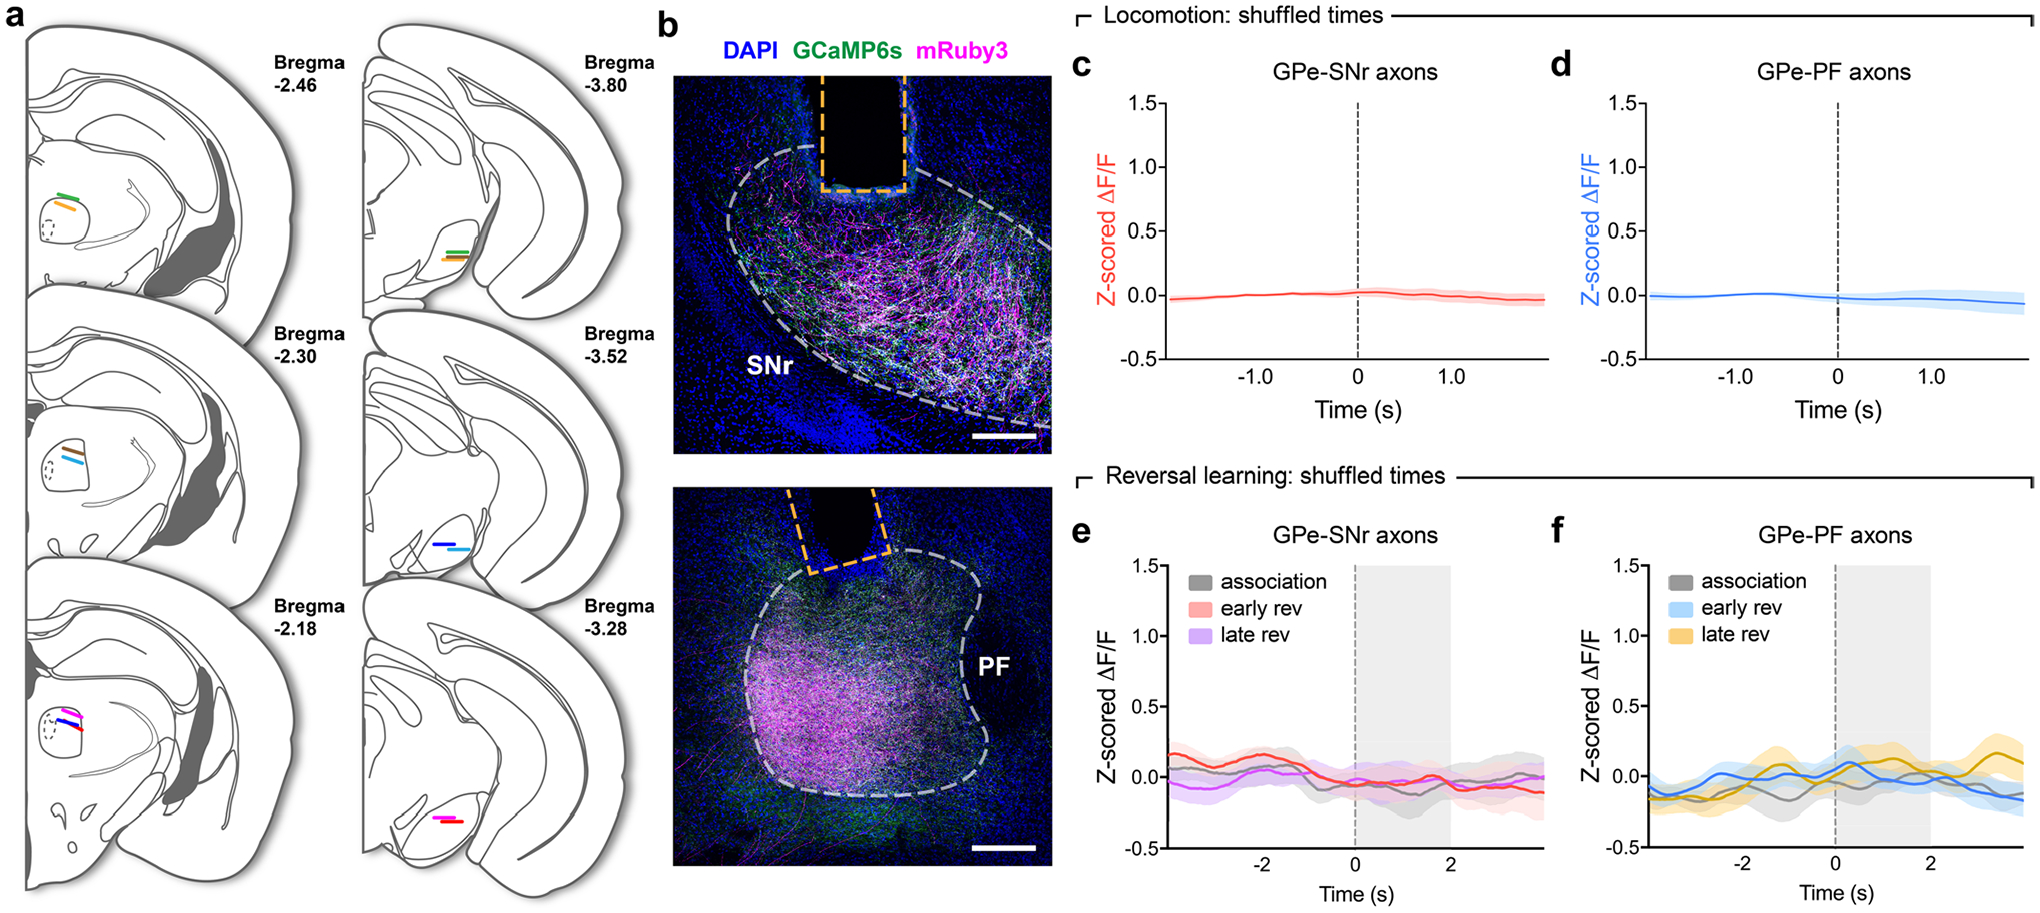
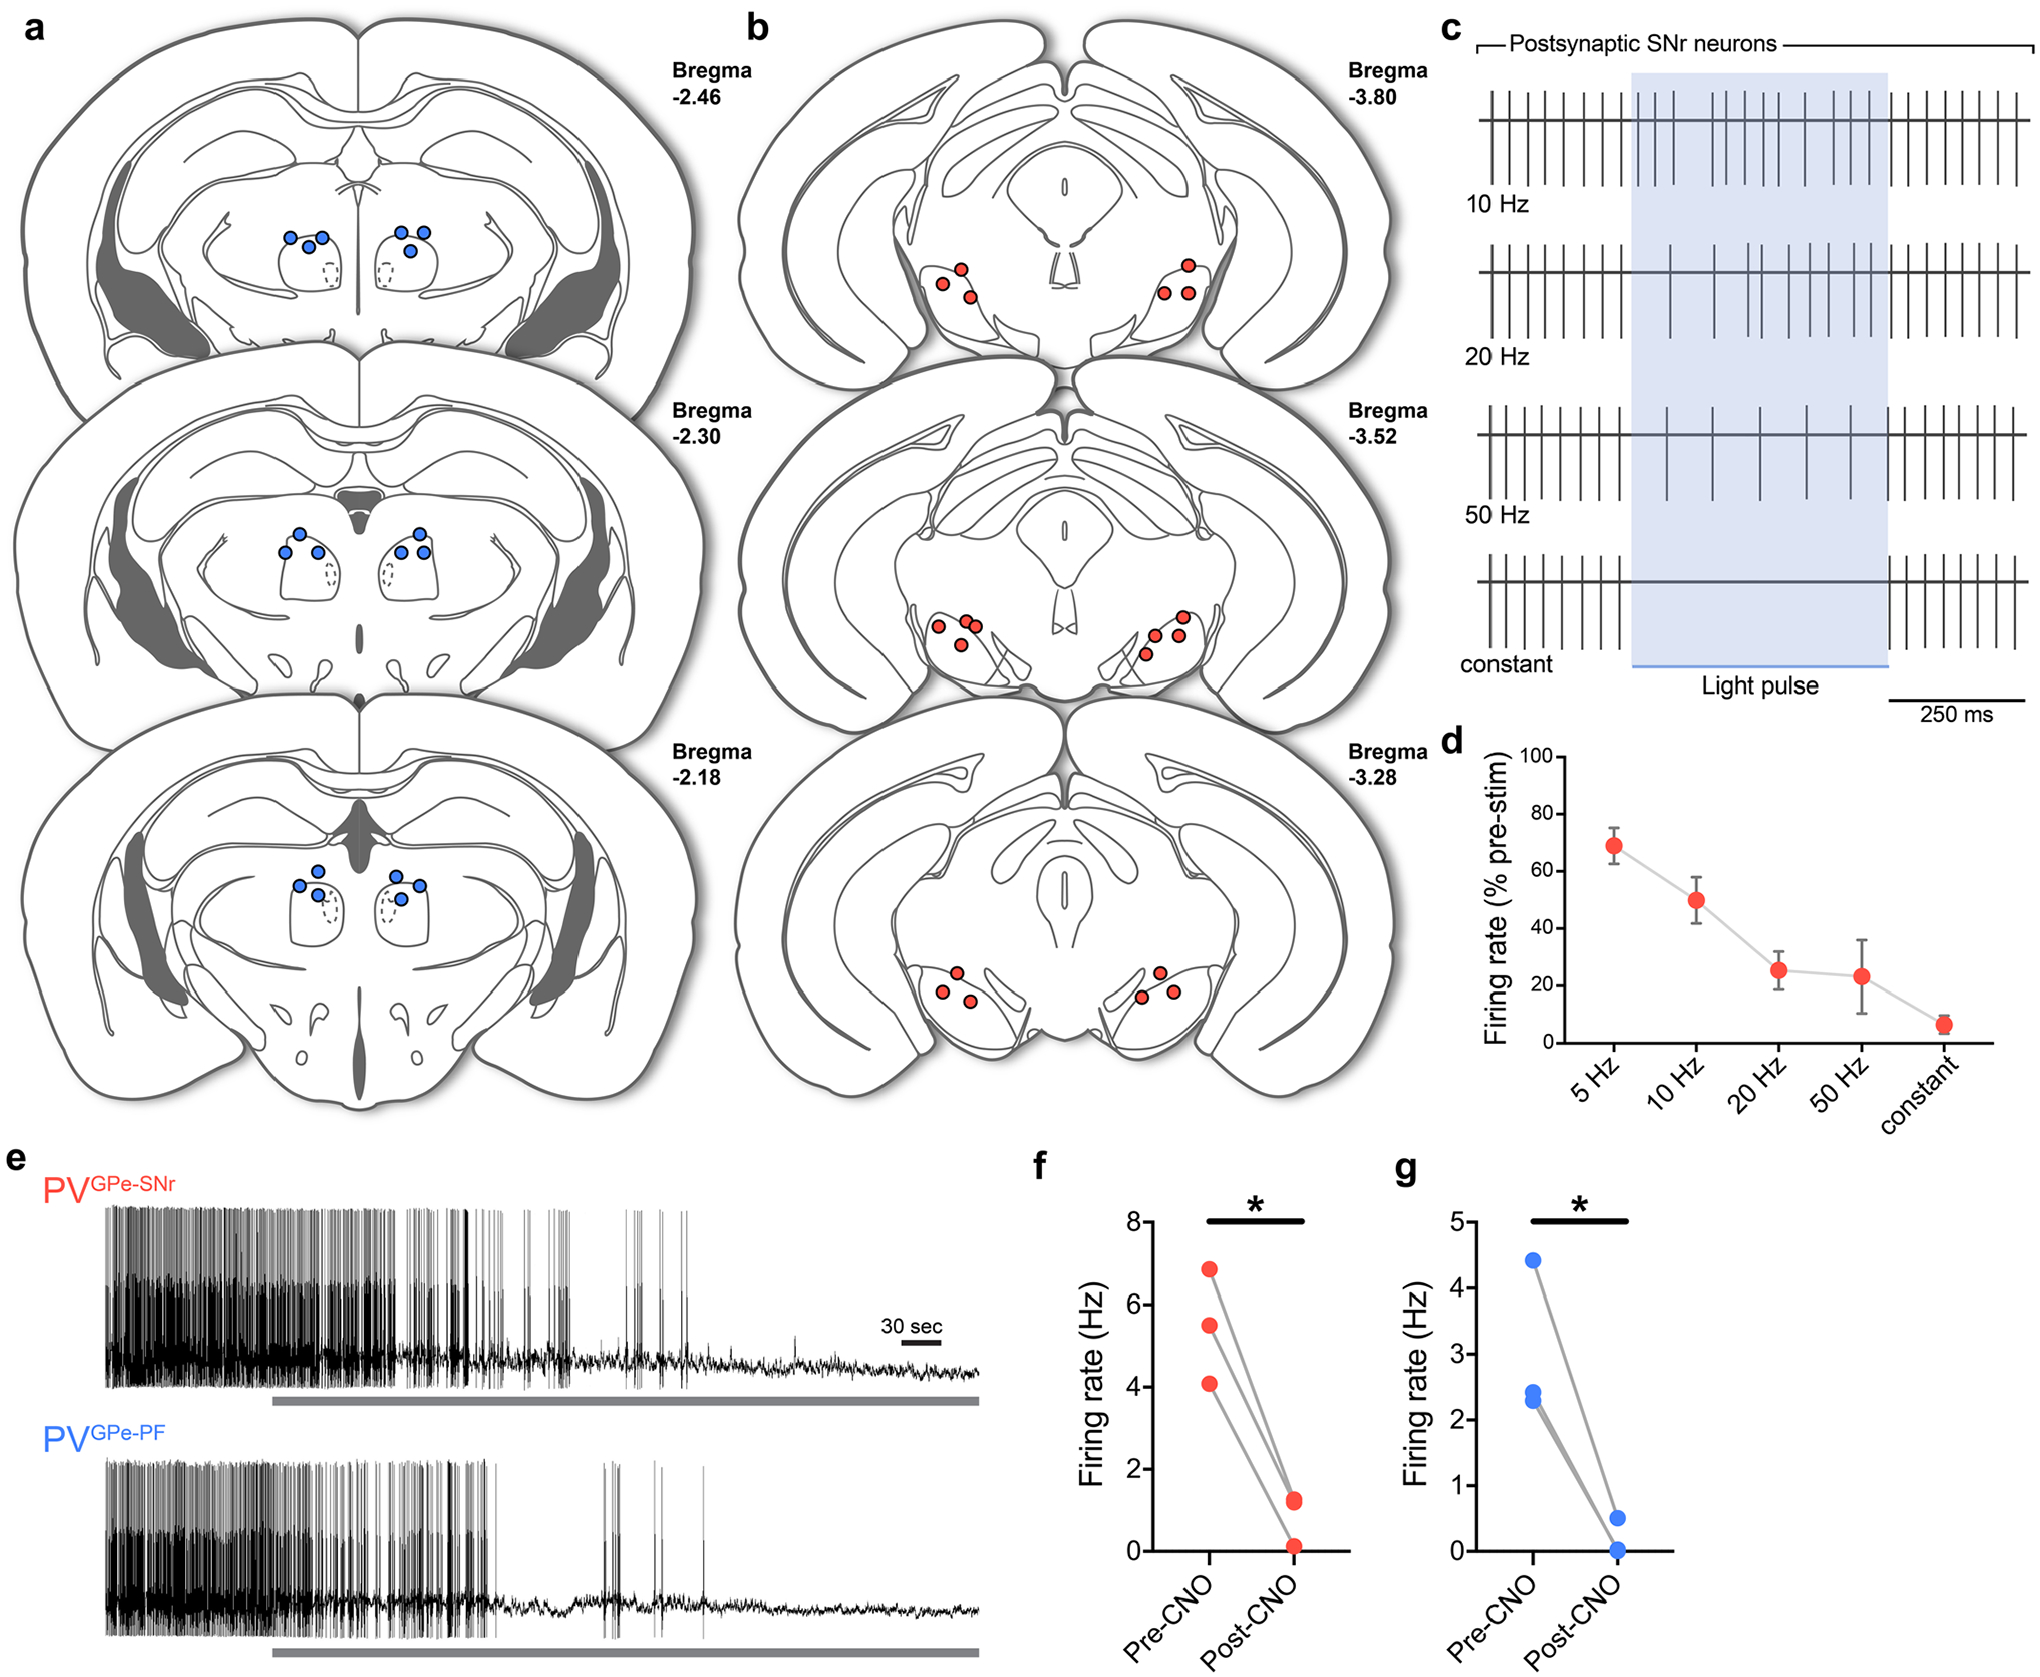
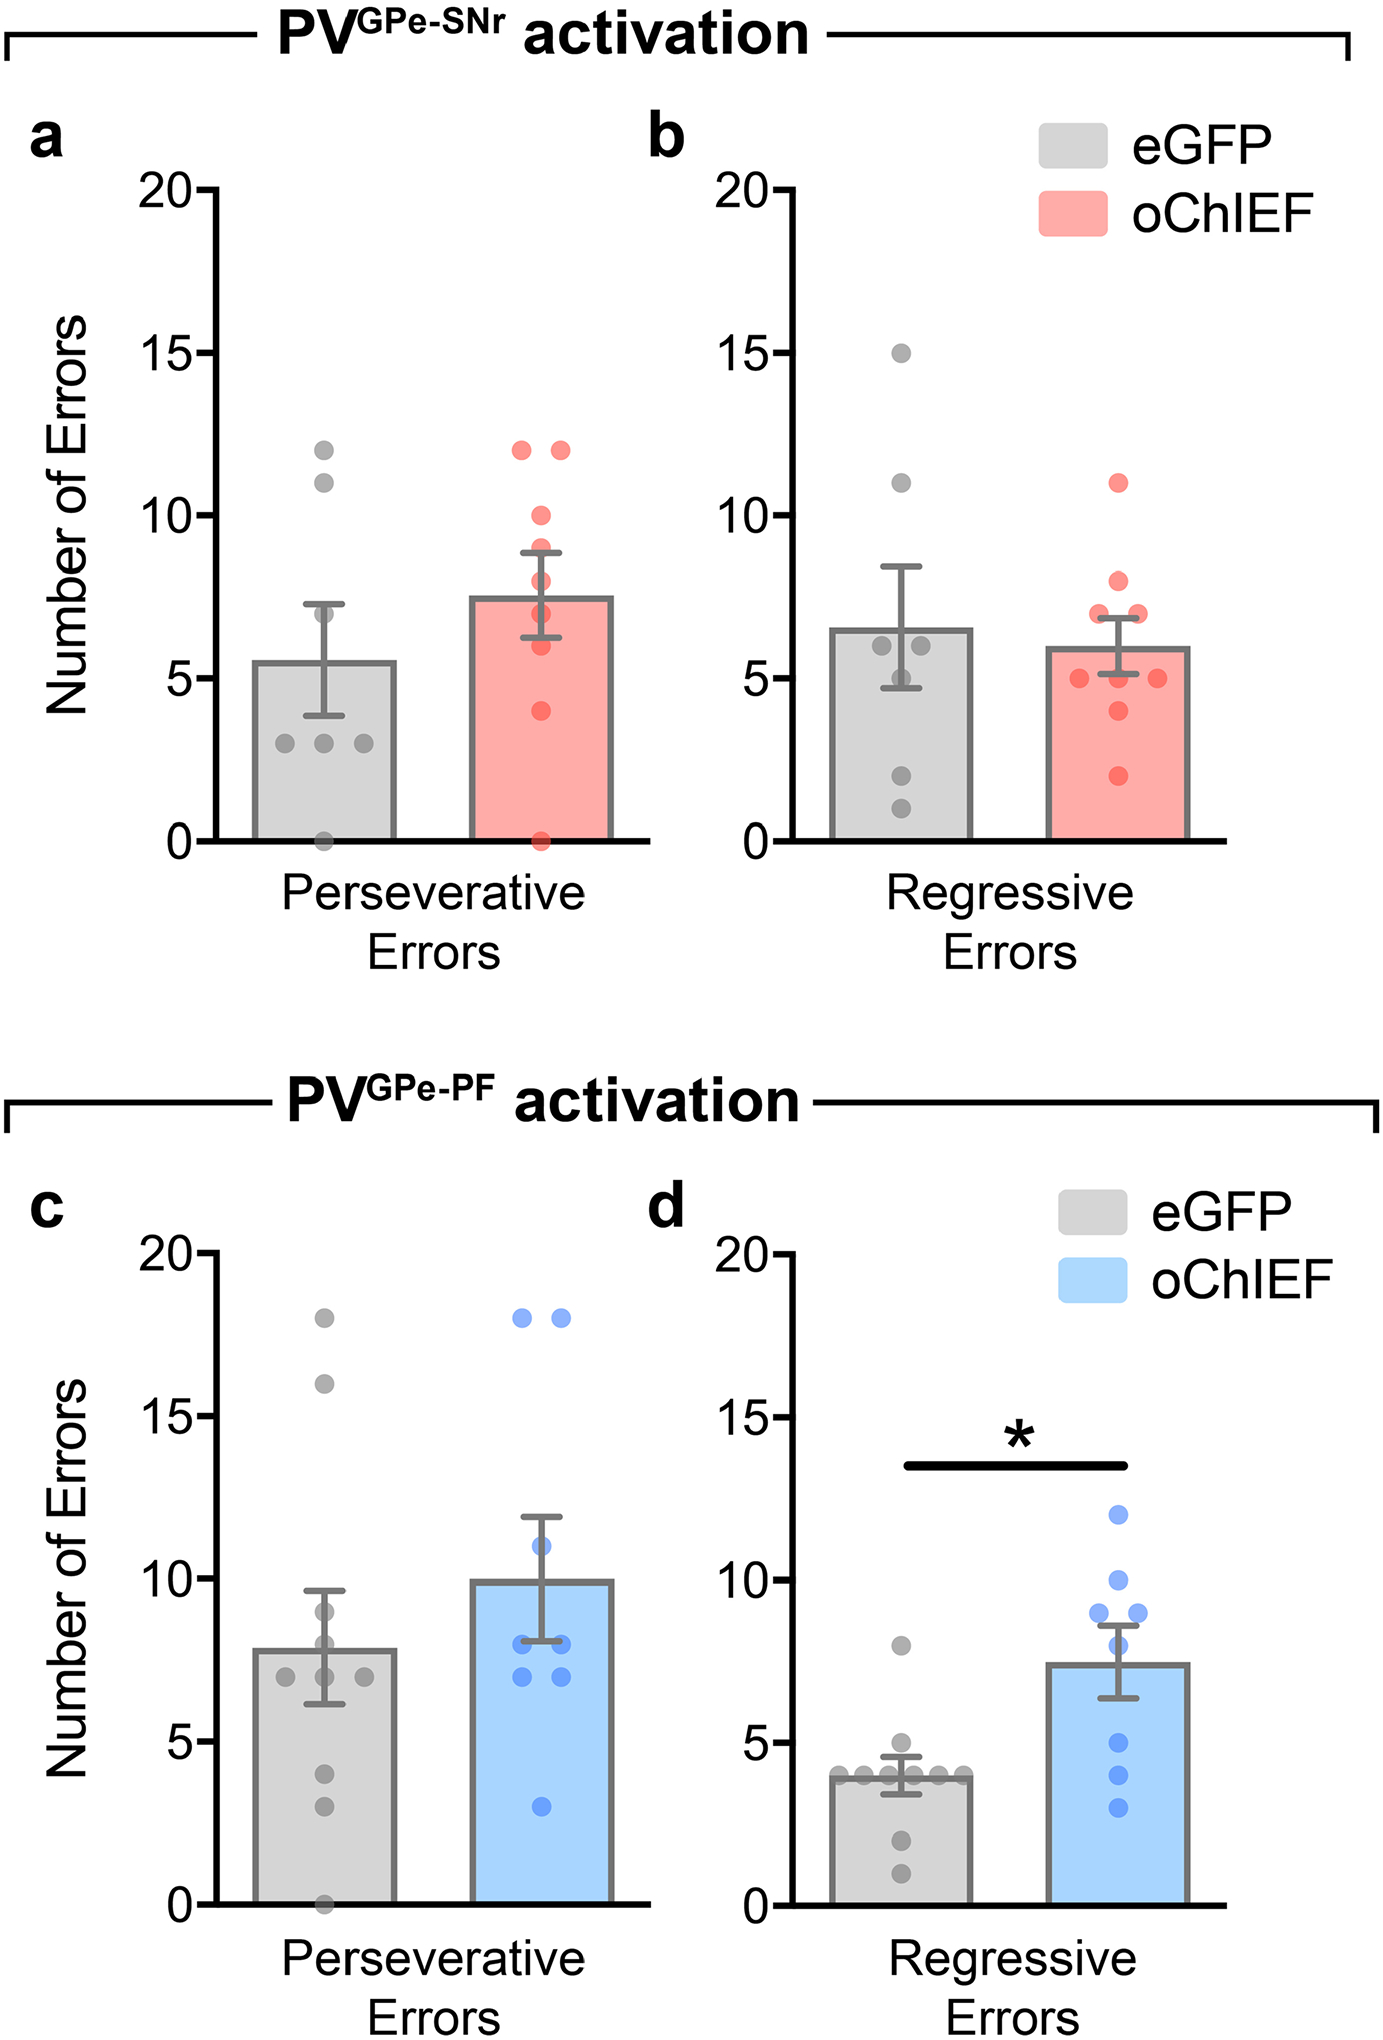
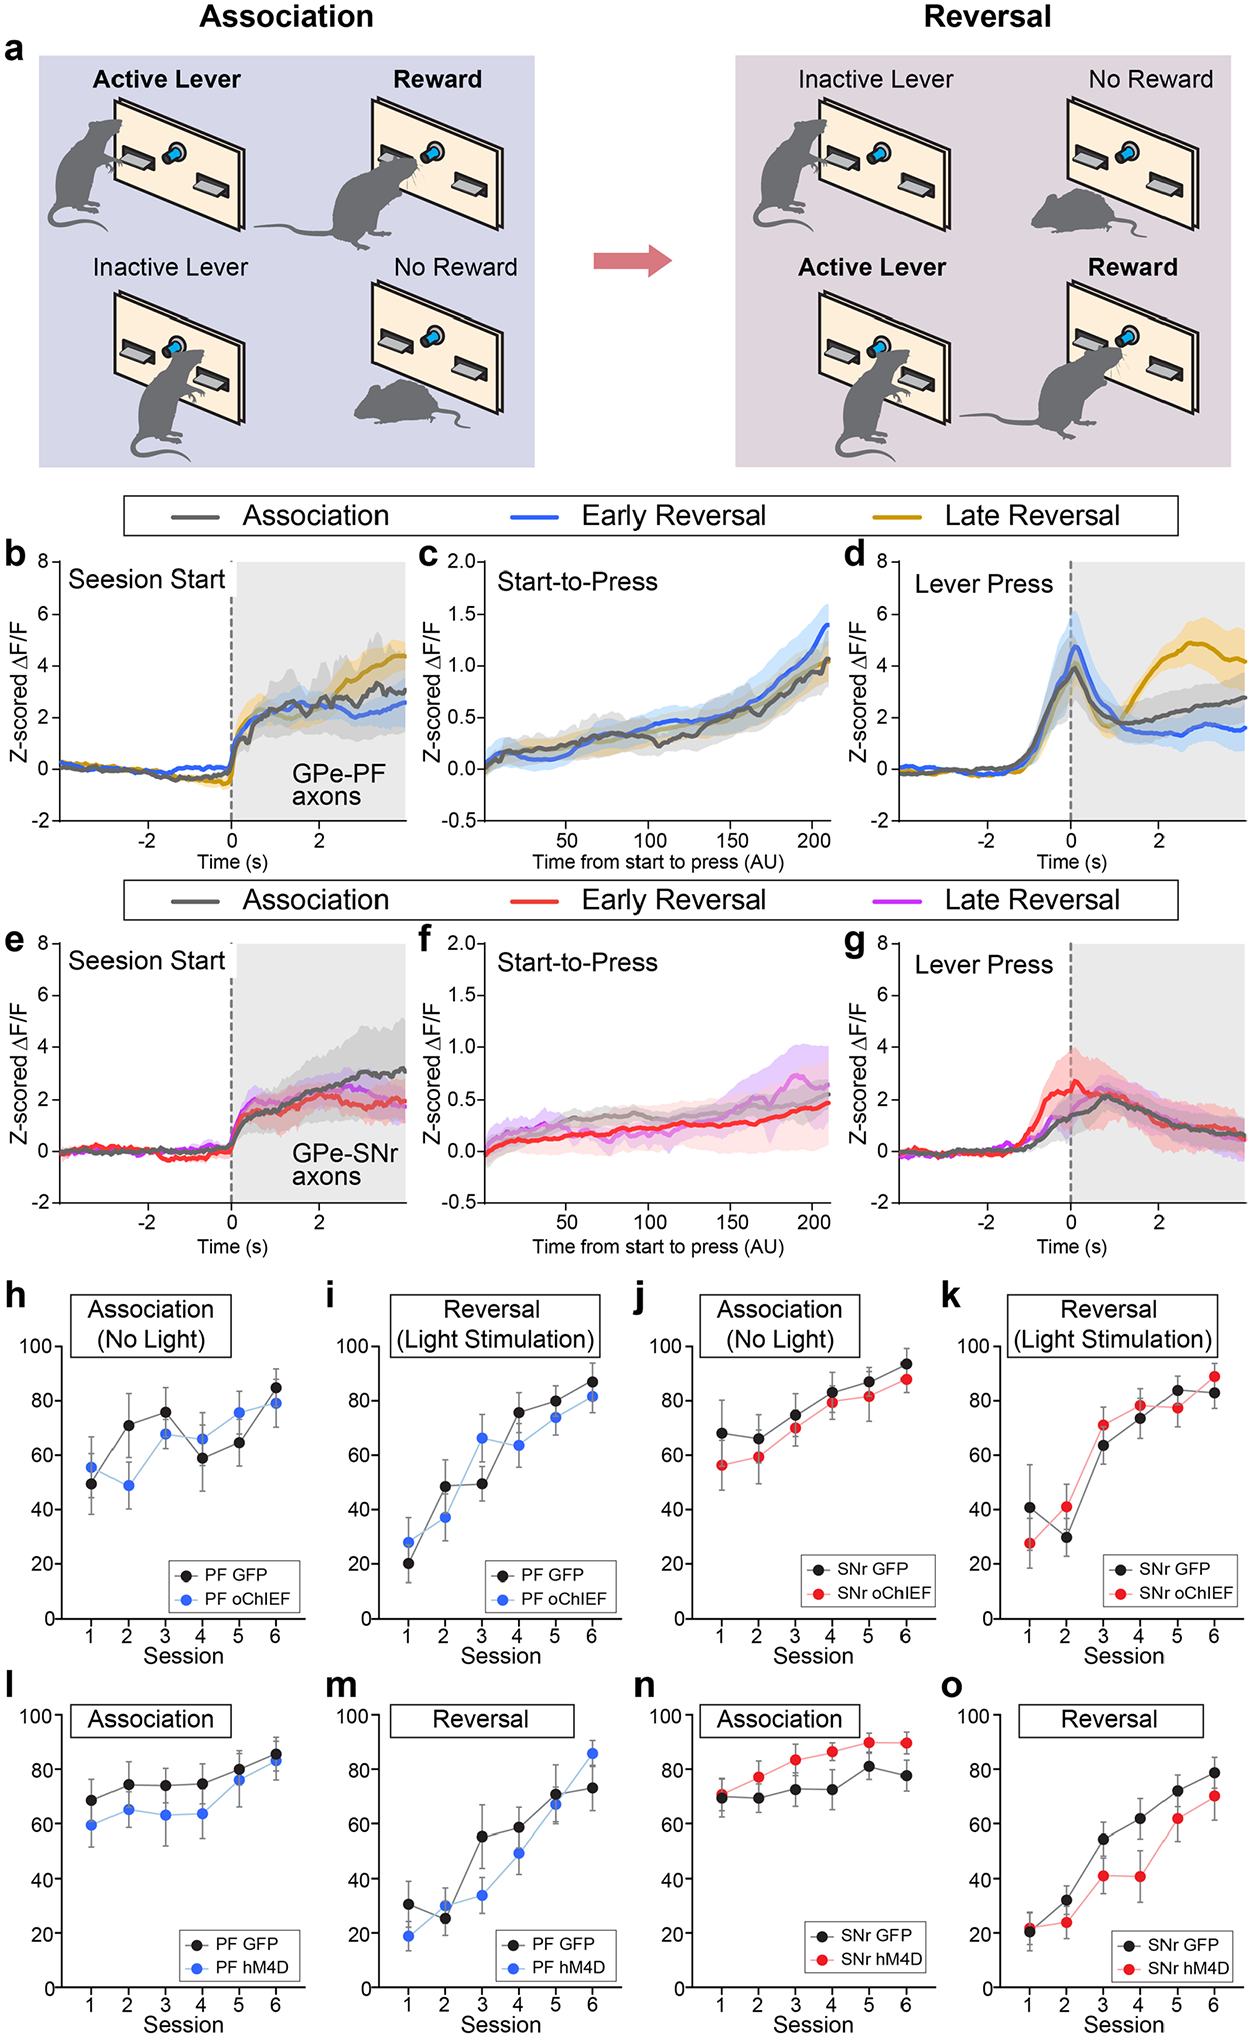
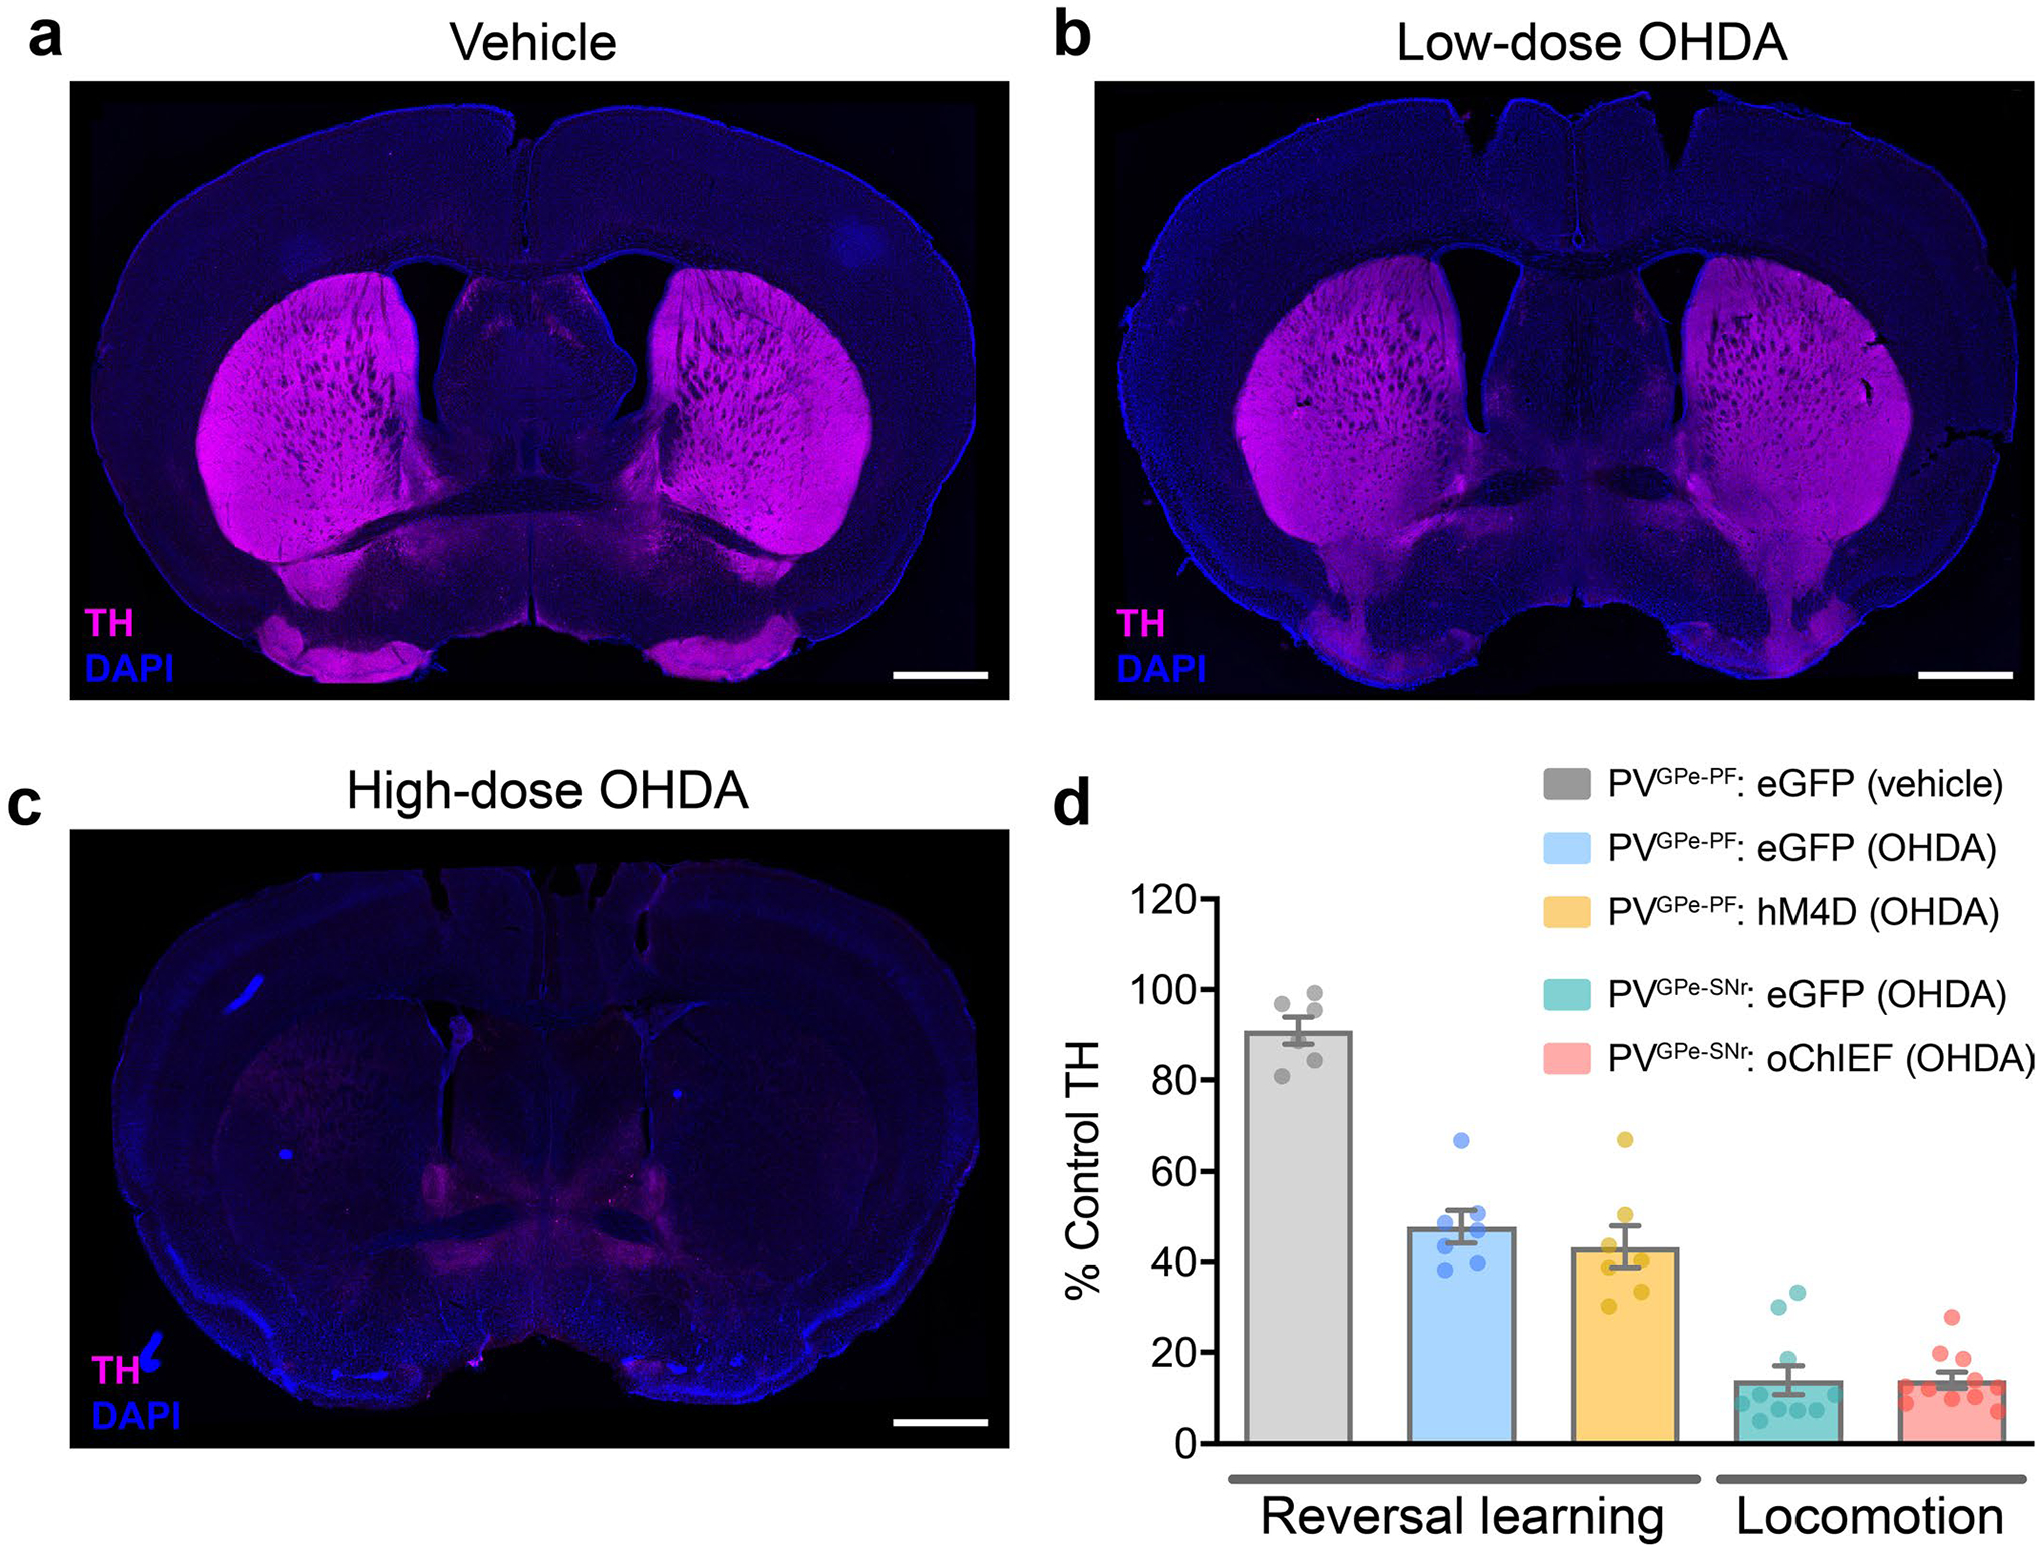
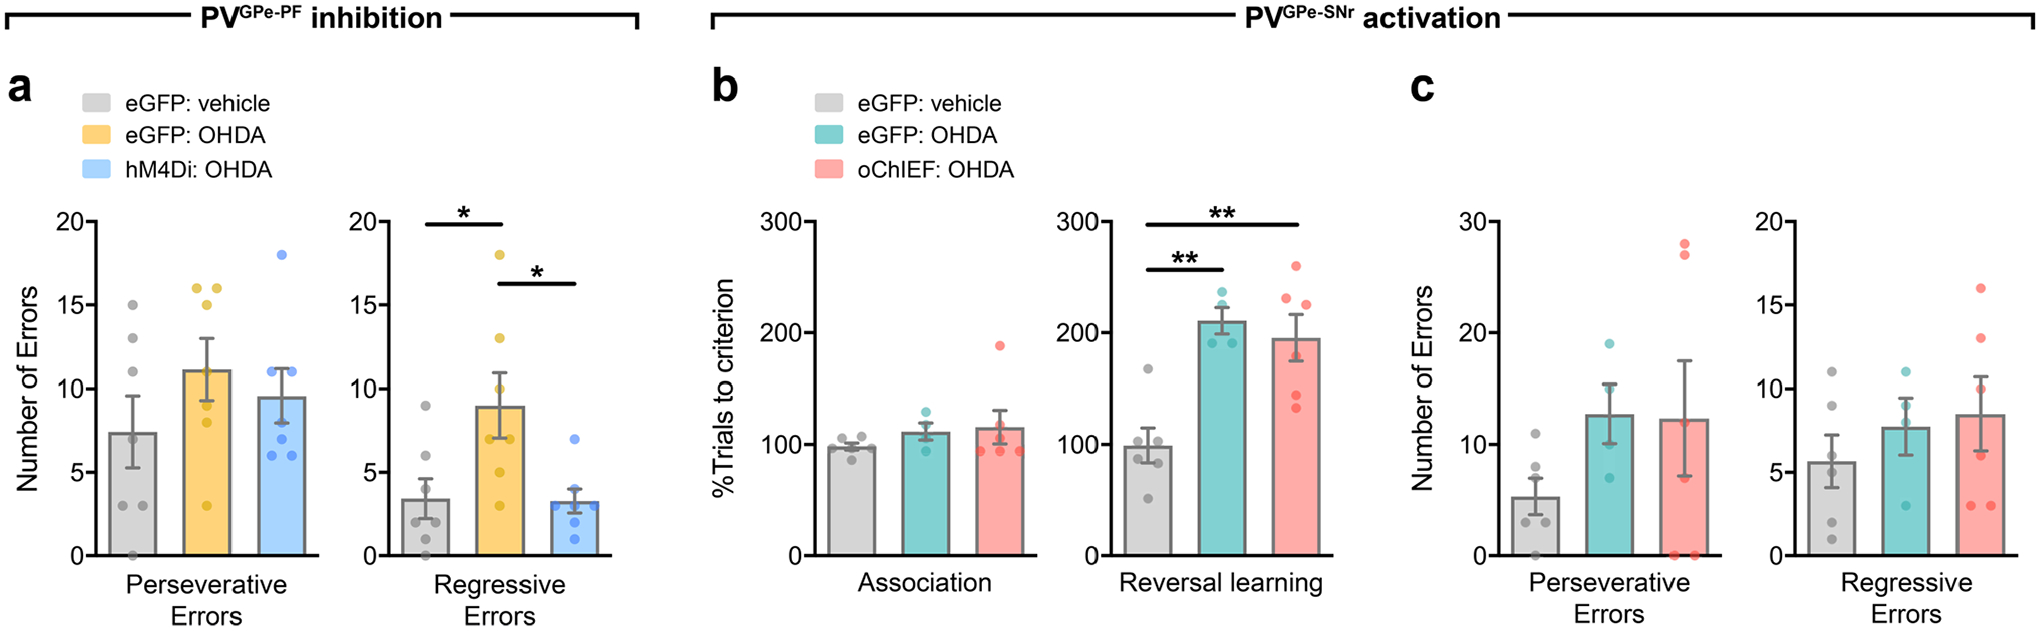
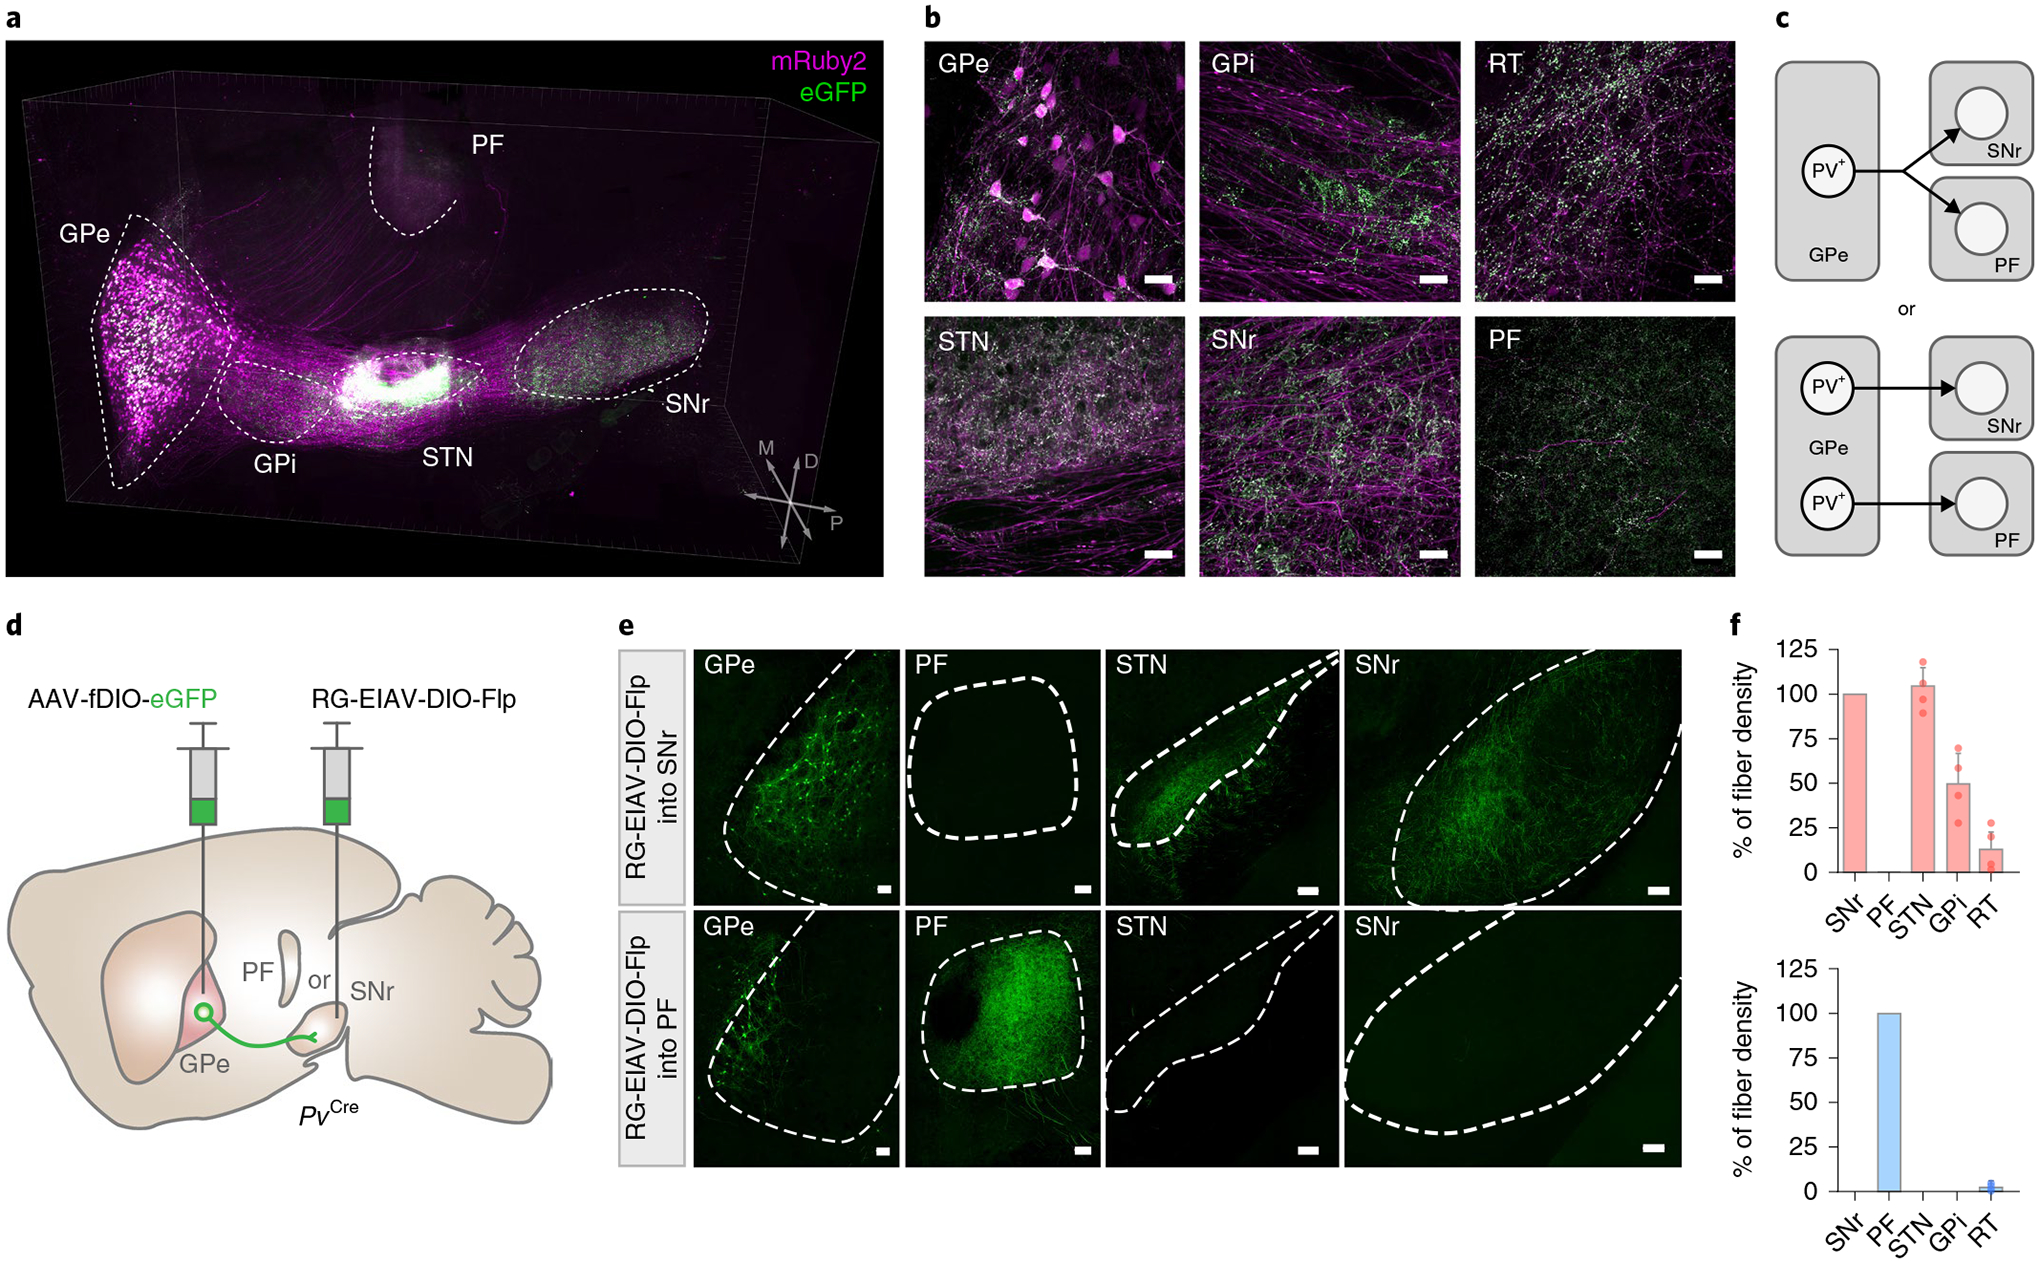
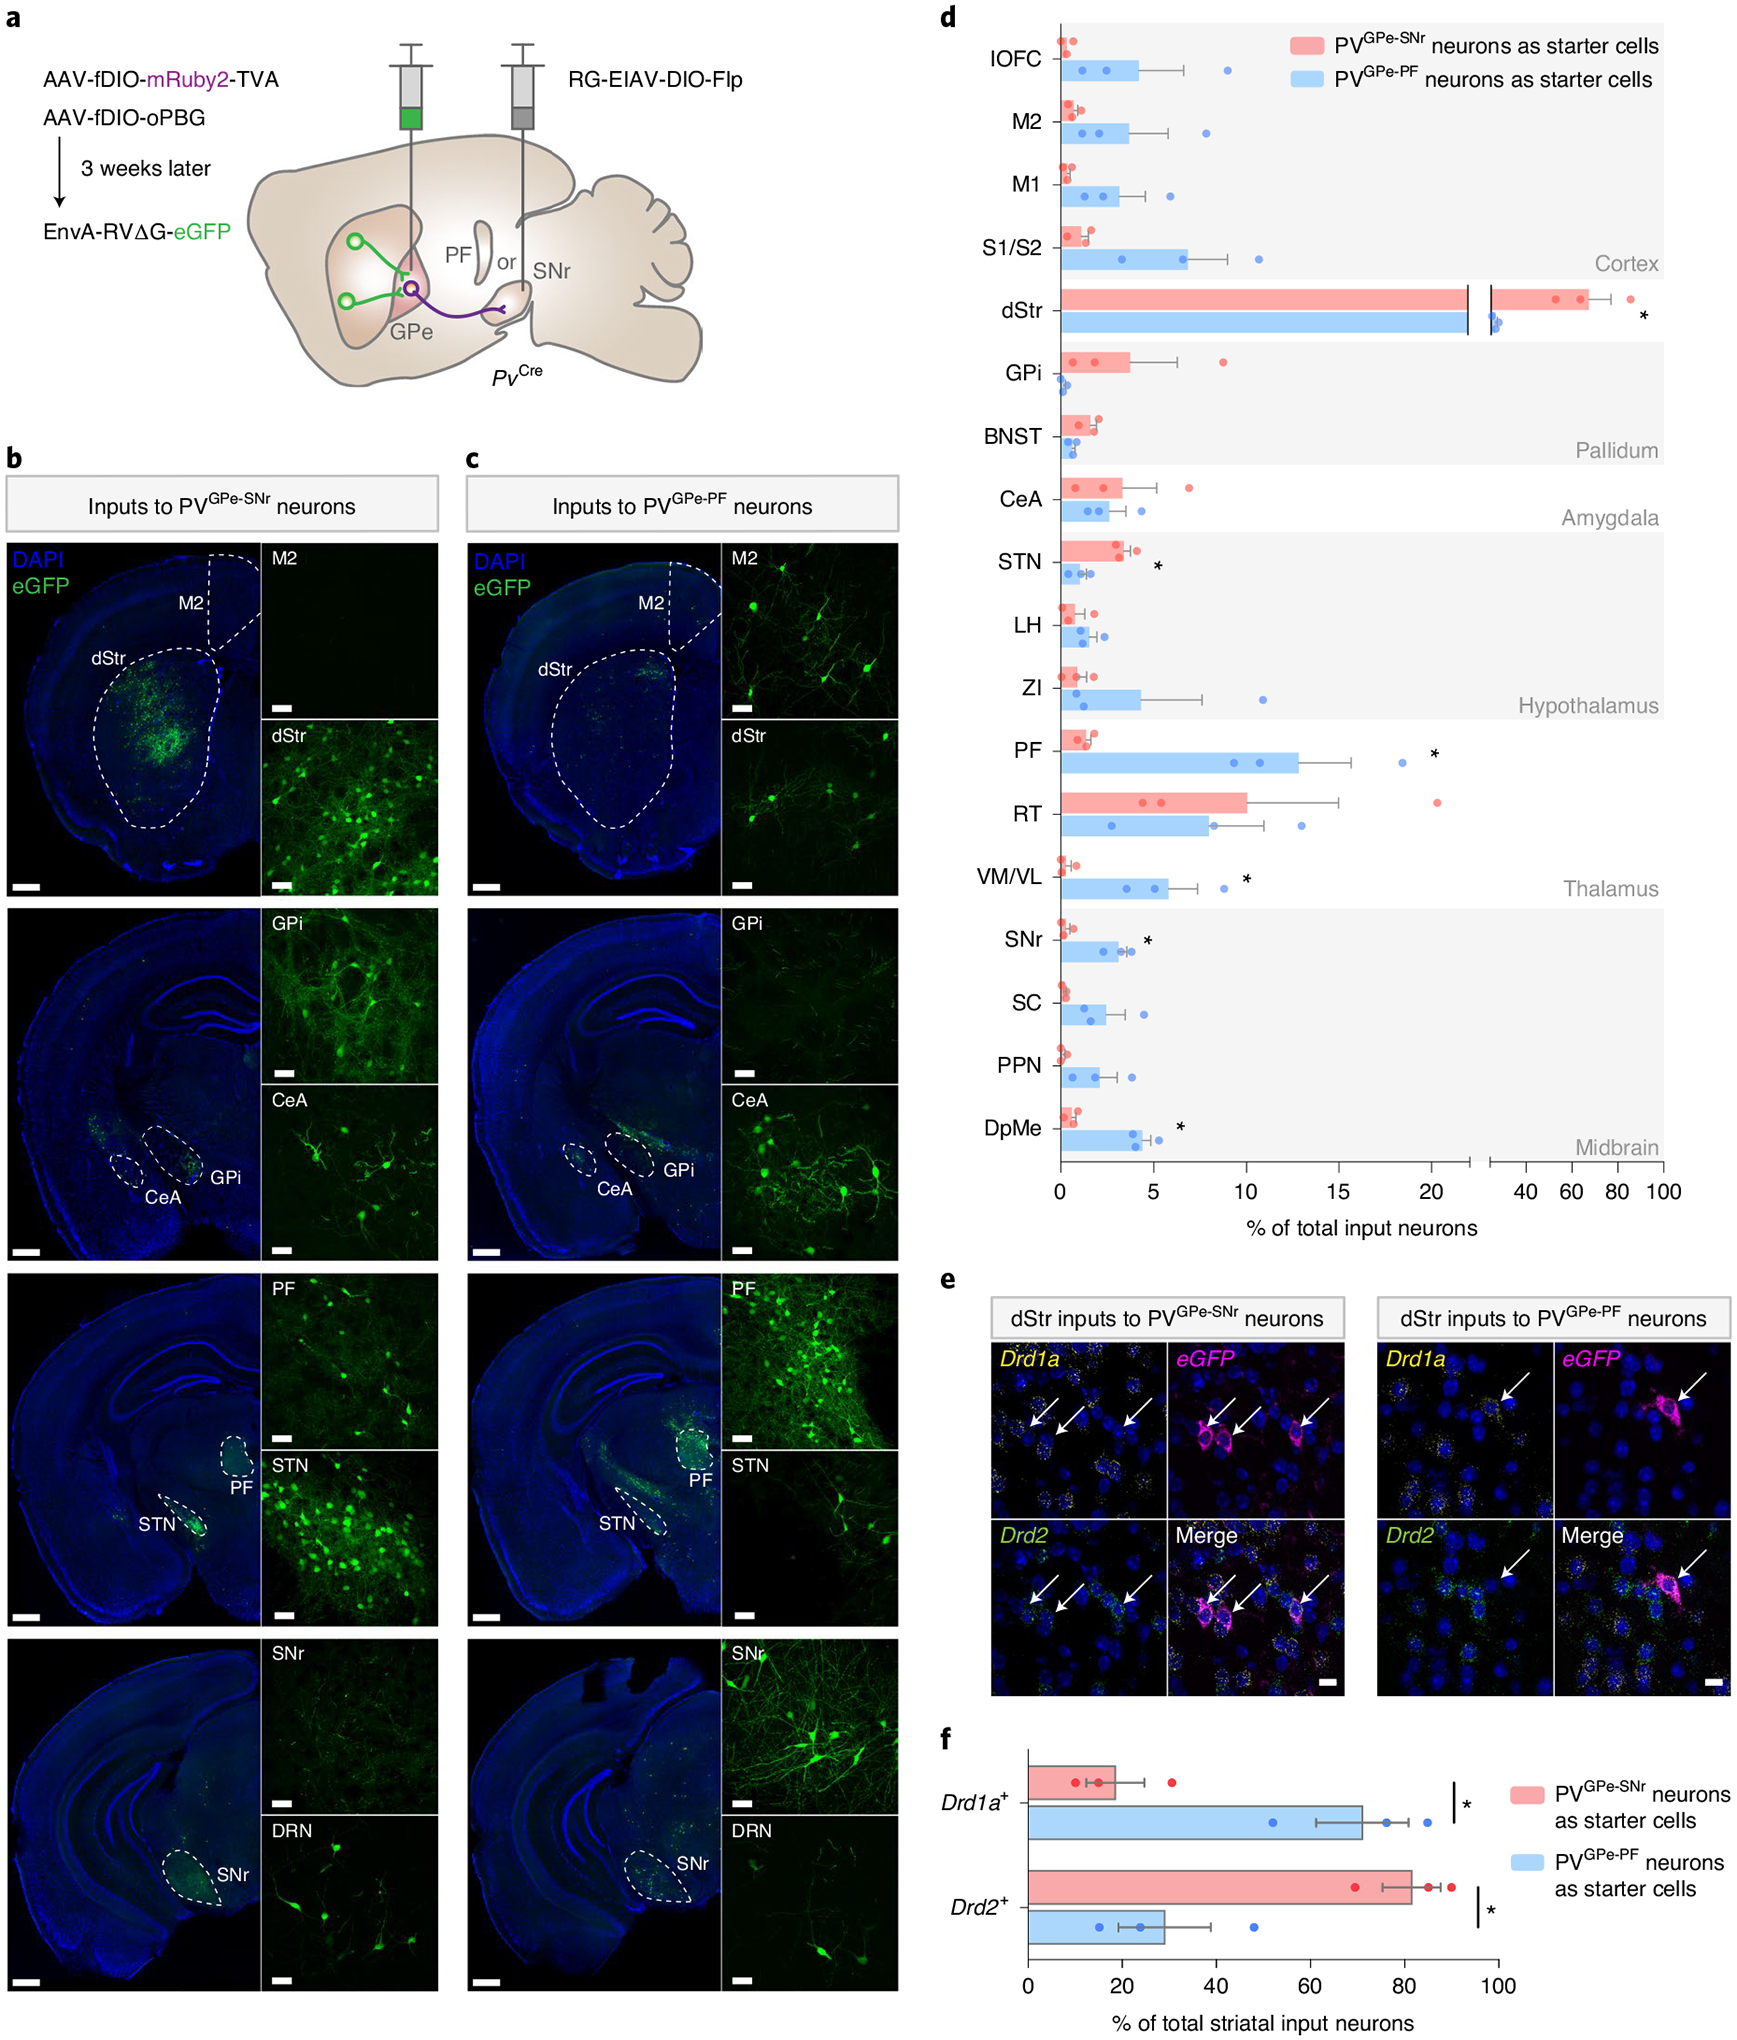
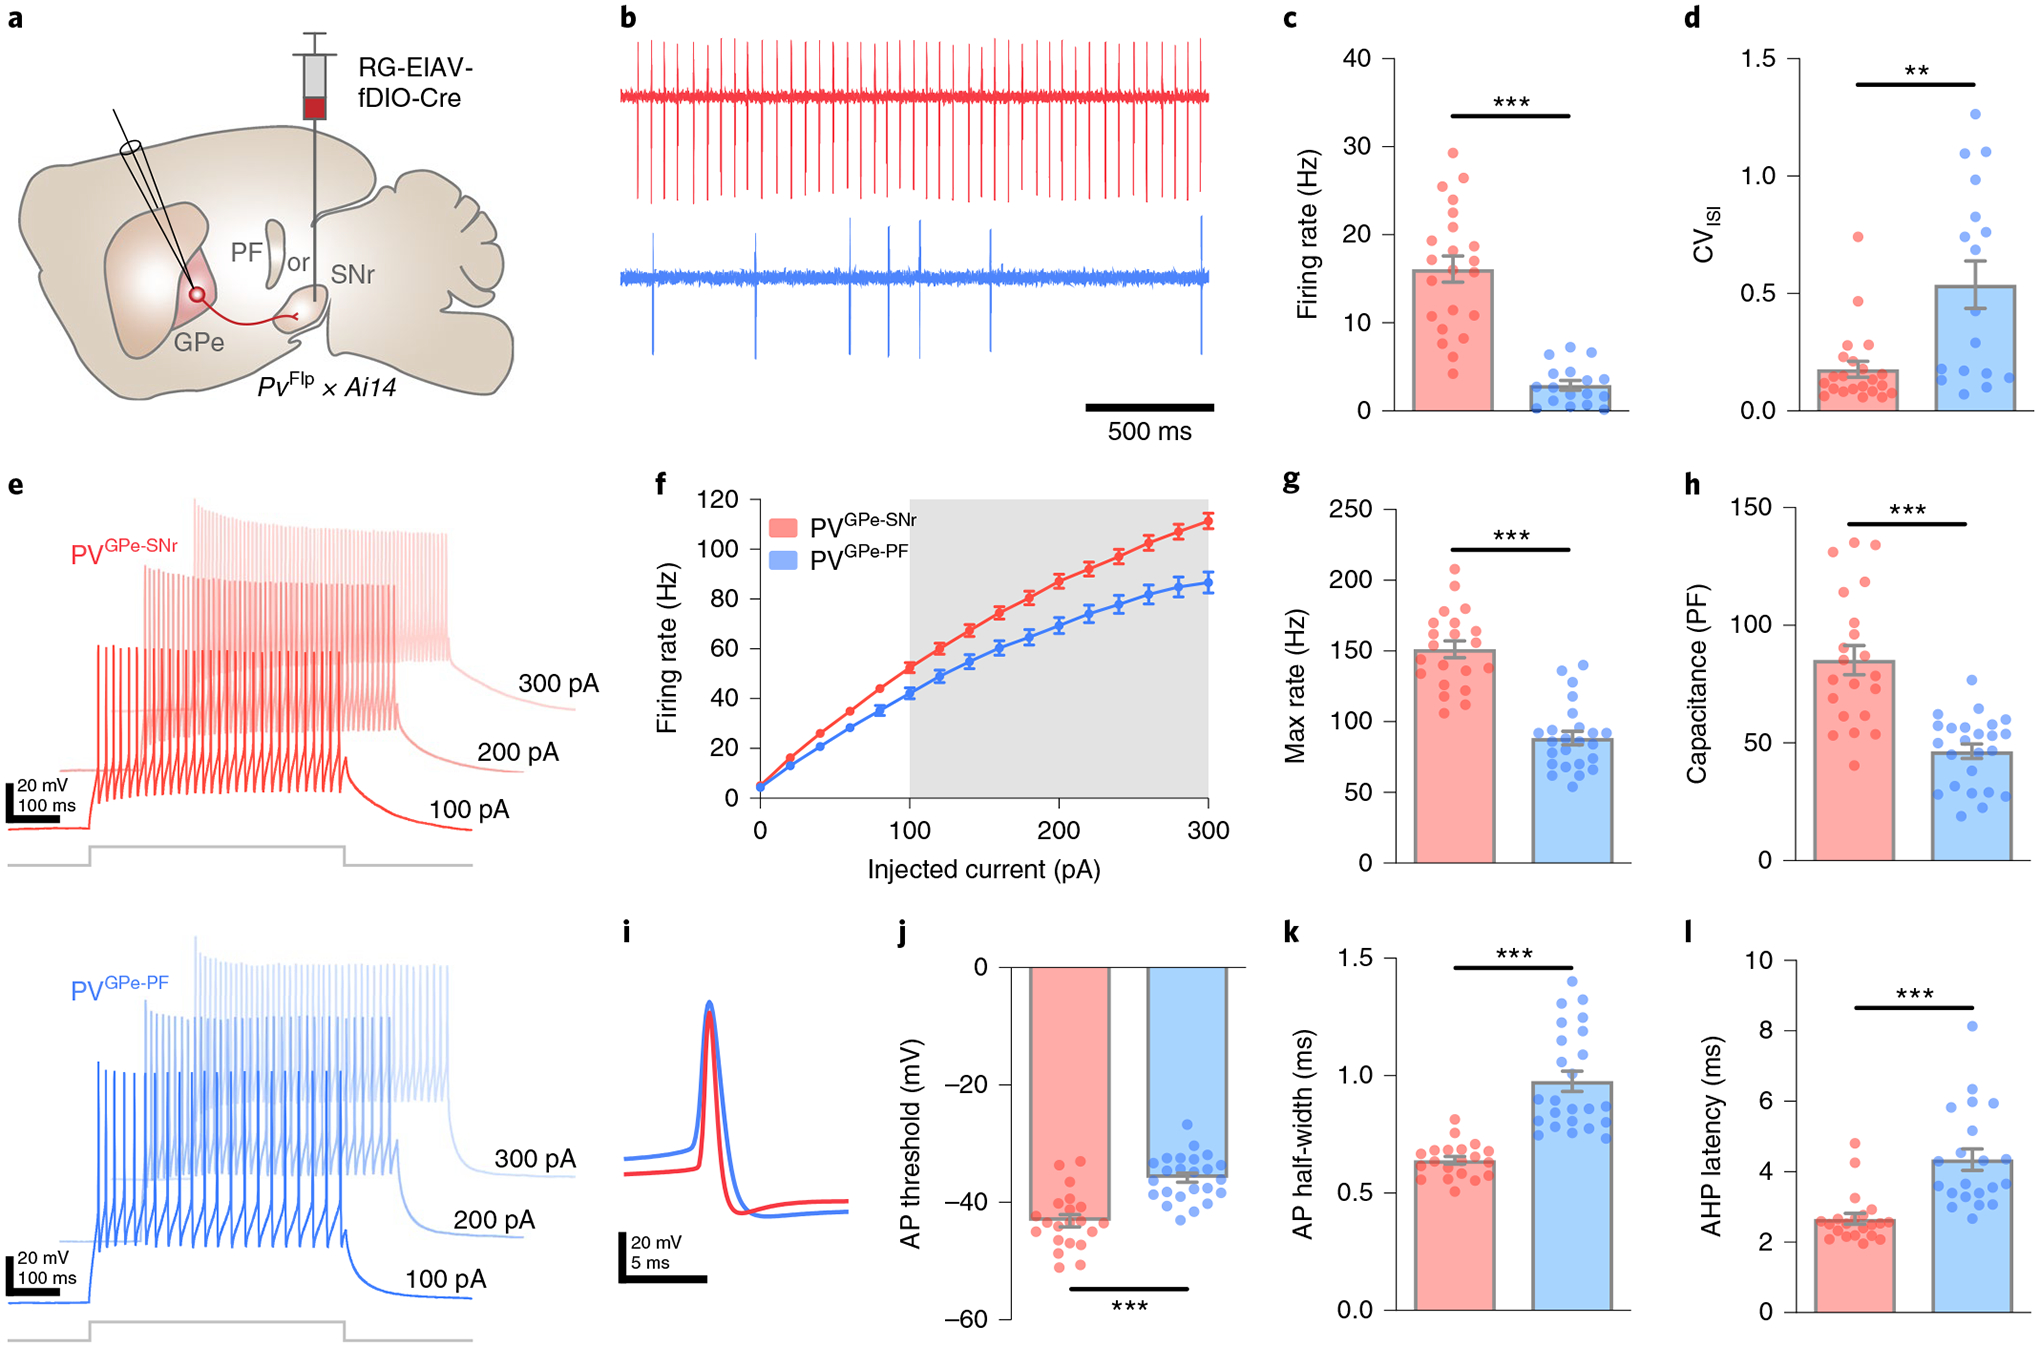
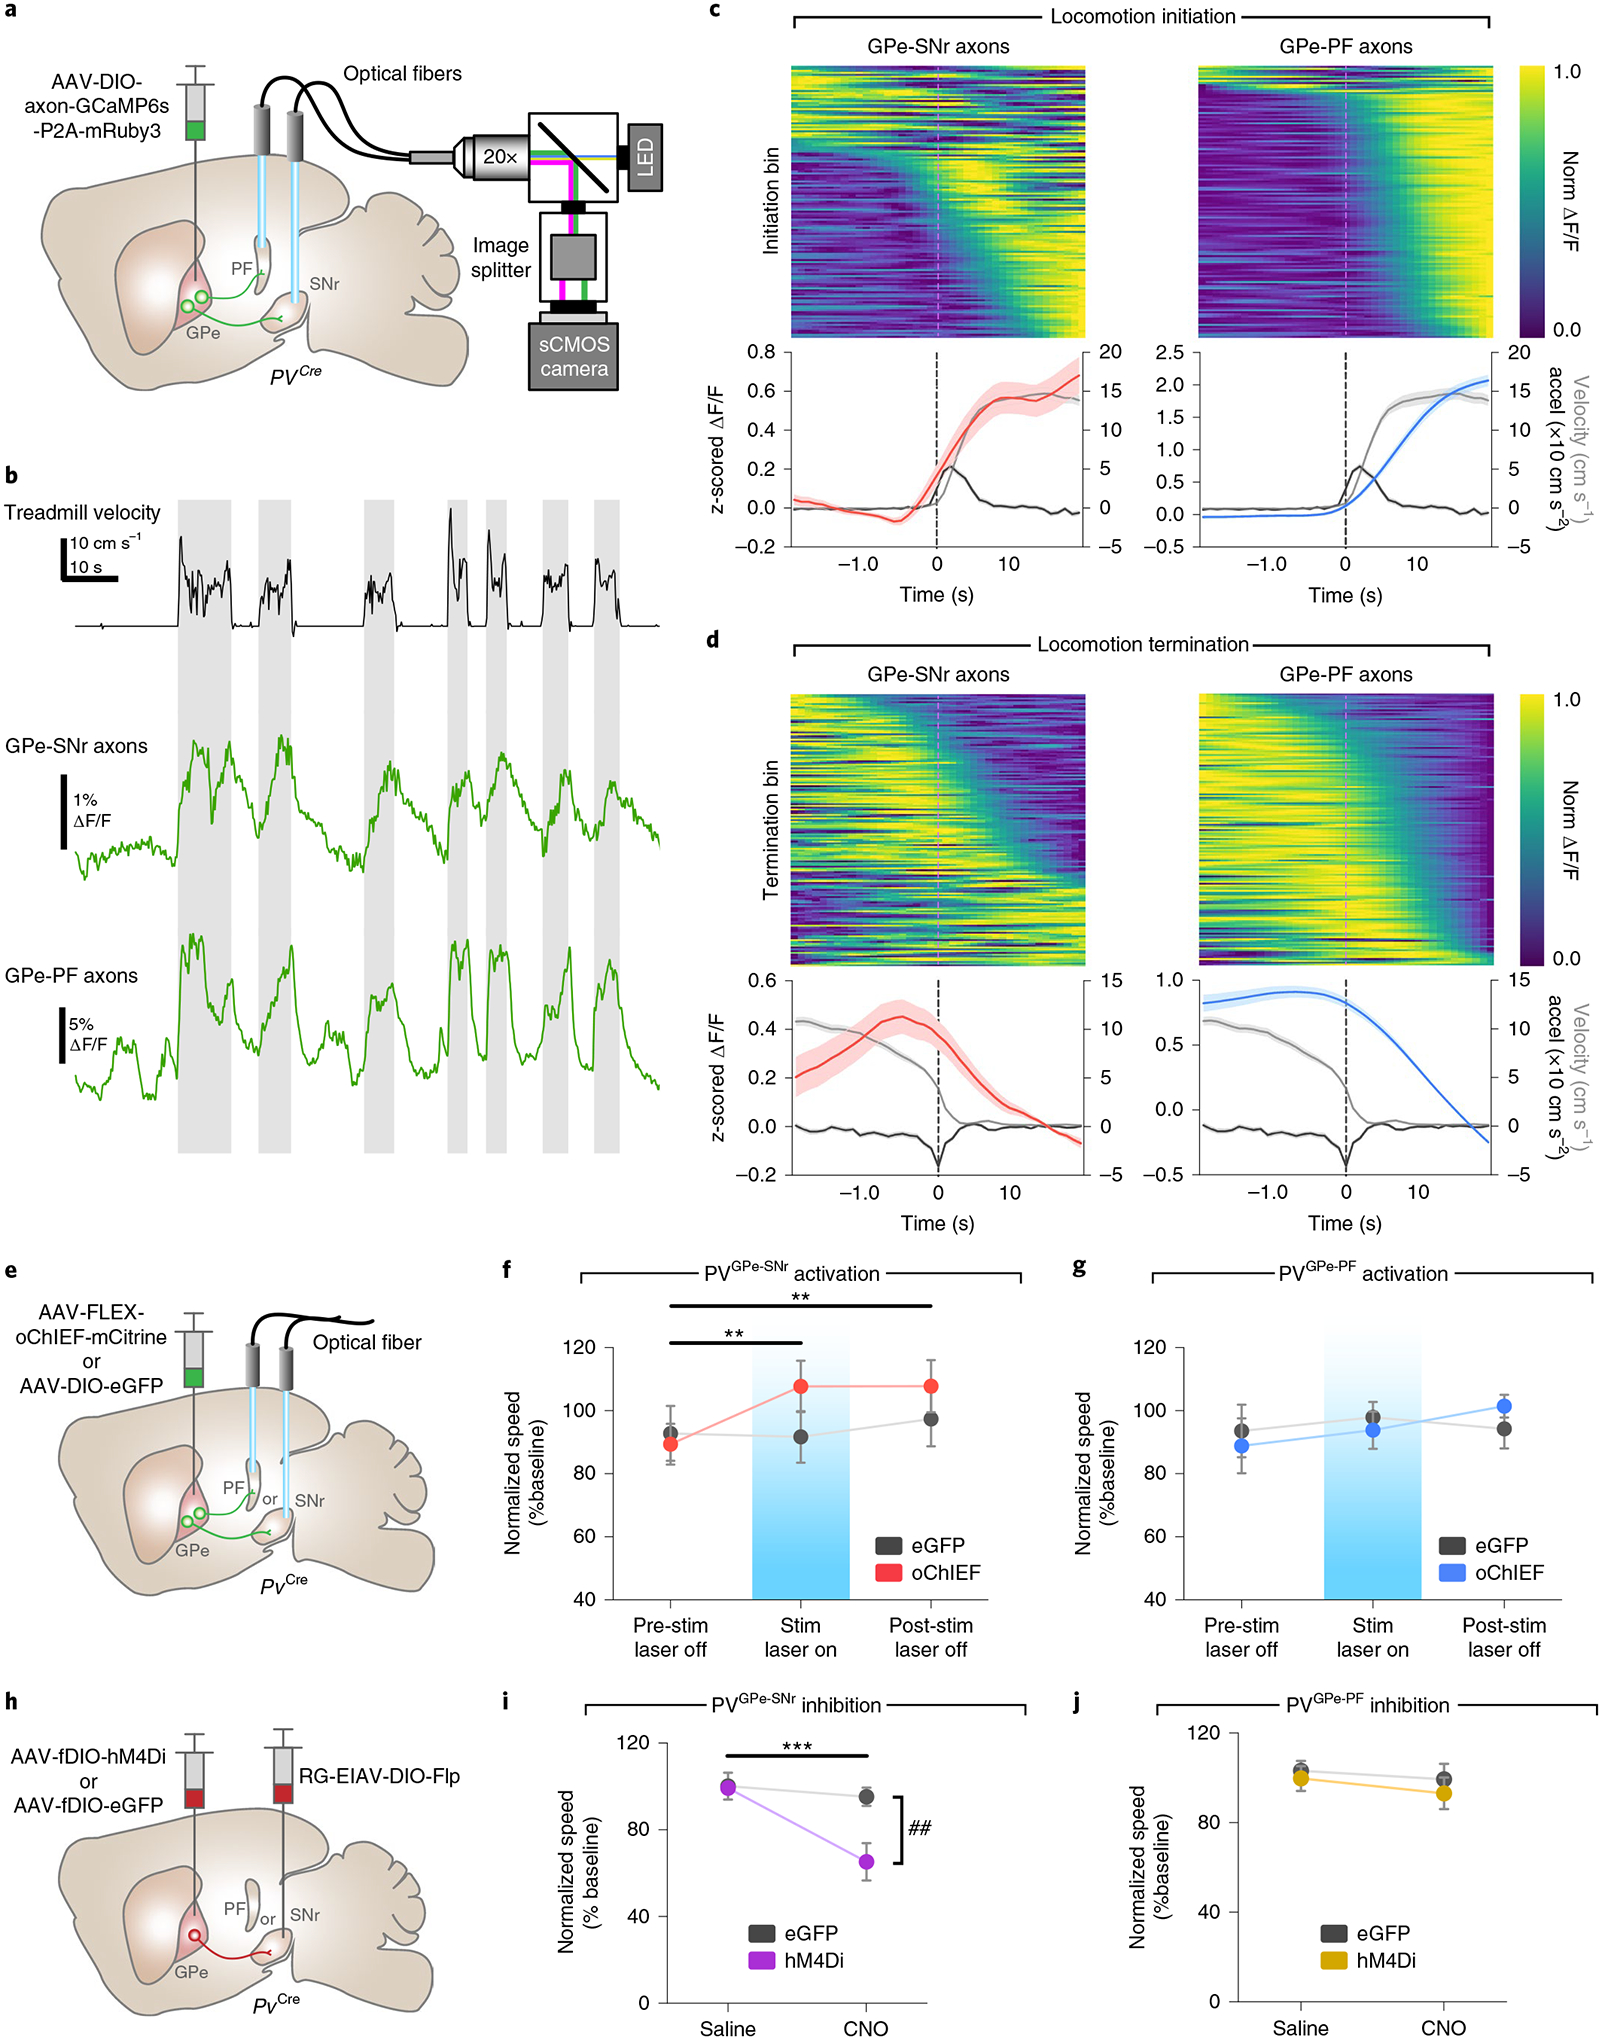
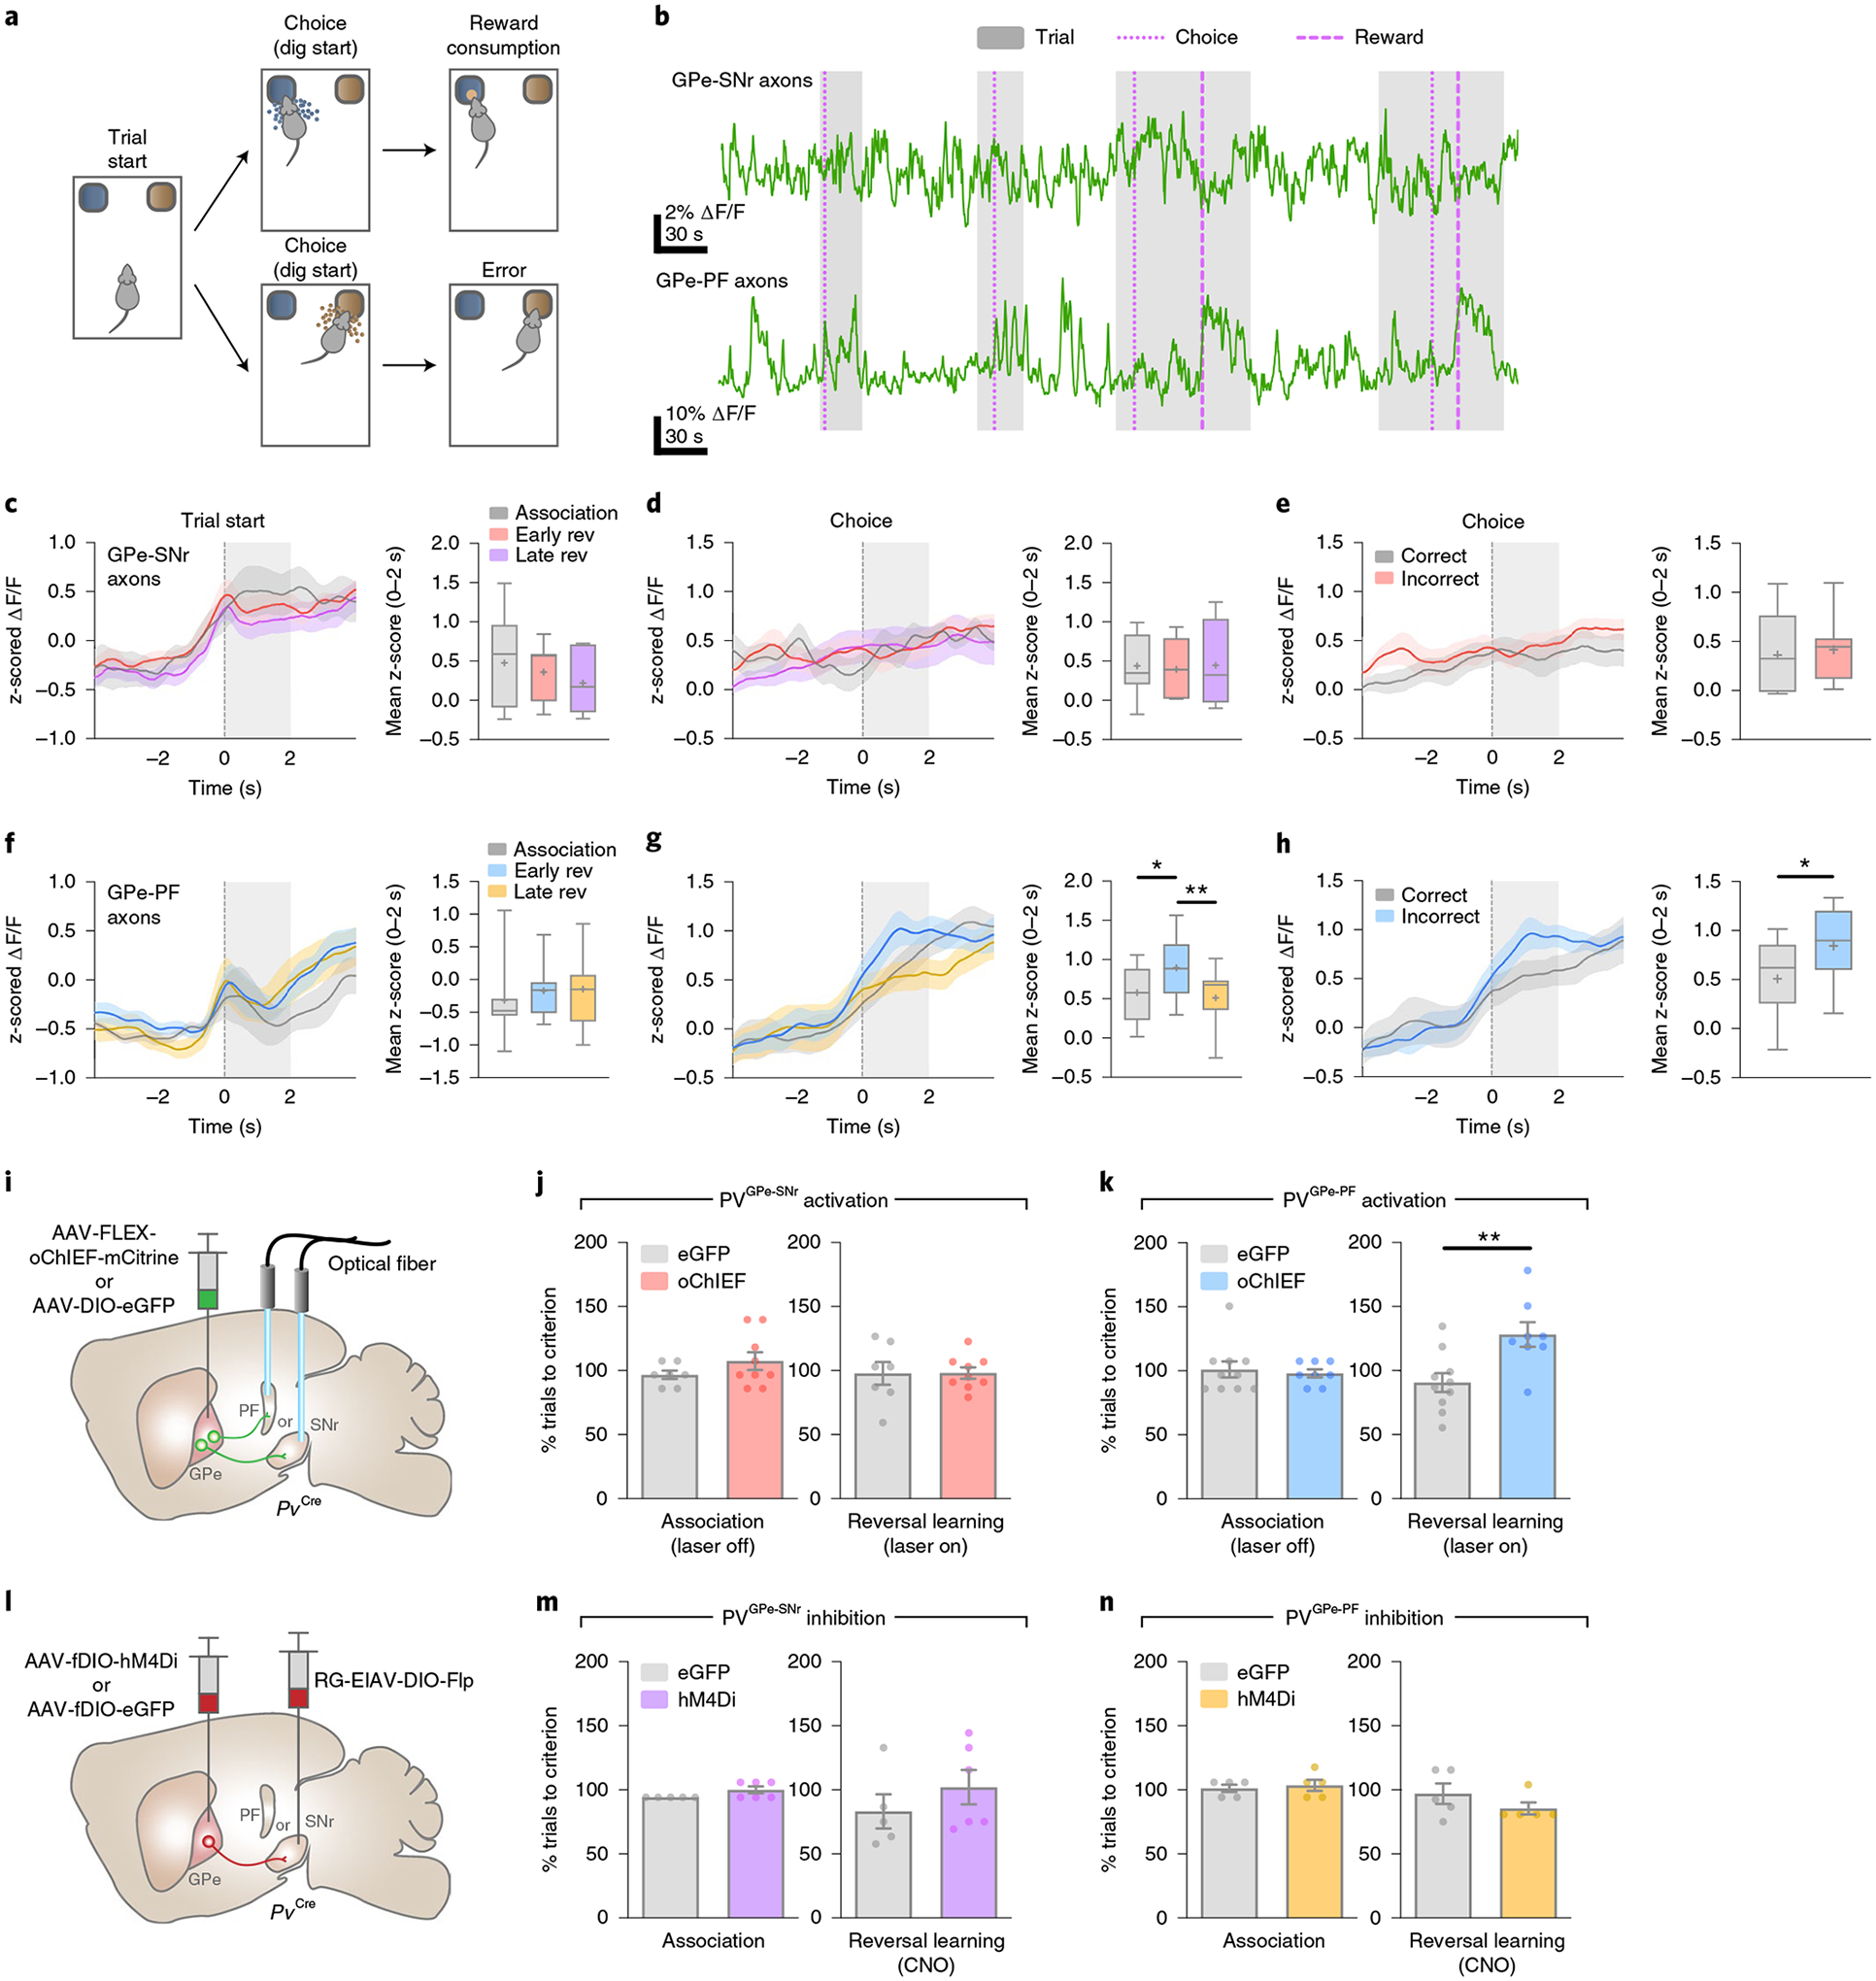
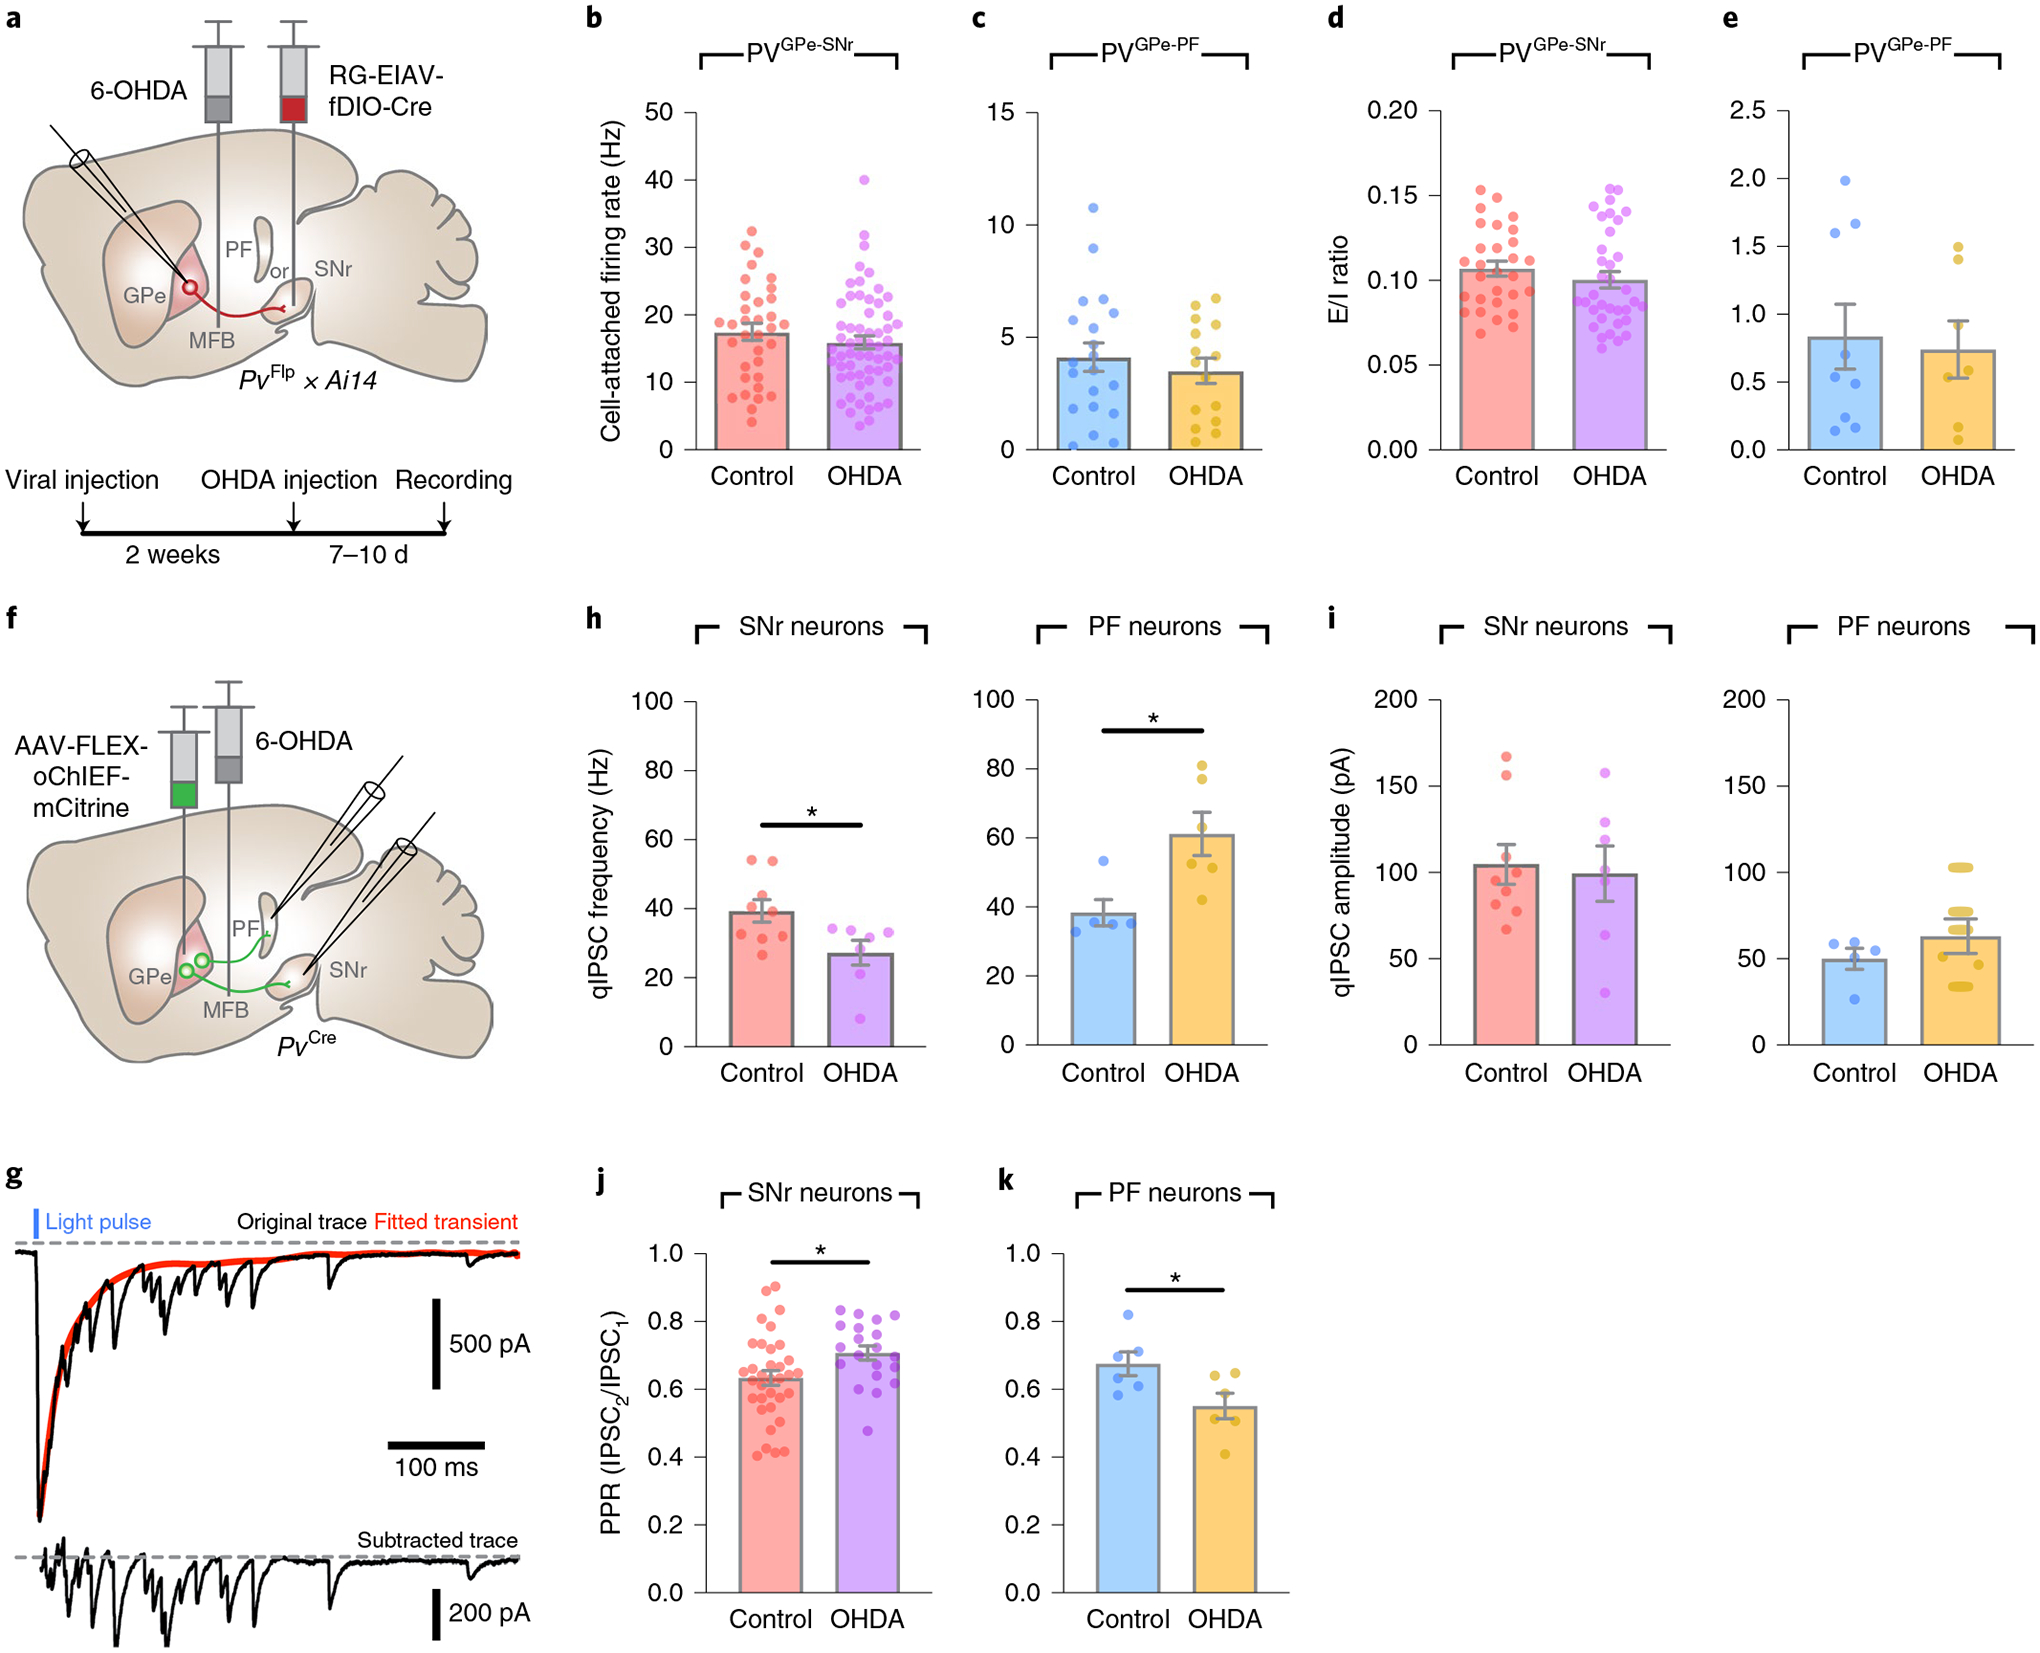
The basal ganglia regulate a wide range of behaviors, including motor control and cognitive functions, and are profoundly affected in Parkinson's disease (PD). However, the functional organization of different basal ganglia nuclei has not been fully elucidated at the circuit level. In this study, we investigated the functional roles of distinct parvalbumin-expressing neuronal populations in the external globus pallidus (GPe-PV) and their contributions to different PD-related behaviors. We demonstrate that substantia nigra pars reticulata (SNr)-projecting GPe-PV neurons and parafascicular thalamus (PF)-projecting GPe-PV neurons are associated with locomotion and reversal learning, respectively. In a mouse model of PD, we found that selective manipulation of the SNr-projecting GPe-PV neurons alleviated locomotor deficit, whereas manipulation of the PF-projecting GPe-PV neurons rescued the impaired reversal learning. Our findings establish the behavioral importance of two distinct GPe-PV neuronal populations and, thereby, provide a new framework for understanding the circuit basis of different behavioral deficits in the Parkinsonian state.


Conflict of interest statement

Competing interests

K.C. is a co-inventor on a patent application owned by MIT covering the SHIELD technology and is a co-founder of LifeCanvas Technologies.

Figures

Extended Data Fig. 1 |
Extended Data Fig. 1 |. Molecular identity of PVGPe-SNr and PVGPe-PF neurons.
a. mFISH experiments for PVGPe-SNr neurons (top row) and PVGPe-PF neurons (bottom row) with several molecular markers for GPe neurons including parvalbumin (Pvalb), somatostatin (Sst), sodium voltage-gated channel beta subunit 4 (Scn4b), LIM homeobox protein (Lhx6), NK2 homeobox 1 (Nkx2-1) and Forkhead box protein P2 (Foxp2). PVGPe-SNr and PVGPe-PF neurons are labelled by the probe against eGFP. Scale bar in a, 20 mm. b, c, Quantification of GFP-labelled PVGPe-SNr neurons (b, n = 3 mice) and GFP-labelled PVGPe-PF neurons (c, n = 4 mice) expressing specific molecular markers. Fractions show the number of neurons expressing each molecular marker out of total GFP positive neurons in sections.
Extended Data Fig. 2 |
Extended Data Fig. 2 |. Controls for fiber photometry recordings.
a, Optic fiber placements in PF and SNr for fiber photometry recordings. Different colors denote fibers from the same mouse (n = 7 mice). b, representative images from n = 7 mice used in photometry recordings showing mruby3 and axon-GCaMP6s expression in axons of GPe-PV neurons at implantation sites for optic fibers. Scale bars, 200 μm. c, Z-scored ΔF/F (averaged across all events) representing the activity of PVGPe-SNr axons at randomly chosen time points during treadmill locomotion. Number of events was determined based on the number of locomotion onsets in each recording session (n = 135 events). d, same as in c, but showing the activity of PVGPe-PF axons. e, Z-scored ΔF/F (averaged across 7 mice) representing the activity of PVGPe-SNr axons at randomly chosen time points during different stages of reversal-learning task. Number of events was determined based on the number of trials in each stage of the task. f, same as in e, but showing the activity of PVGPe-PF axons. Shaded areas accompanying the z-scored ΔF/F traces in c-f indicate SEM.
Extended Data Fig. 3 |
Extended Data Fig. 3 |. Validation of optogenetic activation and chemogenetic inhibition.
a-b, Fiber tip locations in PF (a) and SNr (b) for data in Figs. 4f–g, 5j–k, 7b and Extended Data Fig. 5, 8b–c. c, representative traces from cell-attached recording showing inhibition of firing activity in SNr neurons during photostimulation of PVGPe-SNr axons at different frequencies. d, Firing rates of SNr neurons during 5–50 Hz and constant photostimulation of PVGPe-SNr axons (n = 21 cells). Data presented as mean ± SEM. e. representative ex vivo cell-attached recording from PVGPe-SNr neurons (top) and PVGPe-PF neurons (bottom) expressing hM4Di. Gray bars show the application of CNO during recording. f-g. Summary data showing firing rates before and 2 min after CNO bath application of both PVGPe-SNr neurons (f; n = 3 cells; Paired t-test, t(2) = 9.259; *p = 0.0115) and PVGPe-PF neurons (g; n = 3 cells; Paired t-test, t(2) = 5.459; *p = 0.0320).
Extended Data Fig. 4 |
Extended Data Fig. 4 |. Structure of the reversal-learning task and comparison of overall neural activity during trials and inter-trial intervals.
a, Example task structure using gravel and sand as digging media to provided two different contexts. The food reward is paired with sand in the association phase and is later switched to gravel in the reversal-learning phase. b, Timeline of the task showing how the association, early, and late reversal-learning stages are defined for a representative mouse. Check marks and crosses represent correct and incorrect trials, respectively. c, Average speed of animals across different stages of the reversal learning task. Note that no significant difference in locomotion was observed at different stages of the task. (Left: Duration of Trial to Choice, n = 9 mice, One-way ANOVA, F(2, 24) = 0.4743, p = 0.6280; right: Duration of Choice, n = 9, One-way ANOVA, F(2, 24) = 0.7019, p = 0.5055). All data presented as mean ± SEM. d, Comparison of mean z-scored ΔF/F for PVGPe-SNr axons between trial periods and inter-trial intervals (ITI) during the association phase (left; Wilcoxon sign-rank test, W = −12; p = 0.3750, n = 7 mice) and reversal-learning phase (right; Wilcoxon sign rank test, W = −18; p = 0.1562, n = 7 mice). e, same as in d, but for PVGPe-PF axons during the association phase (left; Wilcoxon sign-rank test, W = −28; *p = 0.0156, n = 7 mice) and reversal-learning phase (right; Wilcoxon sign rank test, W = −28; *p = 0.0156, n = 7 mice).
Extended Data Fig. 5 |
Extended Data Fig. 5 |. Activation of PVGPe-PF neurons increased number of regressive errors made during reversal learning.
a-b, Number of errors during the reversal-learning phase made by mice that received photostimulation in PVGPe-SNr neurons (n = 7 mice for eGFP, n = 9 mice for oChIEF). a, Perseverative errors; Unpaired t-test, t(14) = 0.9432, p = 0.3616. b, regressive errors; Unpaired t-test, t(14) = 0.3002, p = 0.7684. c-d, Number of errors during the reversal-learning phase made by mice that received photostimulation in PVGPe-PF neurons (n = 10 mice for eGFP, n = 8 mice for oChIEF). c, Perseverative errors; Unpaired t-test, t(16) = 0.8109, p = 0.4293. d, regressive errors; Unpaired t-test, t(16) = 2.951, **p = 0.0094. All data presented as mean ± SEM.
Extended Data Fig. 6 |
Extended Data Fig. 6 |. Role of PVGPe-SNr and PVGPe-PF in reversal learning test for discriminated operant response in lever-pressing system.
a, A schematic diagram for behavioral task. After the rule switch, active lever becomes inactive, and vice versa. b-d, Traces of z-scored ΔF/F (averaged across 5 mice) from PVGPe-PF axons during session start (b), from start to lever pressing (c) and during lever pressing (d) at the different behavioral stage. Note that the fiber photometry signals for interval between session start and lever pressing was interpolated because of the difference in interval. e-g, Traces of z-scored ΔF/F (averaged across 4 mice) from PVGPe-SNr axons during session start (e), from start to lever pressing (f) and during lever pressing (g) at the different behavioral stage. Note that the fiber photometry signals for interval between session start and lever pressing was interpolated because of the difference in interval. h-k, Activation of PVGPe-SNr and PVGPe-PF axons did not affect association (h, j) and reversal (i, k) in operant discrimination tasks. l-o, Inhibition of PVGPe-SNr and PVGPe-PF axons did not affect association (l, n) and reversal (m, o) in operant discrimination tasks. Shaded areas accompanying the z-scored ΔF/F traces in b-g indicate SEM. All other data are presented as mean ± SEM.
Extended Data Fig. 7 |
Extended Data Fig. 7 |. Quantification of TH immunoreactivity.
a, representative image of TH immunoreactivity in the striatum of a mouse injected with vehicle (0.02% sodium ascorbate in 0.9% saline). b, representative image of TH immunoreactivity in the striatum 3 days after bilateral injection of low-dose 6-OHDA (1.25 μg/μl). c, representative image of TH immunoreactivity in the striatum 10 days after bilateral injection of high-dose 6-OHDA (2.5 μg/μl). d, Quantification of TH immunoreactivity at different stages of dopamine depletion in rescue experiments for reversal learning and locomotion. Data presented as % mean ± SEM of naïve control striatal sections (n = 6 mice for PVGPe-PF: eGFP (vehicle), n = 7 mice for PVGPe-PF: eGFP (OHDA), n = 7 mice for PVGPe-PF: hM4D (OHDA), n = 10 mice for PVGPe-SNr: eGFP (OHDA), and n = 11 mice for PVGPe-SNr: oChIEF (OHDA)). Scale bar, 1 mm (a-c).
Extended Data Fig. 8 |
Extended Data Fig. 8 |. Manipulation of PVGPe-PF but not PVGPe-SNr neurons rescues behavioral flexibility deficit in dopamine-depleted mice.
a, Number of errors during the reversal-learning phase made by mice that received chemogenetic inhibition in PVGPe-PF neurons after dopamine depletion (n = 7 mice for eGFP-vehicle, n = 7 mice for eGFP-OHDA, and n = 7 mice for hM4Di-OHDA). Left, perseverative errors; One-way ANOVA, F(2,18) = 0.9771, p = 0.3955. right, regressive errors; One-way ANOVA, F(2,18) = 5.595, p = 0.0129; Bonferroni’s post hoc test, *p = 0.0312 (eGFP-vehicle vs. eGFP-OHDA) and 0.0267 (eGFP-OHDA vs. hM4Di-OHDA). b, Performance of mice that received photostimulation in PVGPe-SNr neurons after dopamine depletion (n = 6 mice for eGFP-vehicle, n = 4 mice for eGFP-OHDA, and n = 6 mice for oChIEF-OHDA). Left, dopamine depletion did not affect performance in the association phase. One-way ANOVA, F(2,13) = 0.8222, p = 0.4611. right, activation of PVGPe-SNr neurons during reversal learning did not improved behavioral flexibility in dopamine-depleted mice. One-way ANOVA, F(2,13) = 11.69, p = 0.0012; Bonferroni’s post hoc test, **p = 0.0032 (eGFP-vehicle vs. eGFP-OHDA) and 0.0042 (eGFP-vehicle vs. oChIEF-OHDA). c, Number of errors during the reversal-learning phase made by mice in c. Left, perseverative errors; One-way ANOVA, F(2,13) = 1.308, p = 0.3038. right, regressive errors; One-way ANOVA, F(2,13) = 0.6464, p = 0.54. All data presented as mean ± SEM.
Fig. 1 |
Fig. 1 |. Distinct subpopulations of GPe-PV neurons project to the SNr and PF.
a, Three-dimensional rendering of a cleared mouse hemisphere showing brain-wide projection patterns of GPe-PV neurons labeled by mruby2 (soma, axonal fibers) and eGFP (pre-synaptic sites). b, representative confocal images of the injection site in GPe (top left) and target structures showing axonal fibers in magenta and synaptic puncta in green (repeated in n = 4 mice). Scale bar, 30 μm. c, Two possible projection patterns: GPe-PV neurons collateralize to multiple targets (left) or individual neurons project to distinct targets (right). d, Schematic of viral strategy using a pseudotyped equine infectious anemia lentivirus capable of neuron-specific retrograde infection (rG-EIAV). SNr or PF of PvCre mice is injected with rG-EIAV that expresses Flp recombinase in a Cre-dependent manner (rG-EIAV-DIO-Flp) and the GPe is injected with an AAV that expresses eGFP in a Flp-dependent manner (AAV-fDIO-eGFP). e, Confocal images of SNr- and PF-projecting GPe-PV neurons and their axons (repeated in n = 4 mice for each target area). Scale bar, 100 μm. f, The quantification of the axonal fibers of PVGPe-SNr neurons (top; n = 4 mice) and PVGPe-PF neurons (bottom; n = 4 mice) in projected areas measured by the fluorescent intensity. Data are presented as % mean ± s.e.m. of control sections.
Fig. 2 |
Fig. 2 |. Whole-brain mapping of inputs to PVGPe-SNr and PVGPe-PF neurons.
a, Viral strategy to map pseudotyped rabies-mediated monosynaptic inputs to PVGPe-SNr neurons. In PvCre mice, SNr or PF was injected with rG-EIAV-DIO-Flp, and GPe was injected with AAV-fDIO-TVA-mruby and AAV-fDIO-oPBG. EnvA-rVΔG-eGFP was subsequently injected into the GPe. b,c, representative images of select brain areas showing trans-synaptically labeled input neurons of PVGPe-SNr neurons (b) and PVGPe-PF neurons (c). repeated in n = 3 mice for each subpopulation. d, Whole-brain quantification of inputs to PVGPe-SNr and PVGPe-PF neurons. Data are presented as percentage of total cells in each brain area relative to the total number of brain-wide inputs. Unpaired t-tests performed for individual brain regions: t(4) = 4.212, *P = 0.0136 for dStr; t(4) = 4.883, *P = 0.0081 for STN; t(4) = 4.216, *P = 0.0135 for PF; t(4) = 3.588, *P = 0.0230 for VM/VL; t(4) = 5.992, *P = 0.0039 for SNr; t(4) = 7.299, *P = 0.0019 for DpMe (n = 3 mice for each subpopulation). *P < 0.05. e, representative images of striatal neurons sending input to PVGPe-SNr (left) and PVGPe-PF (right) neurons with cell-type-specific markers (repeated in n = 3 mice for each subpopulation). Arrows represent co-localization between striatal input neurons labeled by the rabies virus and mrNA labeled by cell-type-specific probes. f, Quantification of Drd1a+ or Drd2+ striatal inputs to PVGPe-SNr and PVGPe-PF neurons, showing that Drd1a+ striatal neurons project preferentially to PVGPe-PF neurons, whereas Drd2+ striatal neurons project preferentially to PVGPe-SNr neurons. Paired t-test, t(2) = 9.333; *P = 0.0113 (n = 3 mice for each subpopulation). *P < 0.05. Scale bars, 50 μm (b and c inset), 500 μm (b and c) and 10 μm (e). All data are presented as mean ± s.e.m. BNST, bed nucleus of stria terminalis; CeA, central amygdala; DpMe, deep mesencephalic nucleus; DrN, dorsal raphe nucleus; dStr, dorsal striatum; GPi, internal globus pallidus; lOFC, lateral orbitofrontal cortex; LH, lateral hypothalamus; M1, primary motor cortex; M2, secondary motor cortex; PPN, pedunculopontine nucleus; rT, reticular thalamus; S1/S2, somatosensory cortex; SC, superior colliculus; STN, subthalamic nucleus; VM/VL, ventromedial/ventrolateral thalamus; ZI, zona incerta.
Fig. 3 |
Fig. 3 |. PVGPe-SNr and PVGPe-PF neurons exhibit distinct electrophysiological properties.
a, Strategy using PvFlp × Ai14 mice for labeling GPe-PV neurons in a projection-specific manner. rG-EIAV-fDIO-Cre is injected into either SNr or PF. b, representative cell-attached recordings from PVGPe-SNr and PVGPe-PF neurons. c, Autonomous firing rate of PVGPe-SNr and PVGPe-PF neurons. Mann–Whitney U-test, U = 7, ***P = 1.764 × 10⁻⁹ (n = 22 cells from eight mice for PVGPe-SNr and n = 17 cells from seven mice for PVGPe-PF neurons). d, Firing regularity of PVGPe-SNr and PVGPe-PF neurons. Mann–Whitney U-test, U = 7, **P = 0.0019 (n = 22 cells for PVGPe-SNr and n = 17 cells for PVGPe-PF neurons). CVISI, coefficent of variation of interspike interval. e, representative traces of neuronal firing in response to 100-pA, 200-pA and 300-pA current injections in PVGPe-SNr and PVGPe-PF neurons. f, Action potential (AP) firing frequency in response to a range of current injections for PVGPe-SNr and PVGPe-PF neurons. Gray shading shows a significant difference (P < 0.05). Multiple t-tests, corrected for multiple comparisons using the Holm–Sidak method (n = 21 cells from seven mice for PVGPe-SNr and n = 24 cells from 11 mice for PVGPe-PF neurons). g, Maximum firing rate of PVGPe-SNr and PVGPe-PF neurons. Mann–Whitney U-test, U = 23, ***P = 2.831×10⁻⁹ (n = 21 cells for PVGPe-SNr and n = 24 cells for PVGPe-PF neurons). h, Membrane capacitance of PVGPe-SNr and PVGPe-PF neurons. Mann–Whitney U-test, U = 23, ***P = 1.001 × 10⁻⁶ (n = 21 cells for PVGPe-SNr and n = 24 cells for PVGPe-PF neurons). i, representative traces of AP waveforms recorded from PVGPe-SNr and PVGPe-PF neurons. j, AP threshold of PVGPe-SNr and PVGPe-PF neurons. Mann–Whitney U-test, U = 57, ***P = 1.851 × 10⁻⁶ (n = 21 cells for PVGPe-SNr and n = 24 cells for PVGPe-PF neurons). k, AP half-width of PVGPe-SNr and PVGPe-PF neurons. Mann–Whitney U-test, U = 10, ***P = 1.579 × 10⁻¹⁰ (n = 21 cells for PVGPe-SNr and n = 24 cells for PVGPe-PF neurons). l, After-hyperpolarization (AHP) latency of PVGPe-SNr and PVGPe-PF neurons. Mann–Whitney U-test, U = 32, ***P = 1.597 × 10⁻⁷ (n = 21 cells for PVGPe-SNr and n = 24 cells for PVGPe-PF neurons). All data are presented as mean ± s.e.m.
Fig. 4 |
Fig. 4 |. Activity of PVGPe-SNr neurons bidirectionally modulates locomotion.
a, Schematic of fiber photometry setup. b, representative ΔF/F traces of GCaMP6s fluorescence recorded from axonal fibers of PVGPe-SNr and PVGPe-PF neurons from one mouse (n = 7 mice total) and corresponding treadmill velocity (top). Shaded areas indicated locomotion bins. c, Top: ΔF/F aligned to locomotion initiations from all mice (ΔF/F was normalized for each row and sorted by time to half-maximum). Bottom: mean acceleration (black), velocity (gray) and z-scored ΔF/F triggered at locomotion initiation (mean across all events). d, Same as c, but aligned to locomotion terminations. e, Schematic of viral injections and optic fiber implantations for optogenetic activation. f, Activation of GPe-PV terminal in the SNr increased locomotion during stimulation and post-stimulation periods. Two-way repeated-measures ANOVA, main effectstim×group: F2,36 = 3.863, P = 0.0302; main effectstim: F2,36 = 5.513, P = 0.0082; main effectgroup: F1,18 = 0.5161, P = 0.4817; Bonferroni’s post hoc test, **P = 0.0029 for pre-stim laser off versus stim laser on and **P = 0.0027 for pre-stim laser off versus post-stim laser off (n = 10 mice for both eGFP and oChIEF). g, Activation of GPe-PV terminal in the PF had no effect on locomotion. Two-way repeated-measures ANOVA, main effectstim×group: F2,26 = 0.6664, P = 0.5221; main effectstim: F2,26 = 0.6870, P = 0.5120; main effectgroup: F1,13 = 0.0065, P = 0.9368 (n = 7 mice for eGFP and n = 8 mice for oChIEF). h, Schematic of viral injections for cell-type- and projection-specific expression of inhibitory DrEADD (hM4Di) in PVGPe-SNr and PVGPe-PF neurons. i, Inhibition of PVGPe-SNr neurons suppresses locomotion. Two-way repeated-measures ANOVA, main effecttreatment×group: F1,18 = 9.644, P = 0.0061; main effecttreatment: F1,18 = 17.30, P = 0.0006; main effectgroup: F1,18 = 4.968, P = 0.0388; Bonferroni’s post hoc test, ***P = 1.381 × 10⁻⁴ for saline-hM4Di versus CNO-hM4Di and ##P = 0.002 for CNO-eGFP versus CNO-hM4Di (n = 10 mice for both eGFP and hM4Di). j, Inhibition of PVGPe-PF neurons had no effect on locomotion. Two-way repeated-measures ANOVA, main effecttreatment×group: F1,10 = 0.069, P = 0.7980; main effecttreatment: F1,10 = 0.9681, P = 0.3484; main effectgroup: F1,10 = 0.5119, P = 0.4911; n = 6 mice for both eGFP and hM4Di). Data in fj are presented as mean speed (normalized to baseline) ± s.e.m. Shaded areas in c and d indicate s.e.m.
Fig. 5 |
Fig. 5 |. Activation of PVGPe-PF neurons impairs reversal learning.
a, Behavioral task schematic showing the structure of each trial; after the trial starts, the mouse makes a choice by digging in one of the two bowls. Only the correct choice yields a food reward. b, representative fiber photometry ΔF/F traces showing the activity of PVGPe-SNr and PVGPe-PF axons from one mouse (n = 7 mice total) encompassing four trials in the reversal learning phase. Thin dotted line, thick dotted line and shaded area represent dig start, the beginning of food consumption and trial period, respectively. c,d, Left: traces of z-scored ΔF/F (averaged across seven mice) from PVGPe-SNr axons aligned to trial start (c) and timing of choice (d). right: mean z-score from 0–2 s after behavioral onset. Early rev, early stage of reversal learning; Late rev, late stage of reversal learning. One-way repeated-measures ANOVA, effectstage: F2,12 = 1.300, P = 0.3084 in c and effectstage: F2,12 = 0.0378, P = 0.9630 in d. e, Left: traces of z-scored ΔF/F (averaged across seven mice) from PVGPe-SNr axons aligned to the timing of correct or incorrect choices during the reversal learning phase. right: mean z-score from 0–2 s after behavioral onset. Paired t-test, t(6) = 0.5930, P = 0.5748. f,g, Left: traces of z-scored ΔF/F (averaged across seven mice) from PVGPe-PF axons aligned to trial start (f) and timing of choice (g). right: mean z-score from 0–2 s after behavioral onset. One-way repeated-measures ANOVA, effectstage: F2,12 = 1.280, P = 0.3135 in e and effectstage: F2,12 = 8.008, P = 0.0062 in f; Bonferroni’s post hoc test, *P = 0.0279 and **P = 0.0084. h, Left: traces of z-scored ΔF/F (averaged across seven mice) from PVGPe-PF axons aligned to the timing of correct or incorrect choices during the reversal learning phase. right: mean z-score from 0–2 s after behavioral onset. Paired t-test, t(6) = 3.128, *P = 0.0204. i, Schematic of viral injections and optic fiber implantations for optogenetic activation during reversal learning. j, Activation of PVGPe-SNr axons did not affect behavioral flexibility during reversal learning. Unpaired t-test, t(14) = 0.0273, P = 0.9786; n = 7 mice for eGFP and n = 9 mice for oChIEF (500-ms pulses repeated every 1.5 s). k, Activation of PVGPe-PF axons during reversal learning impaired behavioral flexibility. Unpaired t-test, t(16) = 3.142, **P = 0.0063; n = 10 mice for eGFP and n = 8 mice for oChIEF (500-ms pulses repeated every 1.5 s). l, Schematic of viral injections and experimental timeline for cell-type- and projection-specific expression of inhibitory DrEADD (hM4Di) in PVGPe-SNr and PVGPe-PF neurons. m, Inhibition of PVGPe-SNr neurons during reversal learning had no effect on behavioral flexibility. Unpaired t-test, t(9) = 0.9840, P = 0.3508; n = 5 mice for eGFP and n = 6 mice for hM4Di. n, Inhibition of PVGPe-PF neurons during reversal learning had no effect on behavioral flexibility. Unpaired t-test, t(8) = 1.245, P = 0.2483; n = 5 mice for eGFP and n = 5 mice for hM4Di. Shaded areas accompanying the z-scored ΔF/F traces in ch indicate s.e.m. Box and whisker plots are used in the right panels of ch where the central line of the box and ‘+’ represent the median and the mean, respectively. The box extends from the 25th to 75th percentiles, and the whiskers go down to the smallest value and up to the largest. Data in j, k, m and n are presented as mean ± s.e.m.
Fig. 6 |
Fig. 6 |. PVGPe-SNr and PVGPe-PF neurons exhibit distinct electrophysiological adaptations to dopamine depletion.
a, Schematic of viral and 6-OHDA injections and the experimental timeline for the recording of PVGPe-SNr and PVGPe-PF neurons in acute slices after dopamine depletion. b,c, Autonomous firing rate in PVGPe-SNr neurons (b; control n = 34 cells from nine mice, OHDA n = 59 cells from 12 mice) and PVGPe-PF neurons (c; control n = 20 cells from eight mice, OHDA n = 15 cells from seven mice) recorded in cell-attached configuration in the presence of synaptic transmission blockers, NBQX and PTX in extracellular solution. Mann–Whitney U test, U = 849, P = 0.2213 in b and U = 139, P = 0.7297 in c. d,e, E/I ratio onto PVGPe-SNr neurons (d; control n = 29, OHDA n = 35 cells) and PVGPe-PF neurons (e; control n = 7, OHDA n = 9 cells) from naive control and dopamine-depleted mice. Mann–Whitney U test, U = 419, P = 0.2371 in d and U = 29, P = 0.8371 in e. f, Schematic of viral and 6-OHDA injections for measuring qIPSCs in acute slices after dopamine depletion while photostimulating PVGPe-SNr and PVGPe-PF axons. g, Example trace (top) showing qIPSCs in SNr neurons elicited by photostimulation of GPe-PV terminals. red trace represents a fitted curve generated by Python script. qIPSC amplitudes were measured from subtracted trace (bottom) from 0–400 ms after stimulation. h, Frequency of optically evoked qIPSCs was decreased and increased in when recorded from SNr and PF neurons, respectively. Unpaired t-test, t(14) = 2.485, *P = 0.0262 for SNr and t(9) = 2.947, *P = 0.0163 for PF (SNr control n = 9 cells from three mice, SNr OHDA n = 7 cells from three mice; PF control n = 5 cells from two mice, PF OHDA n = 6 cells from two mice). i, Amplitudes of optically evoked qIPSCs in SNr and PF neurons were not altered by dopamine depletion. Unpaired t-test, t(14) = 0.2773, P = 0.7856 for SNr and t(9) = 1.052, *P = 0.3204 for PF (SNr control n = 9 cells, SNr OHDA n = 7 cells; PF control n = 5 cells, PF OHDA n = 6 cells). j,k, PPr (second IPSC peak/first IPSC peak amplitude) measured from SNr neurons (j; control n = 34 cells from eight mice, OHDA n = 20 cells from six mice) and PF neurons (k; control n = 6 cells from three mice, OHDA n = 6 cells from four mice) of naive control and dopamine-depleted mice. Unpaired t-test, t(52) = 2.244, *P = 0.0291 in j and t(10) = 2.418, *P = 0.0362 in k. All data are presented as mean ± s.e.m.
Fig. 7 |
Fig. 7 |. PVGPe-SNr and PVGPe-PF neurons mediate different behavioral deficits in dopamine-depleted mice.
a, Schematic of viral injections, optical fiber and drug cannula implantations for optogenetic activation during locomotion in dopamine-depleted mice. b, Activation of PVGPe-SNr axons restored locomotor activity during stimulation and post-stimulation periods in dopamine-depleted mice. Two-way repeated-measures ANOVA, main effectstim×group: F2,38 = 2.691, P = 0.0807; main effectstim: F2,38 = 3.460, P = 0.0417; main effectgroup: F1,19 = 5.436, P = 0.0309; Bonferroni’s post hoc test, *P = 0.0476 for oChIEF pre-stim laser off versus oChIEF stim laser on, **P = 0.0050 for oChIEF pre-stim laser off versus oChIEF post-stim laser off, #P = 0.0409 for eGFP stim laser on versus oChIEF stim laser on and #P = 0.0327 for eGFP post-stim laser off versus oChIEF post-stim laser off (eGFP n = 10 mice, oChIEF n = 11 mice). c, Position of a control mouse in an open field over 60 min before (left) and after (right) dopamine depletion. The mouse received bilateral photostimulation in the SNr at 30–40 min after session start (blue line). d, Same as in b, but for a mouse with oChIEF expression in GPe-PV neurons. e, Schematic of viral injections and drug cannula implantations for cell-type- and projection-specific expression of inhibitory DrEADD (hM4Di) in PVGPe-PF neurons. f, Performance of mice that received chemogenetic inhibition in PVGPe-PF neurons after dopamine depletion. Mice in all groups received CNO injections (5 mg kg−1) in the reversal learning phase (n = 7 mice for eGFP-vehicle, n = 7 mice for eGFP-OHDA and n = 7 mice for hM4Di-OHDA). Left: dopamine depletion did not affect performance in the association phase. right: inhibition of PVGPe-PF neurons during reversal learning improved behavioral flexibility in dopamine-depleted mice. One-way ANOVA, F2,17 = 8.642, P = 0.0026; Bonferroni’s post hoc test, *P = 0.0114 and **P = 0.0046. All data are presented as mean ± s.e.m.

Comment in

References

    1. Graybiel AM Habits, rituals, and the evaluative brain. Annu. Rev. Neurosci 31, 359–387 (2008). - PubMed
    1. Nelson AB & Kreitzer AC Reassessing models of basal ganglia function and dysfunction. Annu. Rev. Neurosci 37, 117–135 (2014). - PMC - PubMed
    1. Kim J et al. Inhibitory basal ganglia inputs induce excitatory motor signals in the thalamus. Neuron 95, 1181–1196(2017). - PubMed
    1. Knowland D et al. Distinct ventral pallidal neural populations mediate separate symptoms of depression. Cell 170, 284–297 (2017). - PMC - PubMed
    1. Stephenson-Jones M et al. A basal ganglia circuit for evaluating action outcomes. Nature 539, 289–293 (2016). - PMC - PubMed

Publication types

LinkOut - more resources