. 2021 Apr;24(4):584-594.
doi: 10.1038/s41593-020-00794-1. Epub 2021 Mar 15.

Single-cell atlas of early human brain development highlights heterogeneity of human neuroepithelial cells and early radial glia

Affiliations

Single-cell atlas of early human brain development highlights heterogeneity of human neuroepithelial cells and early radial glia

Ugomma C Eze et al. Nat Neurosci. 2021 Apr.

Abstract

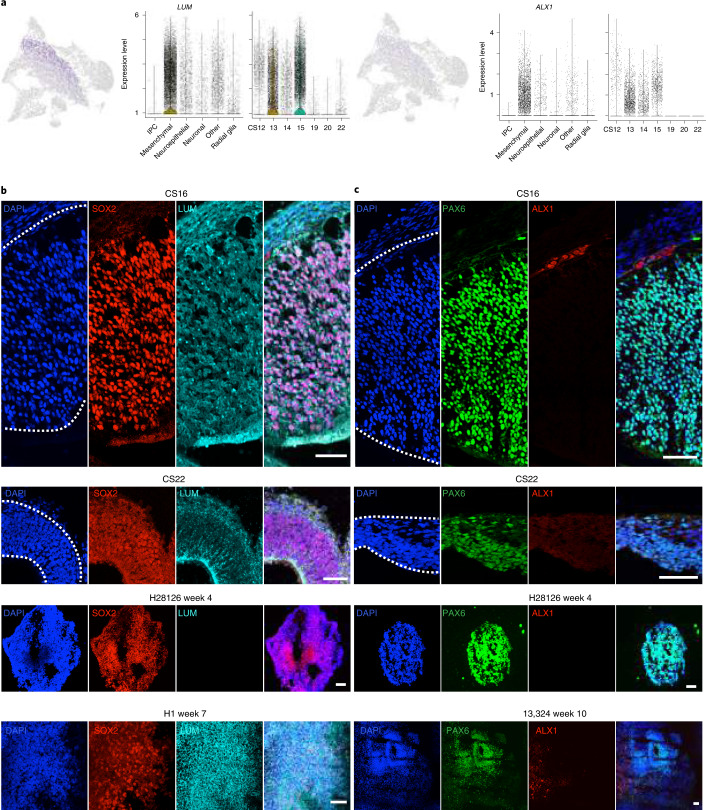
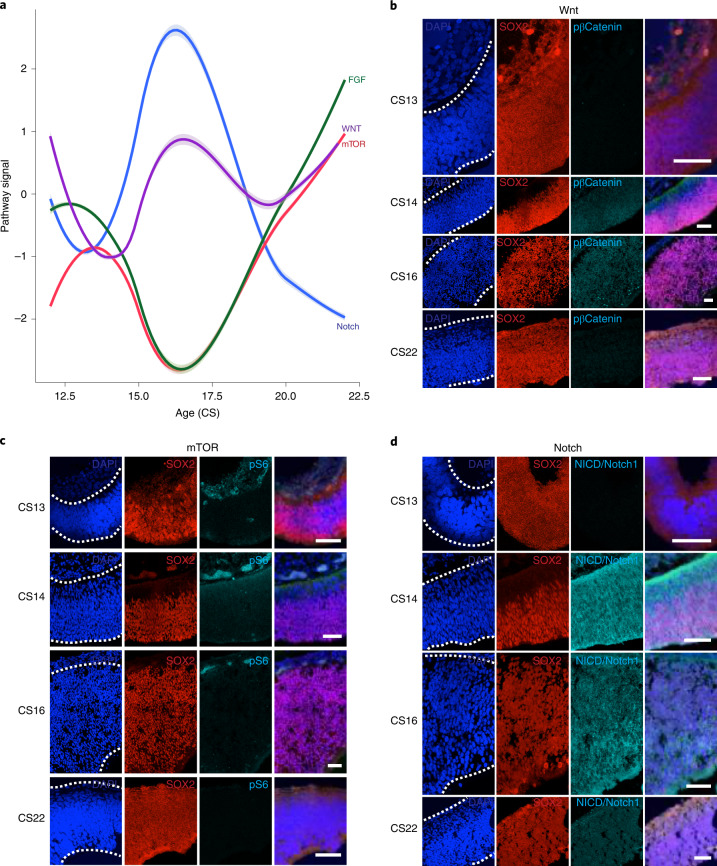
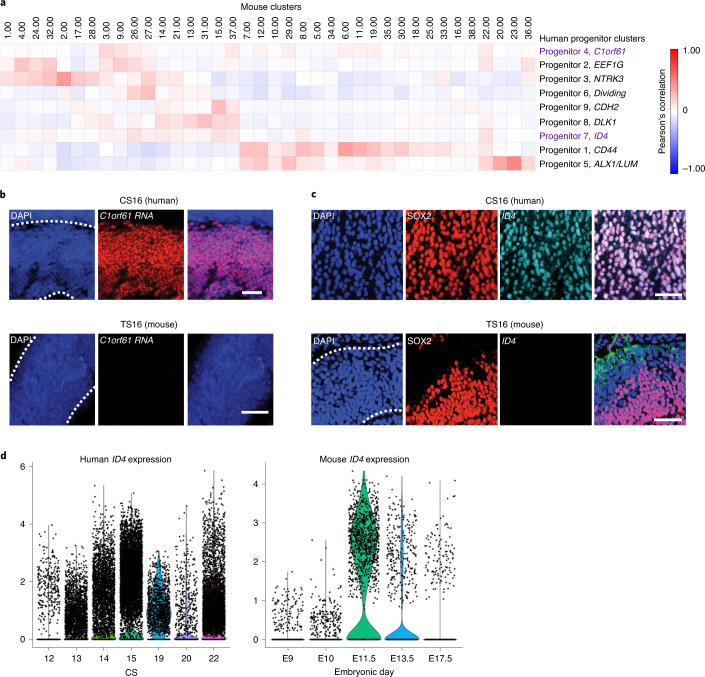
The human cortex comprises diverse cell types that emerge from an initially uniform neuroepithelium that gives rise to radial glia, the neural stem cells of the cortex. To characterize the earliest stages of human brain development, we performed single-cell RNA-sequencing across regions of the developing human brain, including the telencephalon, diencephalon, midbrain, hindbrain and cerebellum. We identify nine progenitor populations physically proximal to the telencephalon, suggesting more heterogeneity than previously described, including a highly prevalent mesenchymal-like population that disappears once neurogenesis begins. Comparison of human and mouse progenitor populations at corresponding stages identifies two progenitor clusters that are enriched in the early stages of human cortical development. We also find that organoid systems display low fidelity to neuroepithelial and early radial glia cell types, but improve as neurogenesis progresses. Overall, we provide a comprehensive molecular and spatial atlas of early stages of human brain and cortical development.


Conflict of interest statement

A.R.K. is a cofounder and board member of Neurona Therapeutics. The remaining authors declare no competing interests.

Figures

Fig. 1
Fig. 1. Cell types in the early human cortex.
a, scRNA-seq of early cortical development. UMAP plot of 58,145 telencephalon or cortical dissections colored by annotated cell type. Feature plots of markers of broad progenitors (SOX2), radial glia (NES), IPCs (PPP1R17) and neurons (BCL11B) are shown. Stacked bar chart shows cell type composition at earliest (CS12–13), middle (CS14–16) and late (CS19–22) first trimester. b, Spatial immunostaining of early cortical samples. Immunostaining for main cell type markers across first trimester stages. Because of limited sample availability, each sample was immunostained once. Nuclei shown in blue (4,6-diamidino-2-phenylindole (DAPI); dotted line demarcates cortical span), newborn neurons marked by DCX (green), progenitors by SOX2 (red), IPCs by TBR2 (yellow) and maturing neurons by CTIP2 (cyan). Scale bars, 50 μM; in CS13, 25 μM. c, RNA velocity demonstrates streams of direct and indirect neurogenesis. UMAP colored by age shows the segregation of samples by early and late first trimester stages. RNA-velocity trajectories are depicted by gray arrows in the middle UMAP plot with underlying color by cell types as annotated in a. Line thickness of the arrows indicates the differences in gene signature between cell types, and red arrows show predicted direct and indirect neurogenesis trajectories. The velocity plots on the right show the intensity of scored velocity for a progenitor gene, VIM, and a neuronal gene, MEF2C. Velocities highlight the distinction between progenitors and neurons in the clustering and velocity analyses.
Fig. 2
Fig. 2. Early progenitors can be divided into nine progenitor subtypes.
a, Transition from primarily neuroepithelial to radial glia progenitor identity. Immunostaining of early first trimester samples (including CS14, shown here) show strong staining for all progenitors (SOX2, red), as well as tight junctions (ZO-1, cyan), but limited staining for radial glia (NES, green). By CS22, NES staining increases substantially, ZO-1 decreases and SOX2 expression is maintained. Scale bars, 50 μM. b, scRNA-seq identifies nine progenitor subpopulations. Left: a UMAP plot depicts subclustered progenitor cells; middle: the velocity trajectory across progenitor subtypes. Right: feature plots show high expression of VIM and SOX2 marking all progenitor populations. c, NTRK3 marks progenitor populations before becoming a neuronally enriched marker. Progenitor cluster 3 is specifically and uniquely labeled by NTRK3, as shown in the violin plot. Immunostaining for NTRK3 (cyan) shows early labeling of SOX2 (red) positive progenitors at CS16 (white arrows), but expression shifts to more closely coincide with newborn neurons marked by DCX (green) by CS18 (white arrows). Scale bars, 50 μM. d, DLK1 marks a subset of early progenitors. DLK1 (cyan) is the top marker for progenitor cluster 8 and is exclusively expressed in early first trimester, as shown in the violin plot on the left. Immunostaining for DLK1 at CS16 shows colocalization with low SOX2 (red) expressing cells at the boundary of the cortical edge. This staining disappears from the cortex entirely by CS18 when DCX (green) staining emerges. For all panels, each sample was immunostained once.
Fig. 3
Fig. 3. scRNA-seq identifies early mesenchymal cell population.
a, LUM and ALX1 are mesenchymal cell type and early sample markers. In both progenitor and cortex clusterings, LUM marks a separate population of cells, as shown by the feature plot on the left. LUM expression is highly specific to the mesenchymal cell type and is enriched in early samples. ALX1 expression is highly correlated to LUM as shown in the right feature plot, and is similarly enriched in early, mesenchymal populations. b, LUM is widely expressed early and diminishes later. Immunostaining for LUM (cyan) shows prevalent expression in and between progenitors marked by SOX2 (red) at CS16, but this expression dissipates by CS22. However, expression of LUM does not begin until week 7 in the H1 organoid. Scale bars are 50 μM. c, ALX1 is sparsely expressed early and diminishes later. Immunostaining for ALX1 (cyan) shows sparse expression in PAX6 (green) positive cells; it disappears from the cortex but is expressed in surrounding brain structures at CS22. ALX1 expression does not begin until week 10 in the 13,234 cerebral organoids. For all panels, each sample was immunostained once. Scale bars, 50 μM.
Fig. 4
Fig. 4. Signaling pathway oscillations in the first trimester human cortical progenitors.
a, Signaling pathway oscillations in progenitor RNA expression patterns of the FGF (green), Wnt (purple), mTOR (red) and Notch (blue) signaling pathways, as defined by KEGG pathway designations in progenitors across ages sampled in this study. Error shading surrounding each bar indicates the loess regression 5–95% confidence interval. b, Wnt activity, as indicated by phosphorylated β-catenin (cyan), is highest in the CS14 and CS16 samples and colocalizes with progenitors (SOX2, red), but dissipates by CS22. c, mTOR activity, as indicated by phosphorylated S6 ribosomal protein (cyan), primarily localizes along the cortical plate (DCX, green) in the youngest samples and diminishes by CS22. d, Notch activity, as indicated by cleaved Notch intracellular domain (NICD) of Notch 1, peaks in expression at CS14 and localizes mainly to the ventricular zone. Nuclei are labeled by DAPI (blue). For all panels, each sample was immunostained once. Scale bars, 50 μm.
Fig. 5
Fig. 5. Mouse models different aspects of early cell types.
a, Comparison of mouse forebrain clusters to primary progenitor cell types. Heatmap showing the comparison of mouse forebrain clusters from 16,053 cells to the primary progenitor populations identified in this dataset. Correlations are performed using Pearson correlations between cluster marker sets and identify that progenitor clusters 4 and 7 do not have a counterpart in mouse data. b, C1orf61 is widely expressed in early human but not early mouse progenitors. Fluorescent in situ hybridization of human samples at CS16 shows broad expression of C1orf61 (cyan) in progenitor cells labeled by SOX2 (red). Parallel in situ staining in TS16 mouse shows no C1orf61 expression. Scale bars, 50 μM. c, ID4 is widely expressed in early human but not early mouse progenitors. Immunostaining of human samples at CS16 shows broad expression of ID4 (cyan) in progenitor cells labeled by SOX2 (red). A parallel staining in TS16 mouse shows no ID4 expression. Scale bars, 50 μM. d, Violin plots of ID4 RNA expression across several CSs (human) and embryonic days (mouse). ID4 RNA expression in the human persists onward from CS13. However, ID4 RNA expression in the mouse peaks at E11.5 (TS20) and dissipates. For all panels, each sample was immunostained once.

References

    1. Breunig JJ, Haydar TF, Rakic P. Neural stem cells: historical perspective and future prospects. Neuron. 2011;70:614–625. - PMC - PubMed
    1. Wilson SW, Houart C. Early steps in the development of the forebrain. Dev. Cell. 2004;6:167–181. - PMC - PubMed
    1. Beccari L, Marco-Ferreres R, Bovolenta P. The logic of gene regulatory networks in early vertebrate forebrain patterning. Mech. Dev. 2013;130:95–111. - PubMed
    1. Lui JH, Hansen DV, Kriegstein AR. Development and evolution of the human neocortex. Cell. 2011;146:18–36. - PMC - PubMed
    1. Gotz M, Hartfuss E, Malatesta P. Radial glial cells as neuronal precursors: a new perspective on the correlation of morphology and lineage restriction in the developing cerebral cortex of mice. Brain Res. Bull. 2002;57:777–788. - PubMed

Publication types