Observational Study
. 2021 Aug;300(2):E328-E336.
doi: 10.1148/radiol.2021204141. Epub 2021 Mar 16.

CT-derived Chest Muscle Metrics for Outcome Prediction in Patients with COVID-19

Affiliations
Observational Study

CT-derived Chest Muscle Metrics for Outcome Prediction in Patients with COVID-19

Simone Schiaffino et al. Radiology. 2021 Aug.

Abstract

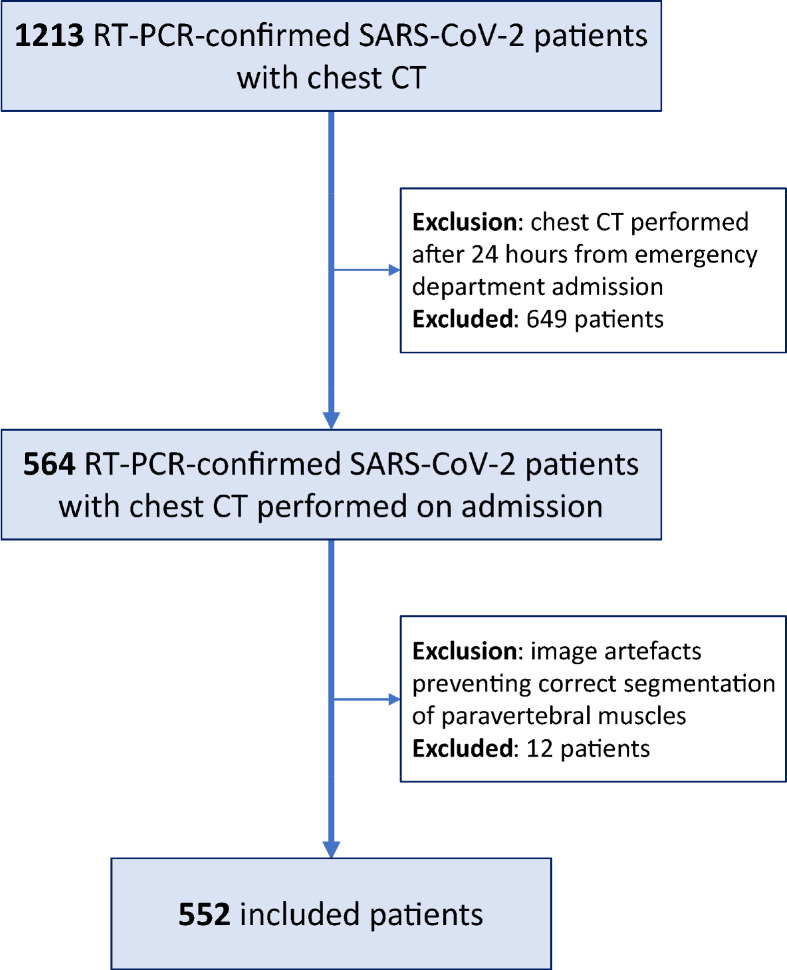
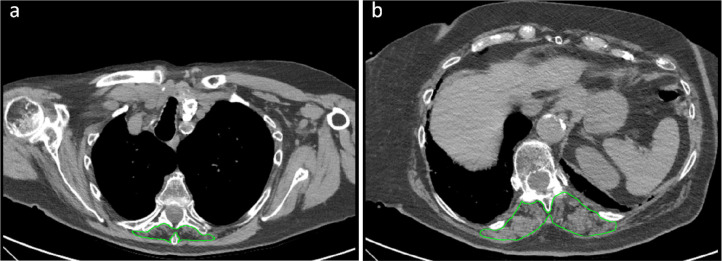
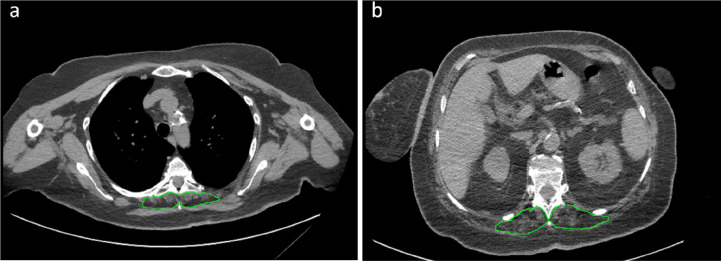
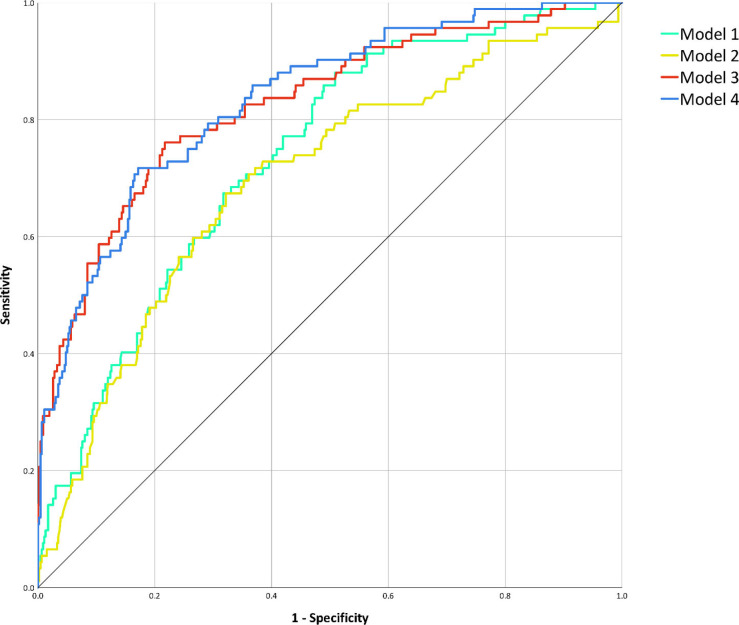
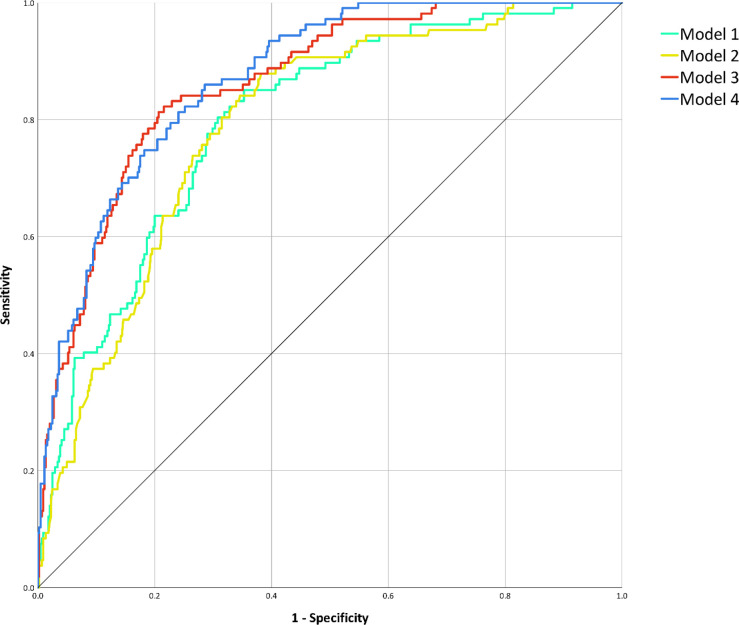
Background Lower muscle mass is a known predictor of unfavorable outcomes, but its prognostic impact on patients with COVID-19 is unknown. Purpose To investigate the contribution of CT-derived muscle status in predicting clinical outcomes in patients with COVID-19. Materials and Methods Clinical or laboratory data and outcomes (intensive care unit [ICU] admission and death) were retrospectively retrieved for patients with reverse transcriptase polymerase chain reaction-confirmed SARS-CoV-2 infection, who underwent chest CT on admission in four hospitals in Northern Italy from February 21 to April 30, 2020. The extent and type of pulmonary involvement, mediastinal lymphadenopathy, and pleural effusion were assessed. Cross-sectional areas and attenuation by paravertebral muscles were measured on axial CT images at the T5 and T12 vertebral level. Multivariable linear and binary logistic regression, including calculation of odds ratios (ORs) with 95% CIs, were used to build four models to predict ICU admission and death, which were tested and compared by using receiver operating characteristic curve analysis. Results A total of 552 patients (364 men and 188 women; median age, 65 years [interquartile range, 54-75 years]) were included. In a CT-based model, lower-than-median T5 paravertebral muscle areas showed the highest ORs for ICU admission (OR, 4.8; 95% CI: 2.7, 8.5; P < .001) and death (OR, 2.3; 95% CI: 1.0, 2.9; P = .03). When clinical variables were included in the model, lower-than-median T5 paravertebral muscle areas still showed the highest ORs for both ICU admission (OR, 4.3; 95%: CI: 2.5, 7.7; P < .001) and death (OR, 2.3; 95% CI: 1.3, 3.7; P = .001). At receiver operating characteristic analysis, the CT-based model and the model including clinical variables showed the same area under the receiver operating characteristic curve (AUC) for ICU admission prediction (AUC, 0.83; P = .38) and were not different in terms of predicting death (AUC, 0.86 vs AUC, 0.87, respectively; P = .28). Conclusion In hospitalized patients with COVID-19, lower muscle mass on CT images was independently associated with intensive care unit admission and in-hospital mortality. © RSNA, 2021 Online supplemental material is available for this article.


Figures

Flow diagram of patients’ enrollment.
Figure 1:
Flow diagram of patients’ enrollment.
Example of severely impaired muscle status with subsequent intensive care unit admission. Skeletal muscle area segmentation on chest CT images at T5 level (panel a) and T12 level (panel b) of a 79 years old female COVID-19 patient. This patient presented with fever, cough, mild bilateral lung parenchymal involvement (category 2 according to Bernheim et al. (17)), coexistence of ground-glass opacities and consolidations, no evidence of crazy paving, pleural effusion, or mediastinal lymphadenopathy. She had no comorbidities and no abnormalities in all considered laboratory tests (white blood cell count, lymphocyte count, platelet count). Muscle status parameters were however all impaired save for dorsal muscle index at T12 level: T5 paravertebral muscle area (890 mm2), T5 paravertebral muscle density (8 Hounsfield units), T5 dorsal muscle index (6.6 cm2/m2), T12 paravertebral muscle area (2440 mm2), and T12 paravertebral muscle density (5 Hounsfield units) were all in the lowest quartile of their overall distributions.
Figure 2:
Example of severely impaired muscle status with subsequent intensive care unit admission. Skeletal muscle area segmentation on chest CT images at T5 level (panel a) and T12 level (panel b) of a 79 years old female COVID-19 patient. This patient presented with fever, cough, mild bilateral lung parenchymal involvement (category 2 according to Bernheim et al. (17)), coexistence of ground-glass opacities and consolidations, no evidence of crazy paving, pleural effusion, or mediastinal lymphadenopathy. She had no comorbidities and no abnormalities in all considered laboratory tests (white blood cell count, lymphocyte count, platelet count). Muscle status parameters were however all impaired save for dorsal muscle index at T12 level: T5 paravertebral muscle area (890 mm2), T5 paravertebral muscle density (8 Hounsfield units), T5 dorsal muscle index (6.6 cm2/m2), T12 paravertebral muscle area (2440 mm2), and T12 paravertebral muscle density (5 Hounsfield units) were all in the lowest quartile of their overall distributions.
Example of severely impaired muscle status with subsequent intensive care unit admission and death. Skeletal muscle area segmentation on chest CT images at T5 level (panel a) and T12 level (panel b) of a 62 years old female COVID-19 patient. This patient presented with fever, dyspnea, mild bilateral lung parenchymal involvement (category 2 according to Bernheim et al. (17)), consolidations without groundglass opacities, no evidence of crazy paving, pleural effusion, or mediastinal lymphadenopathy. She had previous cardiovascular comorbidities, diabetes, and class I obesity. All considered laboratory tests (white blood cell count, lymphocyte count, platelet count) were within normal ranges. Muscle status parameters were however all impaired: T5 paravertebral muscle area (750 mm2), T5 paravertebral muscle density (10 Hounsfield units), T5 dorsal muscle index (2.9 cm2/m2), T12 paravertebral muscle area (2300 mm2), T12 paravertebral muscle density (5 Hounsfield units), and T12 dorsal muscle index (6.7 cm2/m2) were all in the lowest quartile of their overall distributions, with marked fatty degeneration both at T5 and T12 levels.
Figure 3:
Example of severely impaired muscle status with subsequent intensive care unit admission and death. Skeletal muscle area segmentation on chest CT images at T5 level (panel a) and T12 level (panel b) of a 62 years old female COVID-19 patient. This patient presented with fever, dyspnea, mild bilateral lung parenchymal involvement (category 2 according to Bernheim et al. (17)), consolidations without groundglass opacities, no evidence of crazy paving, pleural effusion, or mediastinal lymphadenopathy. She had previous cardiovascular comorbidities, diabetes, and class I obesity. All considered laboratory tests (white blood cell count, lymphocyte count, platelet count) were within normal ranges. Muscle status parameters were however all impaired: T5 paravertebral muscle area (750 mm2), T5 paravertebral muscle density (10 Hounsfield units), T5 dorsal muscle index (2.9 cm2/m2), T12 paravertebral muscle area (2300 mm2), T12 paravertebral muscle density (5 Hounsfield units), and T12 dorsal muscle index (6.7 cm2/m2) were all in the lowest quartile of their overall distributions, with marked fatty degeneration both at T5 and T12 levels.
Receiver operating characteristic curve analysis for the prediction of intensive care unit admission. After performing area under the curve comparison with the DeLong method, discrimination performances of Model 1 (clinical variables, area under the curve 0.74, 95% confidence interval 0.68–0.79, P < .001) did not significantly differ from those of Model 2 (muscle status, area under the curve 0.70, 95% confidence interval 0.64–0.76, P < .001; area under the curve comparison for Model 1 against Model 2: P = .217), nor did the ones of Model 3 (muscle status and chest CT features, area under the curve 0.83, 95% confidence interval 0.78–0.87, P < .001) and of Model 4 (clinical variables, muscle status, and chest CT features, area under the curve 0.83, 95% confidence interval 0.79–0.88, P < .001; area under the curve comparison against Model 3: P = .380). However, as depicted, both Model 1 and Model 2 discrimination performances were significantly inferior to those of Model 3 and Model 4 (all area under the curve comparisons: P < .001).
Figure 4:
Receiver operating characteristic curve analysis for the prediction of intensive care unit admission. After performing area under the curve comparison with the DeLong method, discrimination performances of Model 1 (clinical variables, area under the curve 0.74, 95% confidence interval 0.68–0.79, P < .001) did not significantly differ from those of Model 2 (muscle status, area under the curve 0.70, 95% confidence interval 0.64–0.76, P < .001; area under the curve comparison for Model 1 against Model 2: P = .217), nor did the ones of Model 3 (muscle status and chest CT features, area under the curve 0.83, 95% confidence interval 0.78–0.87, P < .001) and of Model 4 (clinical variables, muscle status, and chest CT features, area under the curve 0.83, 95% confidence interval 0.79–0.88, P < .001; area under the curve comparison against Model 3: P = .380). However, as depicted, both Model 1 and Model 2 discrimination performances were significantly inferior to those of Model 3 and Model 4 (all area under the curve comparisons: P < .001).
Receiver operating characteristic curve analysis for the prediction of death during hospitalization. After performing area under the curve comparison with the DeLong method, discrimination performances of Model 1 (clinical variables, area under the curve 0.80, 95% confidence interval 0.75–0.84, P < .001) did not significantly differ from those of Model 2 (muscle status, area under the curve 0.79, 95% confidence interval 0.75–0.83, P < .001; area under the curve comparison for Model 1 against Model 2: P = .599), nor did the ones of Model 3 (muscle status and chest CT features, area under the curve 0.86, 95% confidence interval 0.83–0.90, P < .001) and of Model 4 (clinical variables, muscle status, and chest CT features, area under the curve 0.87, 95% confidence interval 0.84–0.91, P < .001; area under the curve comparison against Model 3: P = .282). However, as depicted, both Model 1 and Model 2 discrimination performances were significantly inferior to those of Model 3 and Model 4 (all area under the curve comparisons: P < .001).
Figure 5:
Receiver operating characteristic curve analysis for the prediction of death during hospitalization. After performing area under the curve comparison with the DeLong method, discrimination performances of Model 1 (clinical variables, area under the curve 0.80, 95% confidence interval 0.75–0.84, P < .001) did not significantly differ from those of Model 2 (muscle status, area under the curve 0.79, 95% confidence interval 0.75–0.83, P < .001; area under the curve comparison for Model 1 against Model 2: P = .599), nor did the ones of Model 3 (muscle status and chest CT features, area under the curve 0.86, 95% confidence interval 0.83–0.90, P < .001) and of Model 4 (clinical variables, muscle status, and chest CT features, area under the curve 0.87, 95% confidence interval 0.84–0.91, P < .001; area under the curve comparison against Model 3: P = .282). However, as depicted, both Model 1 and Model 2 discrimination performances were significantly inferior to those of Model 3 and Model 4 (all area under the curve comparisons: P < .001).

References

    1. Verity R, Okell LC, Dorigatti I, et al. Estimates of the severity of coronavirus disease 2019: a model-based analysis. Lancet Infect Dis 2020;669–677. doi: 10.1016/S1473-3099(20)30243-7 - PMC - PubMed
    1. Guo T, Shen Q, Guo W, et al. Clinical Characteristics of Elderly Patients with COVID-19 in Hunan Province, China: A Multicenter, Retrospective Study. Gerontology 2020;467–475. doi: 10.1159/000508734 - PubMed
    1. Calvani R, Marini F, Cesari M, et al. Biomarkers for physical frailty and sarcopenia: state of the science and future developments. J Cachexia Sarcopenia Muscle 2015;278–286. doi: 10.1002/jcsm.12051 - PMC - PubMed
    1. Albano D, Messina C, Vitale J, Sconfienza LM. Imaging of sarcopenia: old evidence and new insights. Eur Radiol 2020;2199–2208. doi: 10.1007/s00330-019-06573-2 - PubMed
    1. Boutin RD, Katz JR, Chaudhari AJ, et al. Association of adipose tissue and skeletal muscle metrics with overall survival and postoperative complications in soft tissue sarcoma patients: an opportunistic study using computed tomography. Quant Imaging Med Surg 2020;1580–1589. doi: 10.21037/qims.2020.02.09 - PMC - PubMed

Publication types