. 2021 Dec;15(1):58-73.
doi: 10.1080/19336918.2021.1892397.

The Netrin-1-Neogenin-1 signaling axis controls neuroblastoma cell migration via integrin-β1 and focal adhesion kinase activation

Affiliations

The Netrin-1-Neogenin-1 signaling axis controls neuroblastoma cell migration via integrin-β1 and focal adhesion kinase activation

Andrea A Villanueva et al. Cell Adh Migr. 2021 Dec.

Abstract

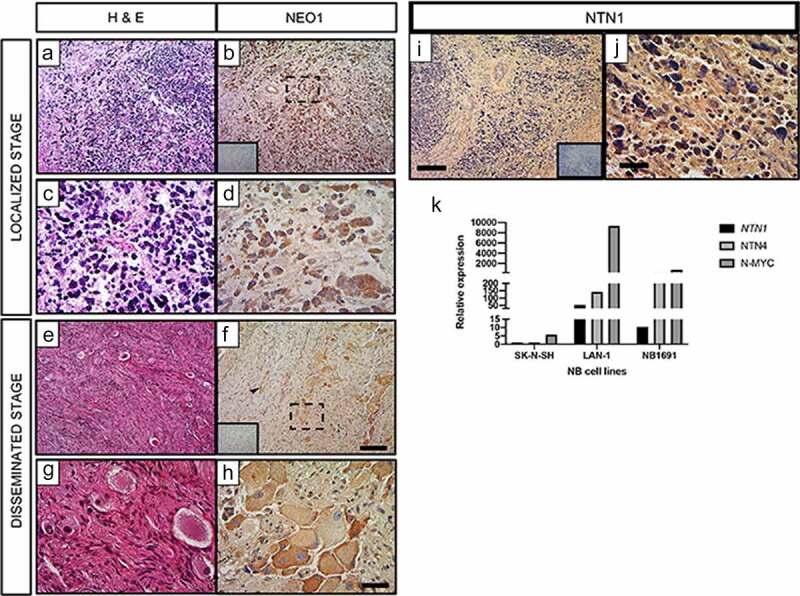
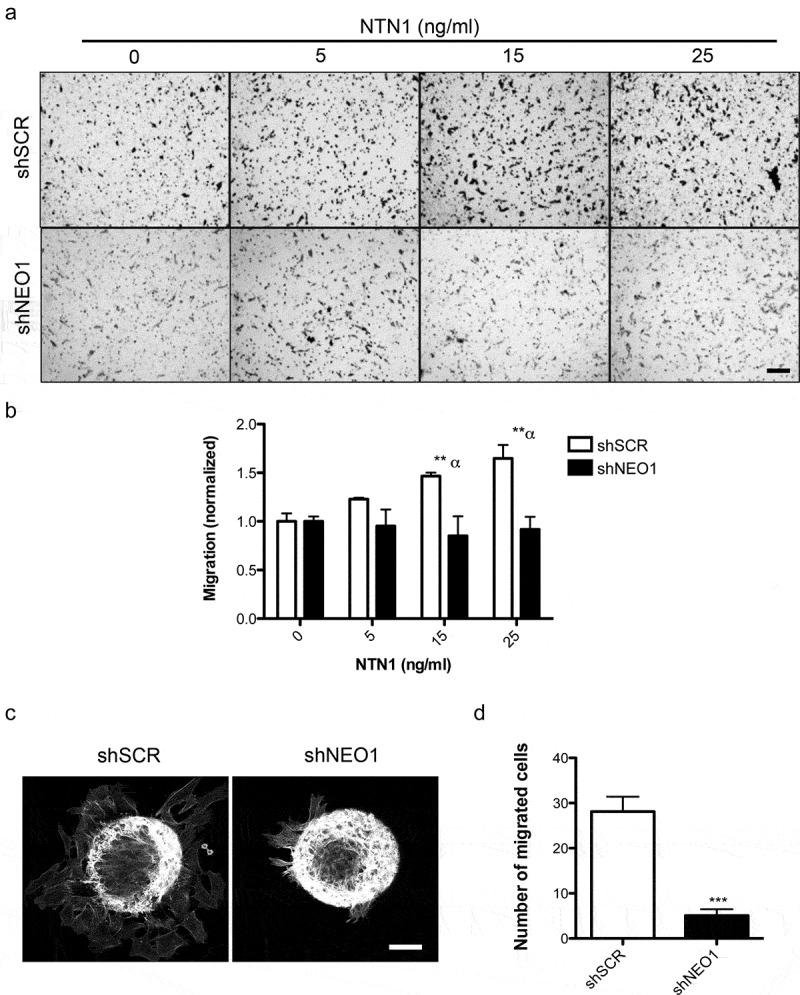
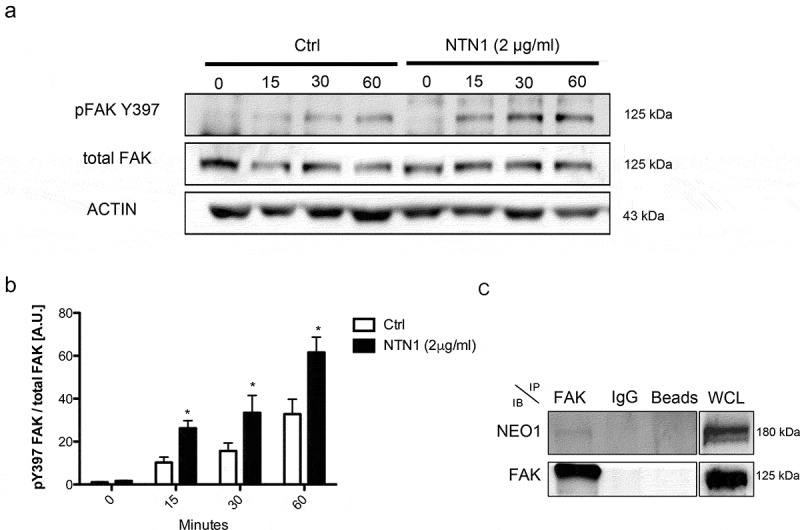
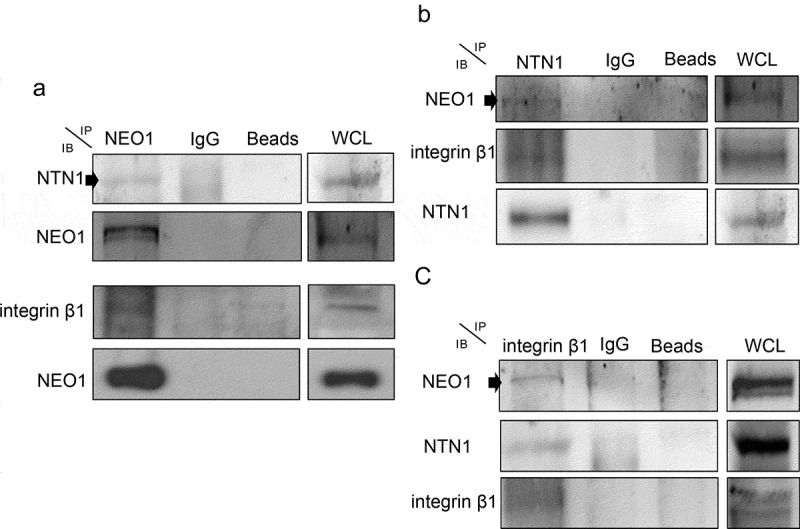
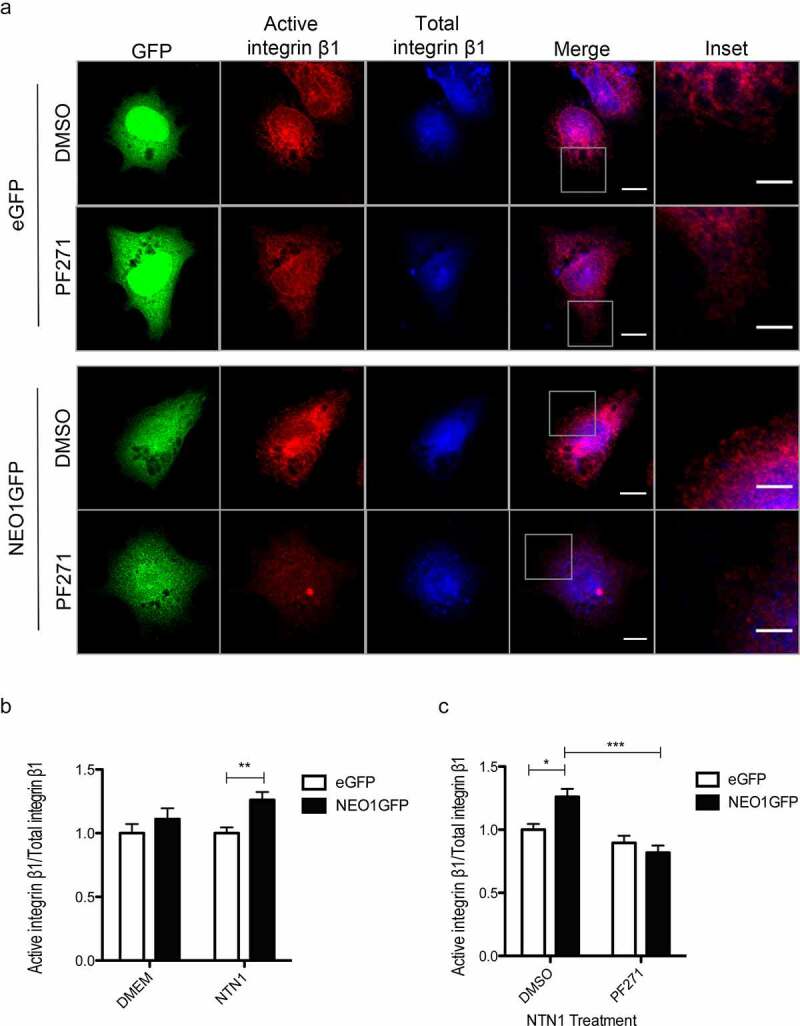
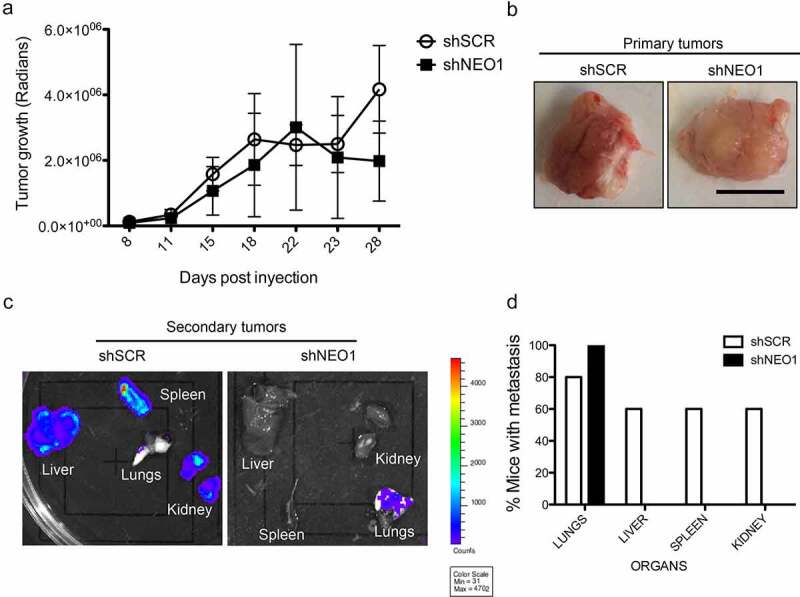
Neuroblastoma is a highly metastatic tumor that emerges from neural crest cell progenitors. Focal Adhesion Kinase (FAK) is a regulator of cell migration that binds to the receptor Neogenin-1 and is upregulated in neuroblastoma. Here, we show that Netrin-1 ligand binding to Neogenin-1 leads to FAK autophosphorylation and integrin β1 activation in a FAK dependent manner, thus promoting neuroblastoma cell migration. Moreover, Neogenin-1, which was detected in all tumor stages and was required for neuroblastoma cell migration, was found in a complex with integrin β1, FAK, and Netrin-1. Importantly, Neogenin-1 promoted neuroblastoma metastases in an immunodeficient mouse model. Taken together, these data show that Neogenin-1 is a metastasis-promoting protein that associates with FAK, activates integrin β1 and promotes neuroblastoma cell migration.

Keywords: FAK; cell migration; Neogenin-1; Netrin-1; integrin-β1 activation; metastasis; neuroblastoma.


Figures

Figure 1.
Figure 1.
NEO1 is expressed in NB samples independently of tumoral stage and NTN1 has impaired expression. Immunohistochemically (IHC) analysis of NEO1 expression in NB samples. In all IHC Hematoxylin was used as a counterstaining a- d: Representative images of a NB patient sample classified at Localized Stage according to INRGSS. a, c: Hematoxylin-Eosin (H&E) staining, b: NEO1 expression (brown). Dotted square shows the area represented at higher magnification in d. e- h: Representative images of a NB patient sample classified at Disseminated Stage according to INRGSS. e, g: H&E staining, f, h: NEO1 expression. Dotted square shows the area represented in high magnification in h. Negative control of the antibody are shown as inset in b and f. Arrowhead indicates NEO1 staining in blood vessels. a, b, e, f: Low magnification Bar: 100 μm, c, d, g, h: High magnification Bar: 20 μm. Immunohistochemistry of NTN1 expression within NB. Representative light microscopy images of neuroblastoma samples from primary tumors. Hematoxylin was used for counterstaining. i, j: Representative images of a NB patient sample classified at Localized Stage according to INRGSS. i: Low magnification, j: High magnification. Negative control of each antibody is shown as an inset. Low magnification Bar: 100 μm, High magnification Bar: 20 μm. k: Relative expression of NTN1, NTN4 and N-MYC in indicated NB cell lines. GAPDH expression was used as housekeeping control. N = 21
Figure 2.
Figure 2.
NEO1 promotes chemotactic NTN1-mediated cell migration. a: Representative transwell assay images performed with shSCR and shNEO1 SK-N-SH cells which migrated for 4 hours in increasing concentrations of NTN1 indicated in Figure. Bar = 100 µm. b: Quantification of the photographs taken for each condition. Values are expressed as induction times of migration relative to the condition without chemotactic stimulus (0 ng/ml NTN1) for shSCR and shNeo1 cells. N = 3, n = 5 fields per condition were counted, * p < 0.05 0 v/s 25 ng/ml NTN1. c: Representative images of confocal microscopy of spheroid-based migration assay on fibronectin for 1 h, comparing shSCR versus NEO1 knock-down cells. The images reveal F-actin labeling. d: Quantification of cells that migrated away from the spheroid for each condition tested. N = 3, n = 15. *** p < 0.01 shSCR versus shNEO1
Figure 3.
Figure 3.
NTN1 induces FAK phosphorylation and NEO1 binds it. a: WB of pFAK Y397 and FAK total in cells spreaded onto PBS buffer (Control) and NTN1 (2 μg/ml) at different time periods. Actin was used as an internal control. b: Quantification of WB indicated in a. The ratio between pFAK Y397 versus FAK total was calculated. N = 3, n = 3. c: WB of protein co-immunoprecipitation; FAK was immunoprecipitated and NEO1 was evaluated. WCL: whole cell lysate. N = 3, n = 2
Figure 4.
Figure 4.
NEO1/NTN1 form a complex with integrin β1 in SK-N-SH cells. a: Representative western blots (WB) of protein co-immunoprecipitation assays used to evaluate interaction between NEO1 with NTN1 and integrin β1. b: Representative WB of protein co-immunoprecipitation assays used to evaluate interaction between NTN1 with NEO1 and integrin β1, c: Representative WB of protein co-immunoprecipitation assays used to evaluate interaction between integrin β1 with NTN1 and NEO1. N = 2. WCL: whole cell lysate. N = 2, n = 3
Figure 5.
Figure 5.
The NEO1/NTN1 complex induces integrin β1 activation via pFAK. a: Representative confocal microscopy images of a spreading assay in NEO1 overexpressing SK-N-SH cells (NEO1GFP) versus control eGFP cells in presence of PF271 or vehicle control (DMSO). Immunofluorescence was made using activate integrin β1 (red) and total integrin β1 (blue) antibodies along with transgenic expression of eGFP (green) evaluation. The photos were taken at 400x and the inserts correspond to areas used for quantification Bar: 10 μm. b, c: Quantification of fluorescence intensity between the different conditions for active integrin β1 in relation to total integrin β1 in GFP + cells. Quantification considered the cell edge (2–3 μm) labeled by the F-actin marker. Quantification of the activation of integrin β1 according to NTN1 stimulation (b) and PF271 treatment in NTN1 treated cells (c). N = 3, * p < 0.05. n ≥ 30 cells per condition
Figure 6.
Figure 6.
NEO1 promotes metastasis in vivo. Stable luminescent shSCR (Control) and shNEO1 cells were injected in flank of NSG mice (n = 5 for each group). After 5 weeks, primary tumor and several organs were extracted and analyzed using IVIS Ilumina III in vivo imaging system. a: Tumor growth of shSCR and shNEO1 primary tumors (n = 10 for each group). b: Representative images of primary tumor for each condition. Bar: 1 cm. c: Representative images of organs visualized in IVIS. d: Graphic representation of metastasis results. Five specimens per injected cell type were analyzed. Presence or absence of metastasis in each organ was scored. Percentages of metastasis were indicated for each cell type in each organ. N = 5, n = 2

References

    1. Cheung N, Dyer M.. Neuroblastoma: developmental biology, cancer genomics and immunotherapy. Nat Rev Cancer. 2013;13(6):397–411. - PMC - PubMed
    1. Reymond N, d’Água BB, Ridley AJ. Crossing the endothelial barrier during metastasis. Nat Rev Cancer. 2013;13(12):858–870. - PubMed
    1. Maziveyi M, Suresh KA. Cell matrix adhesions in cancer: the proteins that form the glue. Oncotarget. 2017;8(no. 29):48471. - PMC - PubMed
    1. Zent R, Pozzi A, editors. Chapter: Cell-extracellular matrix interactions in cancer. New York: Springer; 2010. p. 1–17
    1. Schaller MD. Cellular functions of FAK kinases: insight into molecular mechanisms and novel functions. J Cell Sci. 2010;123(Pt 7):1007–1013. - PubMed

Publication types