. 2021 Mar 16:10:e65228.
doi: 10.7554/eLife.65228.

Egr2 induction in spiny projection neurons of the ventrolateral striatum contributes to cocaine place preference in mice

Affiliations

Egr2 induction in spiny projection neurons of the ventrolateral striatum contributes to cocaine place preference in mice

Diptendu Mukherjee et al. Elife. .

Abstract

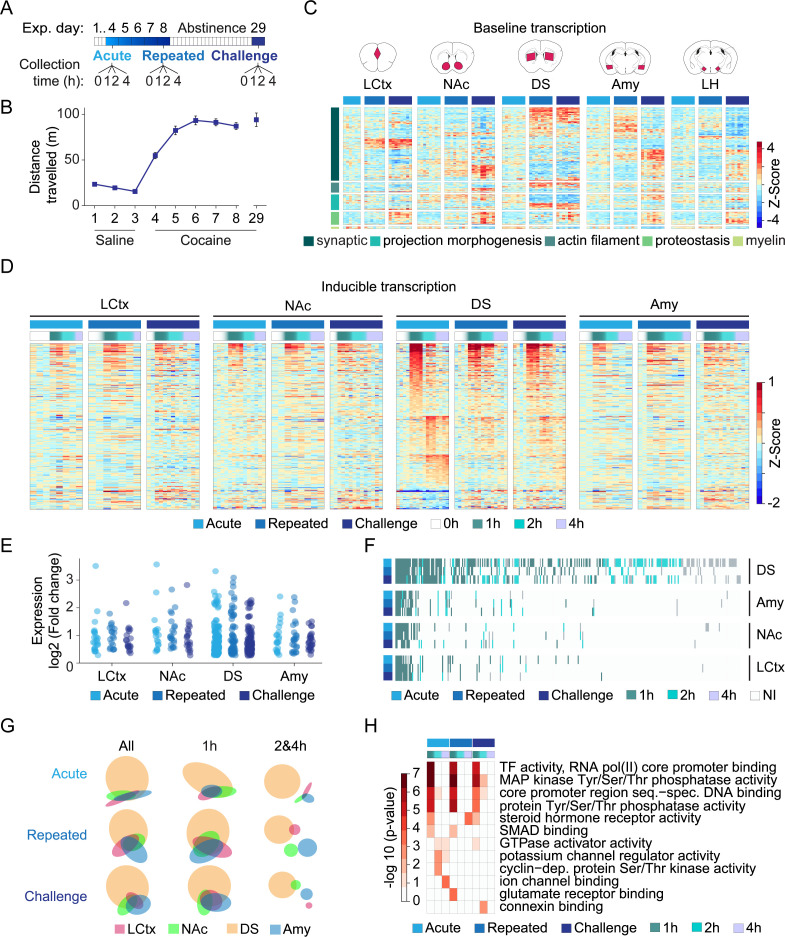
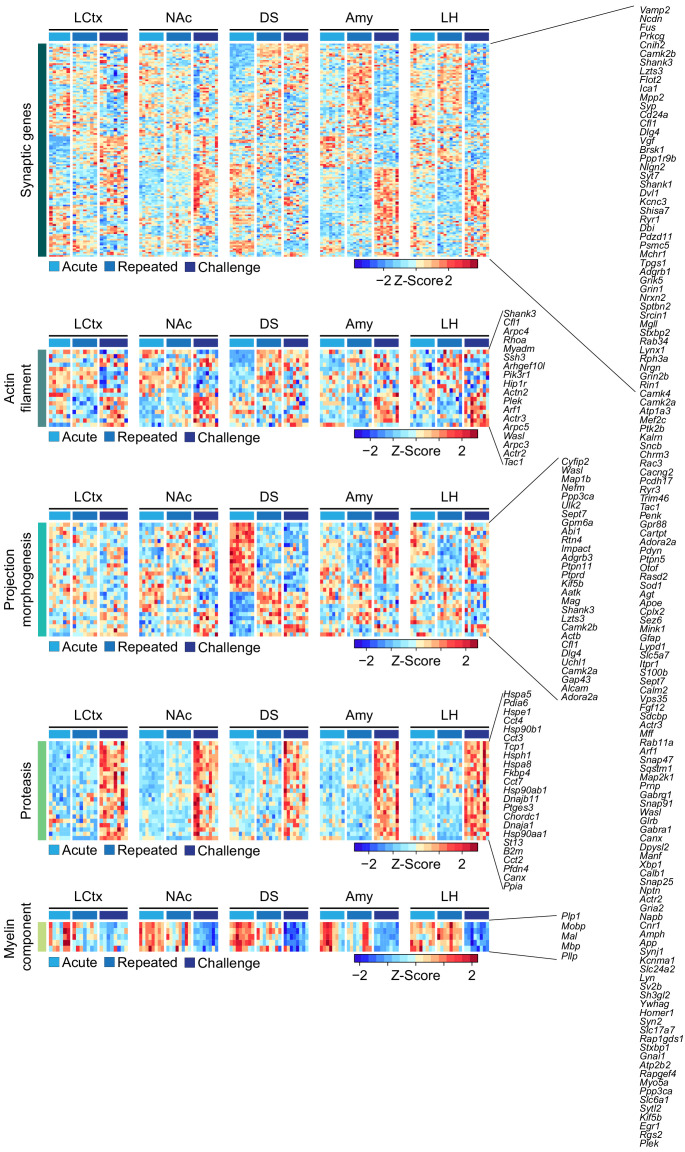
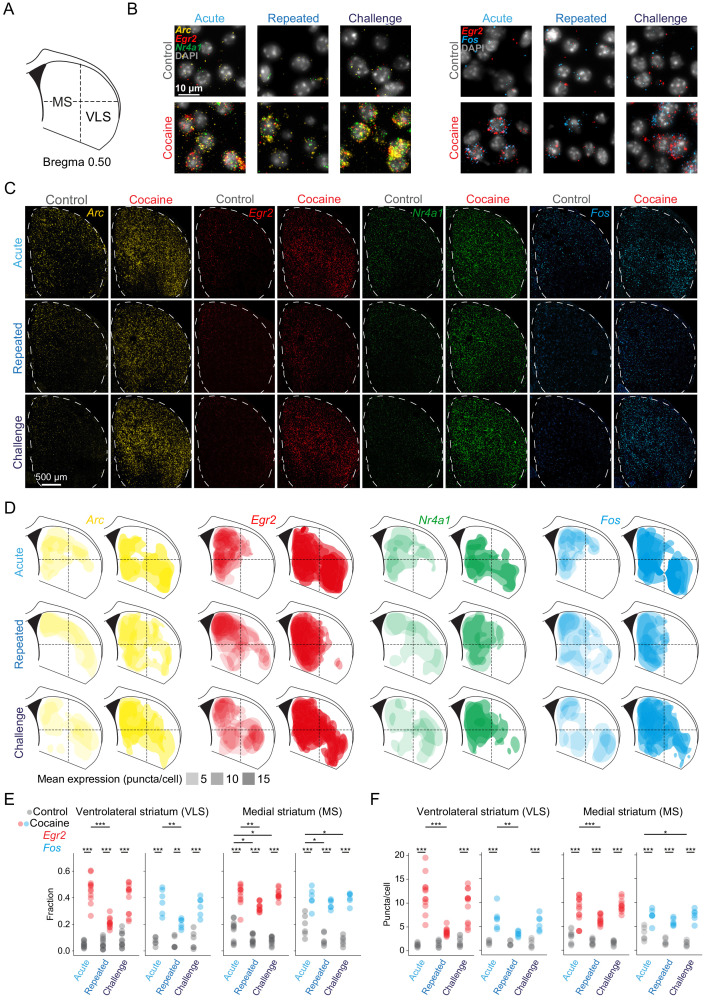
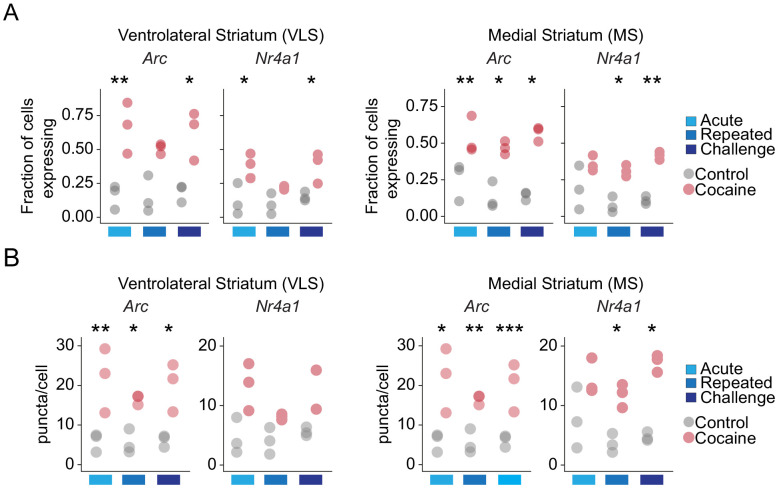
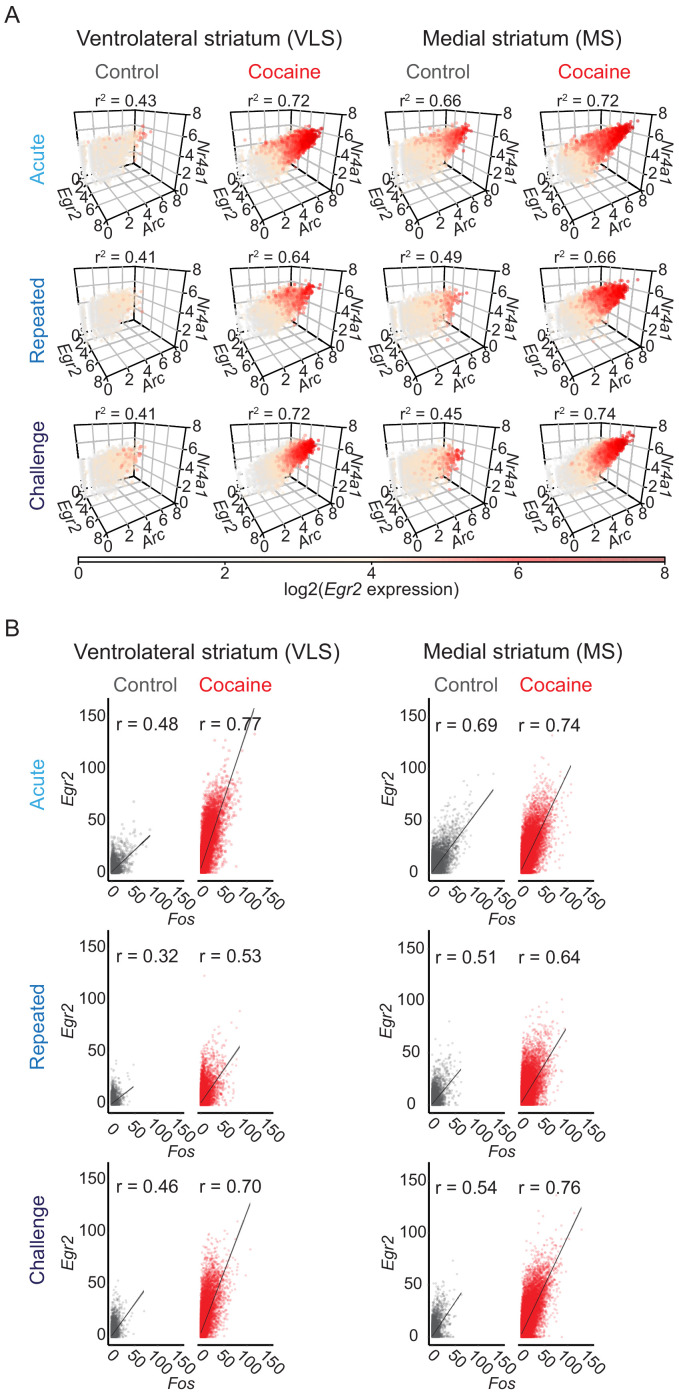
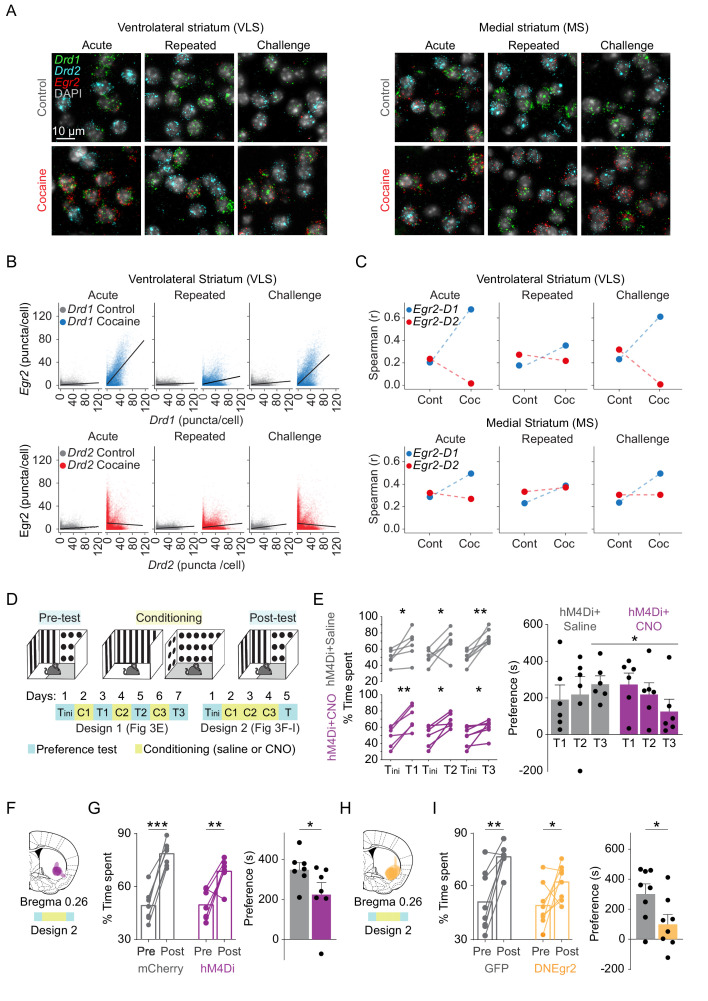
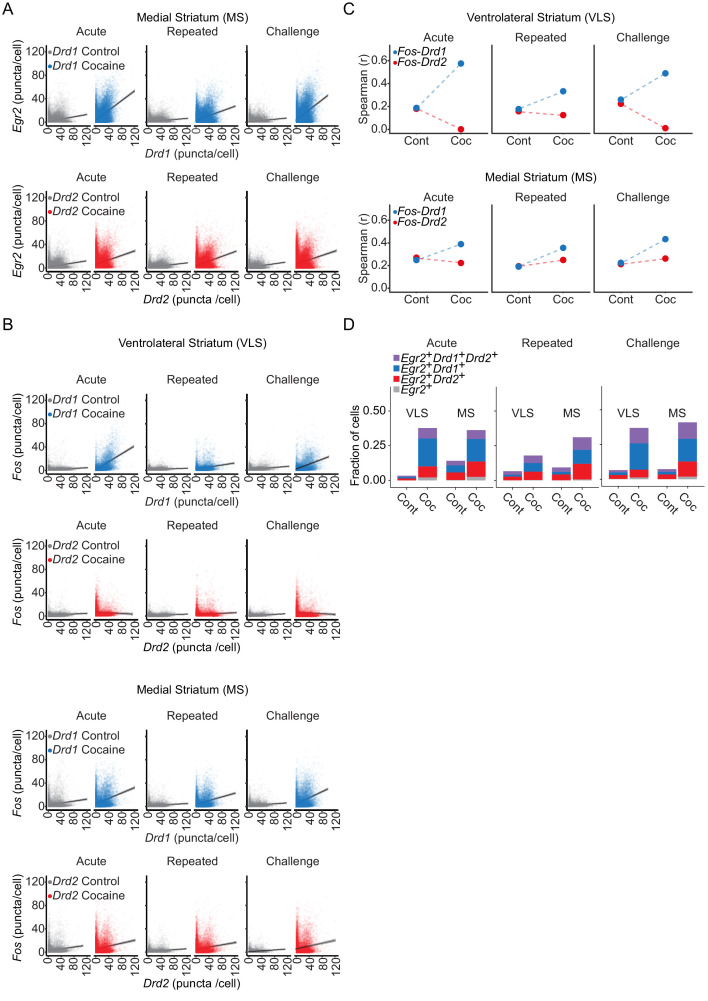
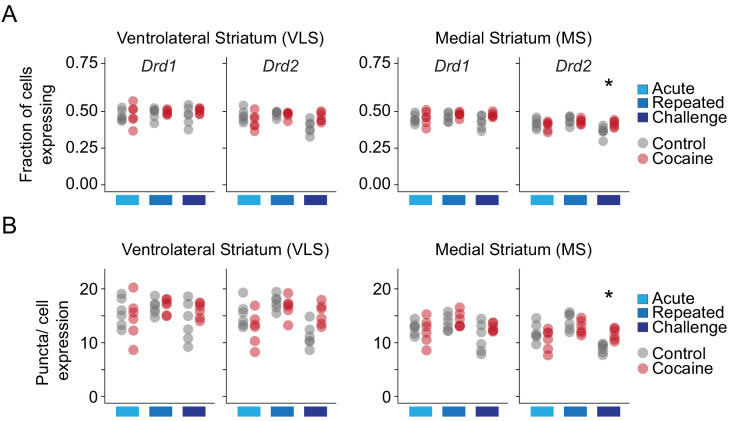
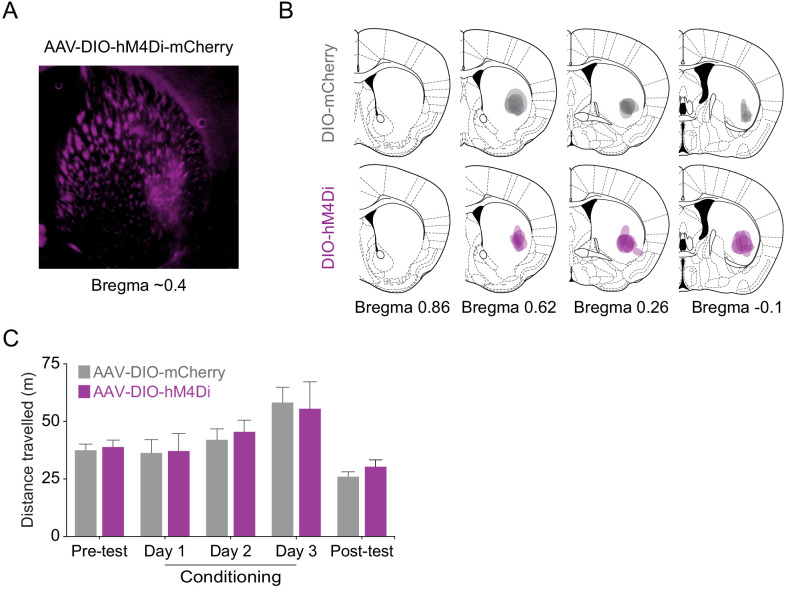
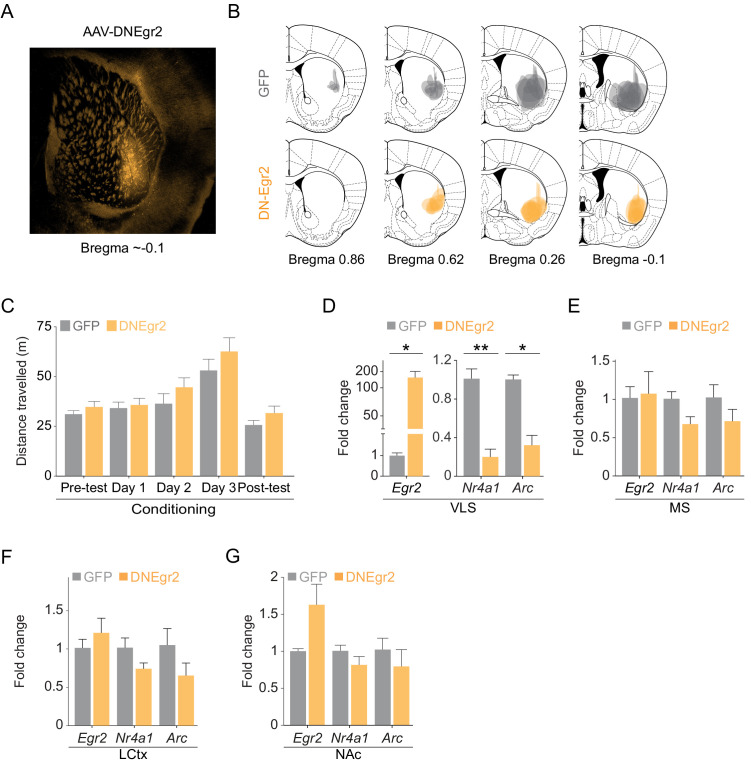
Drug addiction develops due to brain-wide plasticity within neuronal ensembles, mediated by dynamic gene expression. Though the most common approach to identify such ensembles relies on immediate early gene expression, little is known of how the activity of these genes is linked to modified behavior observed following repeated drug exposure. To address this gap, we present a broad-to-specific approach, beginning with a comprehensive investigation of brain-wide cocaine-driven gene expression, through the description of dynamic spatial patterns of gene induction in subregions of the striatum, and finally address functionality of region-specific gene induction in the development of cocaine preference. Our findings reveal differential cell-type specific dynamic transcriptional recruitment patterns within two subdomains of the dorsal striatum following repeated cocaine exposure. Furthermore, we demonstrate that induction of the IEG Egr2 in the ventrolateral striatum, as well as the cells within which it is expressed, are required for the development of cocaine seeking.

Keywords: IEG; cocaine; ensembles; mouse; neuroscience; reward; striatum; transcriptomics.

Plain language summary

The human brain is ever changing, constantly rewiring itself in response to new experiences, knowledge or information from the environment. Addictive drugs such as cocaine can hijack the genetic mechanisms responsible for this plasticity, creating dangerous, obsessive drug-seeking and consuming behaviors. Cocaine-induced plasticity is difficult to apprehend, however, as brain regions or even cell populations can react differently to the compound. For instance, sub-regions in the striatum – the brain area that responds to rewards and helps to plan movement – show distinct responses during progressive exposure to cocaine. And while researchers know that the drug immediately changes how neurons switch certain genes on and off, it is still unclear how these genetic modifications later affect behavior. Mukherjee, Gonzales et al. explored these questions at different scales, first focusing on how progressive cocaine exposure changed the way various gene programs were activated across the entire brain. This revealed that programs in the striatum were the most affected by the drug. Examining this region more closely showed that cocaine switches on genes in specific ‘spiny projection’ neuron populations, depending on where these cells are located and the drug history of the mouse. Finally, Mukherjee, Gonzales et al. used genetically modified mice to piece together cocaine exposure, genetic changes and modifications in behavior. These experiments revealed that the drive to seek cocaine depended on activation of the Egr2 gene in populations of spiny projection neurons in a specific sub-region of the striatum. The gene, which codes for a protein that regulates how genes are switched on and off, was itself strongly activated by cocaine intake. Cocaine addiction can have devastating consequences for individuals. Grasping how this drug alters the brain could pave the way for new treatments, while also providing information on the basic mechanisms underlying brain plasticity.


Conflict of interest statement

DM, BG, RA, HT, MG, AC No competing interests declared

Figures

Figure 1.
Figure 1.. Transcriptional profiling resolves the dynamics of cocaine-induced gene expression within major nodes of the reward circuitry.
(A) Scheme describing the cocaine sensitization paradigm and time points (0, 1, 2, 4 hr) at which samples were obtained for analysis of gene expression following acute (0 = cocaine naïve); repeated (fifth exposure to cocaine; 0 = 24 hr following fourth exposure); and challenge exposures (acute exposure following 21 days of abstinence from repeated exposure; 0 = abstinent mice). (B) Locomotor sensitization to cocaine (20 mg/kg i.p.; days 1–3 n = 58; days 4 n = 51; day 8 n = 30; day 29 n = 15) of mice included in this study. (C) Baseline shifts in expression of genes associated with categories of neuroplasticity following repeated cocaine exposure and abstinence (see Figure 1—figure supplements 1 and 2 for description of sectioned regions and RNA-seq QC). Heatmap depicting fold change of differentially expressed genes (normalized to cocaine naive samples and Z-scored per gene), with rows corresponding to individual genes, clustered according to annotation of biological function on Gene Ontology (p<0.05 FDR corrected). Columns correspond to individual mice – naïve (=azure); repeated (=blue); challenge (=navy) cocaine; n = 6–8 samples in each group across brain structures (LCtx = limbic cortex, NAc = nucleus accumbens, DS = dorsal striatum, Amy = amygdala and LH = lateral hypothalamus). Genes were selected from analysis of a subset of samples which were sequenced together (Figure 1—figure supplement 3A) and plotted here across all available samples (for gene identity, see Figure 1—figure supplement 4). (D) Heatmaps depicting expression of inducible genes. Data was normalized to 0 hr of relevant cocaine experience, log-transformed, and clustered by peak expression (selected by FC > 1.2 and FDR corrected p<0.05, linear model followed by LRT, see Materials and methods). Columns correspond to individual mice (0, 1, 2, 4 hr following acute, repeated vs challenge cocaine; see adjacent key for color coding) across LCtx, NAc, DS and Amy. n = 2–4 samples for individual time points of a cocaine experience within a brain nucleus. (E) Dot plots represent the peak induction magnitude of genes induced in the LCtx, NAc, DS, and Amy following acute, repeated, and challenge cocaine. (F) Heatmap addressing the conservation of gene identity and peak induction time. Induced genes are color coded by their time point of peak induction (NI = not induced). (G) Venn diagrams represent overlap of the genes induced in each brain nuclei following different cocaine experiences (all: 1 and 2 and 4 hr; early: 1 hr; late: 2 hr and 4 hr time points). (H) DEGs induced within the DS are enriched for GO terms associated with signaling and transcription at 1 hr, diversifying to regulators of cellular function and plasticity at later times. Heatmap represents significantly enriched GO terms (p < 0.05, Bonferoni corrected), graded according to p-value.
Figure 1—figure supplement 1.
Figure 1—figure supplement 1.. Boundaries of dissected brain structures.
Illustration of the brain tissue collected for RNA extraction and sequencing analysis. Red shaded boxes represent the area dissected from 400-micron coronal sections at specific rostral (+) or caudal (−) distances from Bregma (marked by the number). Left to right, brain regions include limbic cortex (medial prefrontal and cingulate cortex), nucleus accumbens, dorsal striatum, amygdala, and lateral hypothalamus.
Figure 1—figure supplement 2.
Figure 1—figure supplement 2.. Quality control analysis of RNA-seq experiments.
(A) Histograms of mean usable read depth of 3′-RNA-seq libraries. n = 194 libraries. (B) Principal component analysis (PCA) demonstrates clustering of RNA-seq libraries according to brain region, consistent with brain nuclei expressing distinct transcriptional profiles (Hawrylycz et al., 2012; Kang et al., 2011; Ortiz et al., 2020). Each dot represents individual libraries color coded by brain structure. n = 194 samples. (C) PCA of genes differentially expressed in the DS following acute, repeated, and challenge cocaine reveals clustering according to the time point of gene expression. Libraries of 1 hr time point are most distinct from the relevant control (0 hr) groups. Each dot represents a sample color coded according to its time point. n = 16 samples for each cocaine experience. These analyses indicate the robustness of transcriptional dynamics induced by cocaine and also provide an indication for the reproducibility of the experimental samples and the quality of the sequencing.
Figure 1—figure supplement 3.
Figure 1—figure supplement 3.. Repeated cocaine administration and abstinence induce baseline shifts in gene transcription.
(A) Gene expression profiles of repeated cocaine treated and abstinent mice within different brain regions. Heatmaps reflect log2 (fold change) of genes demonstrating differential expression between 0 hr of acute (cocaine naïve), repeated, and challenge cocaine in different brain regions. Columns represent individual samples sorted by the cocaine experience and brain nuclei. Expression is graded according to the color bar. Differentially expressed genes (DEGs) were assayed from samples that were included in the same sequencing run in order to avoid the introduction of batch effects. n = 2 samples in each condition. (FC >1.2; FDR corrected p<0.05 in at least one of the conditions, Wald test – see Materials and methods) (B) Dot plots demonstrate the magnitude and direction of DEG expression shifts in different brain nuclei. Each dot represents a DEG. LCtx: limbic cortex, NAc: nucleus accumbens, DS: dorsal striatum, Amy: amygdala, LH: lateral hypothalamus. (C) The number of genes that exhibit shift in their baseline expression following repeated cocaine and abstinence. Bar graphs color coded by brain structure depict the number of DEGs in each structure. (D) KEGG pathway annotation of gene clusters whose expression is modulated by repeated drug exposure and abstinence. Heat map showing enriched pathways consisting of at least 6 DEGs in different brain nuclei. Color represents p-value.
Figure 1—figure supplement 4.
Figure 1—figure supplement 4.. Repeated cocaine exposure and abstinence alters the expression of gene clusters related to neuroplasticity.
Heatmaps depict the expression levels of genes which are modulated between naïve mice and mice following repeated cocaine or abstinence in different brain regions clustered according to GO terms related to neuroplasticity (from Figure 1C). Columns represent individual mice. Expression is graded according to the color bar (Z-scored per gene). Cocaine experiences are color coded according to the key. LCtx = limbic cortex, NAc = nucleus accumbens, DS = dorsal striatum, Amy = amygdala, LH = lateral hypothalamus.
Figure 2.
Figure 2.. Dynamic IEG induction in subregions of the striatum accompany the development of cocaine sensitization.
(A) Scheme of a coronal section of the dorsal striatum (DS) (+0.52 ± 0.1 mm from Bregma) corresponding to the region assayed by multicolor smFISH for cocaine-induced IEG expression. (B) Representative images of multicolor smFISH analysis of Arc, Egr2, Nr4a1, and Fos expression following acute, repeated and challenge cocaine exposures (40× magnification). (C) Spatial IEG expression patterns in the DS. Representative images of multicolor smFISH analysis of Arc, Egr2, Nr4a1, and Fos expression. (D) Cocaine experiences induce distinct spatial patterns of IEG expression. Two-dimensional kernel density estimation was used to demarcate the regions with maximal density of high expressing cells for each IEG. Color code for probes: Arc – yellow, Egr2 – red, Nr4a1 – green, Fos – blue. The opacity of the demarcated areas corresponds to the mean puncta/cell expression. (E, F) Dot plots depicting the proportion of cells suprathreshold for Egr2+ and Fos+ (fraction; E), as well as cellular expression (puncta/cell; F) of Egr2+ and Fos+ in the ventrolateral (VLS) and medial (MS) striatum following acute, repeated, and challenge cocaine. *p<0.05, **p<0.005, ***p<0.0001, two-way ANOVA with post hoc Tukey’s test. Refer to Supplementary file 7 for cell numbers. See Figure 2—figure supplement 1 for corresponding analysis of Arc and Nr4a1. See Figure 2—figure supplement 2 for correlation in expression of Egr2, Arc, and Nr4a1, as well as Egr2 and Fos. Images relating to acute cocaine (in B, C, and D) were replicated from Gonzales et al., 2020, with permission.
Figure 2—figure supplement 1.
Figure 2—figure supplement 1.. Cocaine dynamically modulates cellular IEG expression in the VLS and MS.
(A) Dot plot of the fraction of cells positive for expression of Arc and Nr4a1 in the VLS and MS (threshold: Arc = 11, Nr4a1 = 12 puncta/cell) following acute, repeated, and challenge cocaine exposures. n = 3 sections from three mice (8823–12,246 cells). ANOVA with post hoc Tukey; *p<0.05, **p<0.005. (B) Dot plot of the puncta/cell for Arc and Nr4a1 following acute, repeated, and challenge cocaine exposures. n = 3 sections from three mice (8823–12,246 cells). ANOVA with post hoc Tukey; *p<0.05, **p<0.005, ***p<0.005.
Figure 2—figure supplement 2.
Figure 2—figure supplement 2.. Coherence of cocaine-induced IEG expression.
(A) Arc, Egr2, and Nr4a1 are coherently induced in cells of the VLS and MS. Coherence refers to the correlated co-expression of multiple IEGs within individual cells. Each dot depicts the expression [log2 (puncta per cell + 1)] of Arc, Egr2, and Nr4a1 within a single cell. The plots are color coded by Egr2 expression according to the color bar. Data summarized from n = 3 animals in each condition. Analysis using a linear model with Egr2 expression as the dependent variable and Arc and Nr4a1 expression as the independent variables demonstrated significant correlation between the genes (p<0.0001 for all conditions; 6850–16,952 cells). (B) Egr2 and Fos expression are strongly and positively correlated in the VLS and MS. Individual dots depict pairwise correlations of Egr2 and Fos within single cells. n = 6 sections from three mice in each condition (Pearson correlation, p<0.0001 for all conditions; 17,734–33,195 cells).
Figure 3.
Figure 3.. Induction of Egr2 in VLS neurons contributes to the acquisition of cocaine reward.
(A) Representative 40× images showing Egr2 expression within Drd1+ and Drd2+ SPNs in the VLS (left) and MS (right) following acute, repeated, and challenge cocaine exposures compared to controls. (B, C) The Drd1+ enriched IEG response in the VLS is dampened following repeated exposure to cocaine. (B) Scatter plots show cellular Egr2 expression with Drd1 or Drd2 expression (puncta/cell) within individual cells. n = 6 sections from three mice for each condition (gray – 0 hr for either Drd1 or Drd2 combination, and blue or red – for Drd1 or Drd2 combination, respectively, 1 hr following cocaine experience). (Drd1-Egr2: acute control, slope = 0.028, r2 = 0.038; acute cocaine, slope = 0.65, r2 = 0.50; repeated control, slope = 0.019, r2 = 0.02; repeated cocaine, slope = 0.11, r2 = 0.1; challenge control, slope = 0.048, r2 = 0.05; challenge cocaine, slope = 0.51, r2 = 0.4. Drd2-Egr2: acute control, slope = 0.029, r2 = 0.040; acute cocaine, slope = −0.036, r2 = 0.0017; repeated control, slope = 0.03, r2 = 0.069; repeated cocaine, slope = 0.06, r2 = 0.03; challenge control, slope = 0.07, r2 = 0.1; challenge cocaine, slope = −0.048, r2 = 0.004. Pearson correlation, p<0.0001 for all conditions; refer to Supplementary file 6 for detailed statistics). (C) Spearman correlation plots showing acute induction of Egr2 is correlated with Drd1 expression in the VLS, dampened following repeated exposure and re-emerges following challenge exposure. In the MS, Egr2 expression is consistently correlated to both Drd1 and Drd2 expression following acute, repeated, and challenge exposures. Refer to Figure 3—figure supplement 1 for additional correlations and Figure 3—figure supplement 2 for reference to Drd1 and Drd2 expression levels throughout the study. (D) Scheme of experimental paradigms for testing conditioned-place preference (CPP) for cocaine. Mice were tested (cyan) for initial preference (‘Tini’) followed by either three interleaved pairs of conditioning (yellow) – test days (‘Design 1’, relevant for panel E) – or three consecutive conditioning days and then a final preference test (‘Design 2’, relevant for F–I). (E) Chemogenetic inhibition of VLS-Egr2 expressing neurons impairs cocaine CPP. Egr2-CRE animals were transduced with AAV-DIO-hM4Di-mCherry and, following 3 weeks of recovery, subjected to a paradigm of cocaine CPP in which the preference of mice was tested repeatedly following individual training days (‘Design 1’; conditioning – days 2, 4, 6; tests – days 1, 3, 4, 7). The control group of mice was exposed to saline while experimental mice received CNO (5 mg/kg) 30 min prior to cocaine conditioning. Left – Line graphs representing % time spent on the cocaine paired side in individual preference test session (T1, T2, T3) compared to the initial preference (initial preference test; Tini). n = 6 mice in each group. *p<0.05, **p<0.01, ***p<0.005; paired t-test. Right – Bar graphs displaying the mean preference score (time spent on the drug paired side for relevant test session – initial test day). Significant difference in preference score is observed after three rounds of conditioning with cocaine n = 6 mice in each group. *p<0.05, **p<0.01, ***p<0.005; paired t-test. Data represented as mean ± sem. (F) Summary of expression domains of AAV-DIO-h4MDi in Egr2-CRE mice. (G) Chemogenetic inhibition of VLS-Egr2 expressing neurons during conditioning attenuates the development of cocaine CPP. Egr2-CRE animals were stereotactically transduced with AAV-DIO-mCherry (VLS-Egr2mCherry) or AAV-DIO-hM4Di-mCherry (VLS-Egr2hM4Di), and following recovery, all mice were subjected to cocaine CPP conditioning 30 min following exposure to CNO (10 mg/kg). Left panel represents change in % time spent on the cocaine paired side before and after conditioning for individual animals and the mean (paired t-test), while right panel (bar graphs) displays the mean preference score (time spent on the drug paired side of the final – first test day; unpaired t-test). Both groups developed CPP (paired t-test), while VLS-Egr2hM4Di mice displayed a lower preference score compared to VLS-Egr2mCherry controls (unpaired t-test). n = 7 mice in each group. *p<0.05, **p<0.01, ***p<0.005. For further documentation of expression domains and locomotion, see Figure 3—figure supplement 3. (H) Summary of expression domains of AAV-DN-Egr2. (I) Disruption of Egr2 function in the VLS inhibits the development of cocaine place preference. Left panel represents change in % time spent on the cocaine paired side before and after conditioning for individual animals and the mean, while bar graphs (right panel) display the mean preference score. Both groups developed CPP (paired t-test), while mice expressing AAV-DNEgr2 displayed a lower preference score compared to AAV-GFP controls (unpaired t-test). n = 8 mice in each group. *p<0.05, **p<0.01, ***p<0.005. For further documentation of expression domains, locomotion, and gene expression, see Figure 3—figure supplement 4. Images relating to acute cocaine (in A) were replicated from Gonzales et al., 2020, with permission.
Figure 3—figure supplement 1.
Figure 3—figure supplement 1.. Induced IEGs are correlated to Drd1 expression in the VLS and to both Drd1 and Drd2 expressions in the MS.
(A) Egr2 induction in the MS does not exhibit prominent cell-type bias and is modestly affected by the history of cocaine experience. Scatter plots show cellular Egr2 expression with Drd1 or Drd2 expression (puncta/cell) within individual cells. n = 6 sections from three mice for each condition (gray dots represent cells from 0 hr for either Drd1 or Drd2 combination, and blue or red dots for Drd1 or Drd2 combination, respectively, 1 hr following cocaine experience). Egr2-D1: acute control, slope = 0.09, r2 = 0.069; acute cocaine, slope = 0.41, r2 = 0.24; repeated control, slope = 0.04, r2 = 0.03; repeated cocaine, slope = 0.19, r2 = 0.1; hallenge control, slope = 0.05, r2 = 0.045; hallenge cocaine, slope = 0.42, r2 = 0.2. Egr2-D2: acute control, slope = 0.08, r2 = 0.05; acute cocaine, slope = 0.19, r2 = 0.052; repeated control, slope = 0.06, r2 = 0.09; repeated cocaine, slope = 0.19, r2 = 0.10; challenge control, slope = 0.07, r2 = 0.076; challenge cocaine, slope = 0.18, r2 = 0.046. Linear model, p<0.0001 for conditions, refer to Supplementary file 6 for detailed statistics. (B) Scatter plots of cellular expression (puncta/cell) of Fos with Drd1 or Drd2 in the VLS and MS. VLS-Fos induction following acute and challenge cocaine is biased to Drd1+ neurons. In the MS, irrespective of the cocaine experience, Fos induction is correlated with a similar degree with both Drd1+ and Drd2+. Each dot represents a cell color coded similar to (A). n = 6 sections from three mice for each condition. Fos-D1 in VLS: acute control, slope = 0.03, r2 = 0.02; acute cocaine, slope = 0.33, r2 = 0.32; repeated control, slope = 0.02, r2 = 0.03; repeated cocaine, slope = 0.09, r2 = 0.06; challenge control, slope = 0.05, r2 = 0.07; challenge cocaine, slope = 0.42, r2 = 0.2. Fos-D2 in the VLS: acute control, slope = 0.03, r2 = 0.02; acute cocaine, slope = −0.03, r2 = 0; repeated control, slope = 0.02, r2 = 0.02; repeated cocaine, slope = 0.02, r2 = 0; challenge control, slope = 0.03, r2 = 0.05; challenge cocaine, slope = −0.03, r2 = 0. Fos-D1 in the MS: acute control, slope = 0.09, r2 = 0.03; acute cocaine, slope = 0.23, r2 = 0.11; repeated control, slope = 0.03, r2 = 0.02; repeated cocaine, slope = 0.16, r2 = 0.08; challenge control, slope = 0.04, r2 = 0.03; challenge cocaine, slope = 0.26, r2 = 0.13. Fos-D2 in the MS: acute control, slope = 0.08, r2 = 0.03; acute cocaine, slope = 0.12, r2 = 0.03; repeated control, slope = 0.04, r2 = 0.04; repeated cocaine, slope = 0.09, r2 = 0.03; challenge control, slope = 0.04, r2 = 0.04; challenge cocaine, slope = 0.12, r2 = 0.03. Linear model, p<0.0001 for conditions, refer to Supplementary file 6 for detailed statistics. (C) Line graphs depicting spearman correlation show specific and dramatic improvement of Fos correlation with Drd1 and not Drd2 expression upon acute cocaine exposure in the VLS, dampened following repeated exposure and re-emerging upon cocaine challenge. In the MS, Fos expression is consistently correlated to both Drd1 and Drd2 expression irrespective of the cocaine experience, with a modest bias towards Drd1+ neurons. (D) Cumulative bar graphs illustrating the % of Drd1+/Drd2+/Drd1+Drd2+ neurons expressing Egr2+ at different time points during the development of behavioral sensitization to cocaine.
Figure 3—figure supplement 2.
Figure 3—figure supplement 2.. Drd1 and Drd2 receptor expression in the VLS and MS.
(A) Dot plots depicting the fraction of Drd1 vs Drd2 expressing cells in the VLS and MS in control (gray) and cocaine (red) conditions following distinct cocaine experiences. n = 6 sections from three mice in each condition. (B) Dot plots depicting puncta/cell expression of Drd1 and Drd2 following distinct cocaine experiences. Color code as in (A). n = 6 sections from three mice in each condition.
Figure 3—figure supplement 3.
Figure 3—figure supplement 3.. DREADD inhibition of VLS Egr2+ cells does not affect locomotion.
(A, B) Verification of AAV transduction in the VLS of transgenic Egr2-CRE mice tested in experiment depicted in Figure 3F-G. Example of AAV-DIO-hM4Di-mcherry infections in the VLS (A) and summary of AAV-DIO-mCherry and AAV-DIO-hM4Di-mcherry infections (B). Span of viral transduction in individual mice was manually overlaid on corresponding coronal sections from the mouse brain atlas. n = 7 mice in each group. (C) Expression of AAV-DIO-hM4Di does not affect locomotor behavior (p=0.93, ANOVA for interaction day with group, see Supplementary file 6 for stats). Bar graphs compare the locomotion of VLS-Egr2mCherry and VLS-Egr2hM4Di mice in the CPP chambers on pre-test, conditioning session with cocaine, and post-test days. CNO (10 mg/kg, i.p.) was administered to both groups 30 min prior to cocaine conditioning. n = 7 mice in each group. Data represented as mean ± sem.
Figure 3—figure supplement 4.
Figure 3—figure supplement 4.. Disruption of Egr2 function in the VLS does not affect locomotor behavior or IEG expression outside of VLS.
(A, B) Verification of AAV-GFP and AAV-DNEgr2 infection in the VLS. Example of AAV-DNEgr2 infection in the VLS (A). (B) Summary of infection from individual mice of VLSDNEgr2 and VLSGFP groups manually overlaid onto corresponding coronal sections from the mouse brain atlas. n = 8 mice in each group. (C) DN-Egr2 expression does not affect locomotor behavior (p=0.7, ANOVA for interaction day with group, see Supplementary file 6). Bar graphs compare the average locomotion of VLSGFP and VLSDNEgr2 mice in the CPP chambers on pretest, conditioning session with cocaine, and post-test days. n = 8 mice in each group. Data represented as mean ± sem. (D-G) Comparison of gene expression in mice injected with AAV-GFP (gray) or AAV-DN-Egr2 (orange) 24 hr after the final CPP test. (D, E) AAV-DN-Egr2 inhibits Nr4a1 and Arc expression in the VLS (D), but not in the MS (E). (F, G) Viral transduction of AAV-DNEgr2 in the VLS does not impact gene transcription in LCtx (F) and NAc (G). Bar graphs represent expression of Arc, Nr4a1, and Egr2 in LCtx and NAc of VLSGFP (gray) and VLSDNEgr2 (orange) mice. n = 3 mice in each group. Data represented as mean ± sem. *p<0.05, **p<0.005 unpaired t-test, n = 3 mice in each group.
Author response image 1.
Author response image 1.. Efficacy and efficiency of transduction of hM4Di infection of CLEgr2+ neurons.
(A) Representative traces of whole-cell current clamp recordings from CLEgr2+ neurons expressing the hM4Di DREADD, in the presence or absence of CNO (clozapine-N-oxide; 1 μM). 50-250 pA current injections (right) demonstrate the reduction of excitability in cells expressing hM4Di before(middle) and after (right) application of CNO. (B) Summary graph of the impact of CNO on the excitability of neurons expressing hM4Di.
Author response image 2.
Author response image 2.. hM4Di-CNO inhibits cocaine-induced Fos induction in Egr2+ claustral neurons.
The claustrum of Egr2-CRE mice was transduced with AAV viruses conditionally expressing hM4Di. 3 weeks later, following habituation to ip saline injections, mice were injected (i.p. 10mg/kg) with CNO, and 30 minutes later with cocaine (20mg/kg), sacrificed 1.5 hrs later. Sections were submitted to immunostaining for Fos (magenta). The representative overview image (left) and merged image (right) demonstrate the absence of co-localization of Fos staining in cells expressing the hM4Di DREADD.
Author response image 3.
Author response image 3.. hM4Di-CNO inhibits cocaine-induced Fos induction in VLS Drd1+-neurons.
The VLS of Drd1+-CRE mice was transduced with AAV viruses conditionally expressing hM4Di (red). Following habituation to ip saline injections, mice were injected with CNO (i.p. 10 mg/kg), and 30 minutes later with cocaine, sacrificed 1.5 hrs later. Sections were immunostained for Fos (green). A representative image from a mouse injected with saline before cocaine (left) demonstrates co-localization of green+red cells (white arrows), which are not observed in the representative image (right) from the mouse exposed to CNO prior to cocaine.

Similar articles

Cited by

References

    1. Alberini CM. Transcription factors in long-term memory and synaptic plasticity. Physiological Reviews. 2009;89:121–145. doi: 10.1152/physrev.00017.2008. - DOI - PMC - PubMed
    1. Alberini CM, Kandel ER. The regulation of transcription in memory consolidation. Cold Spring Harbor Perspectives in Biology. 2015;7:a021741. doi: 10.1101/cshperspect.a021741. - DOI - PMC - PubMed
    1. Albertson DN, Pruetz B, Schmidt CJ, Kuhn DM, Kapatos G, Bannon MJ. Gene expression profile of the nucleus accumbens of human cocaine abusers: evidence for dysregulation of myelin. Journal of Neurochemistry. 2004;88:1211–1219. doi: 10.1046/j.1471-4159.2003.02247.x. - DOI - PMC - PubMed
    1. Amit I, Citri A, Shay T, Lu Y, Katz M, Zhang F, Tarcic G, Siwak D, Lahad J, Jacob-Hirsch J, Amariglio N, Vaisman N, Segal E, Rechavi G, Alon U, Mills GB, Domany E, Yarden Y. A module of negative feedback regulators defines growth factor signaling. Nature Genetics. 2007;39:503–512. doi: 10.1038/ng1987. - DOI - PubMed
    1. Atlan G, Terem A, Peretz-Rivlin N, Sehrawat K, Gonzales BJ, Pozner G, Tasaka GI, Goll Y, Refaeli R, Zviran O, Lim BK, Groysman M, Goshen I, Mizrahi A, Nelken I, Citri A. The claustrum supports resilience to distraction. Current Biology. 2018;28:2752–2762. doi: 10.1016/j.cub.2018.06.068. - DOI - PMC - PubMed

Publication types

Associated data