. 2021 Mar 16:10:e66097.
doi: 10.7554/eLife.66097.

Architecture and structural dynamics of the heteromeric GluK2/K5 kainate receptor

Affiliations

Architecture and structural dynamics of the heteromeric GluK2/K5 kainate receptor

Nandish Khanra et al. Elife. .

Abstract

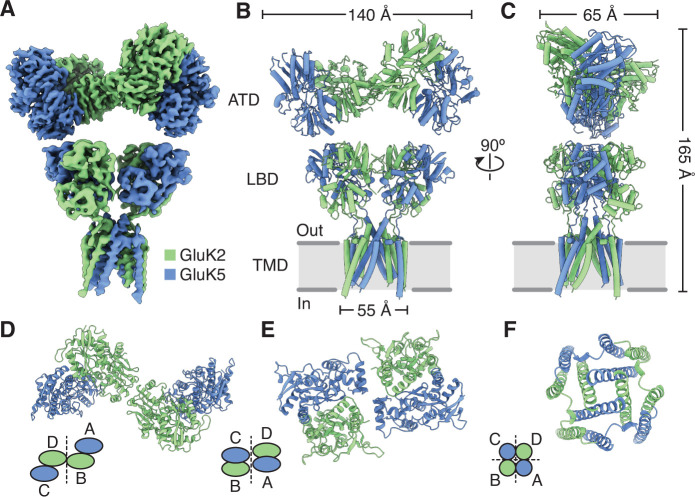
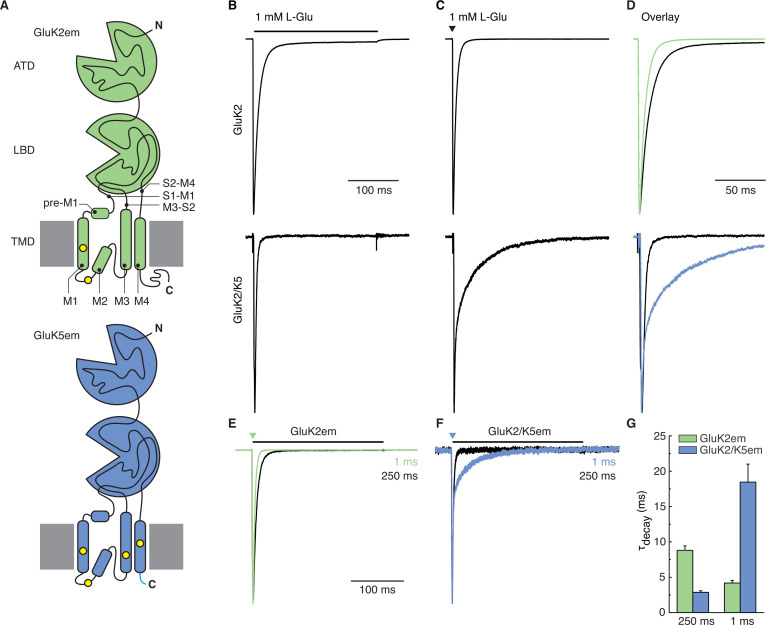
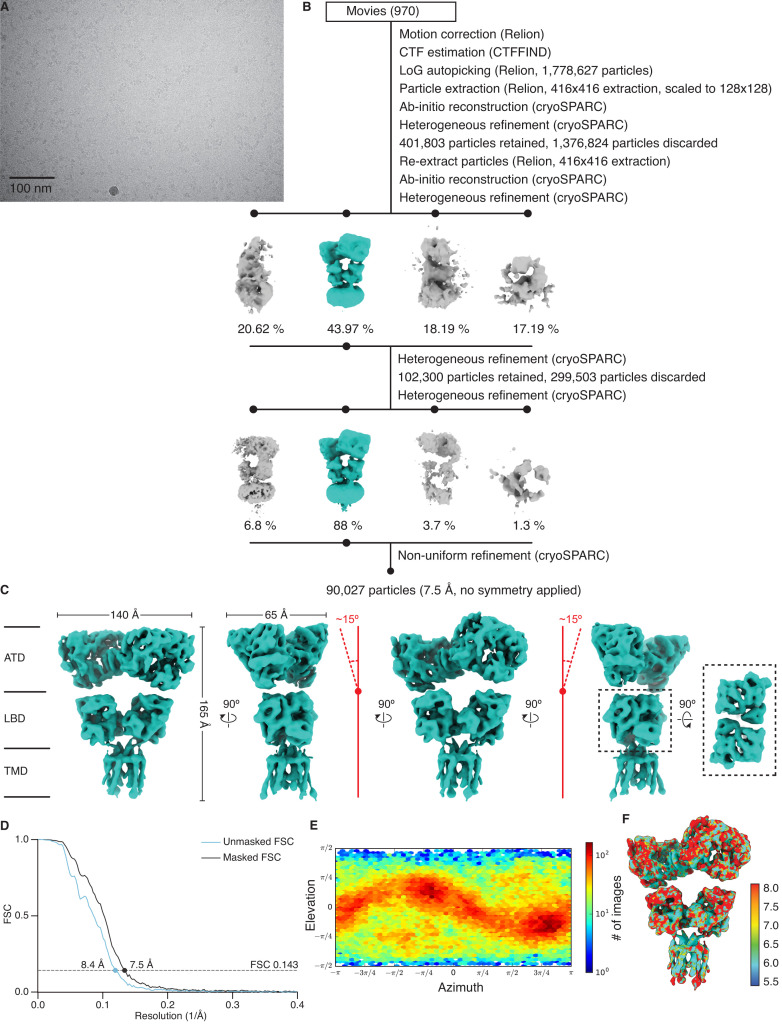
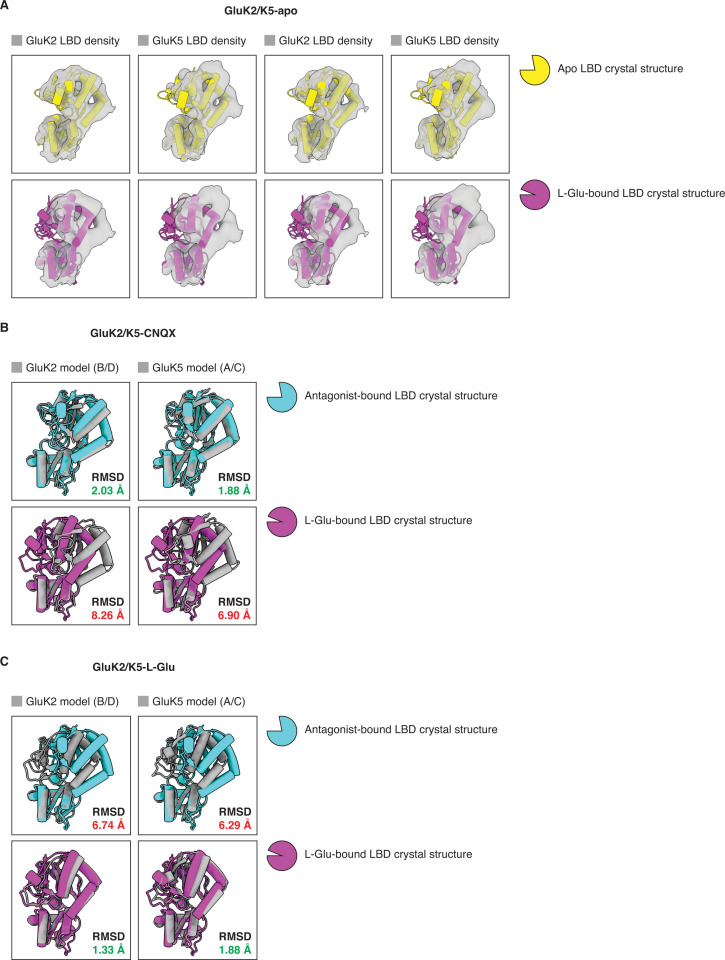
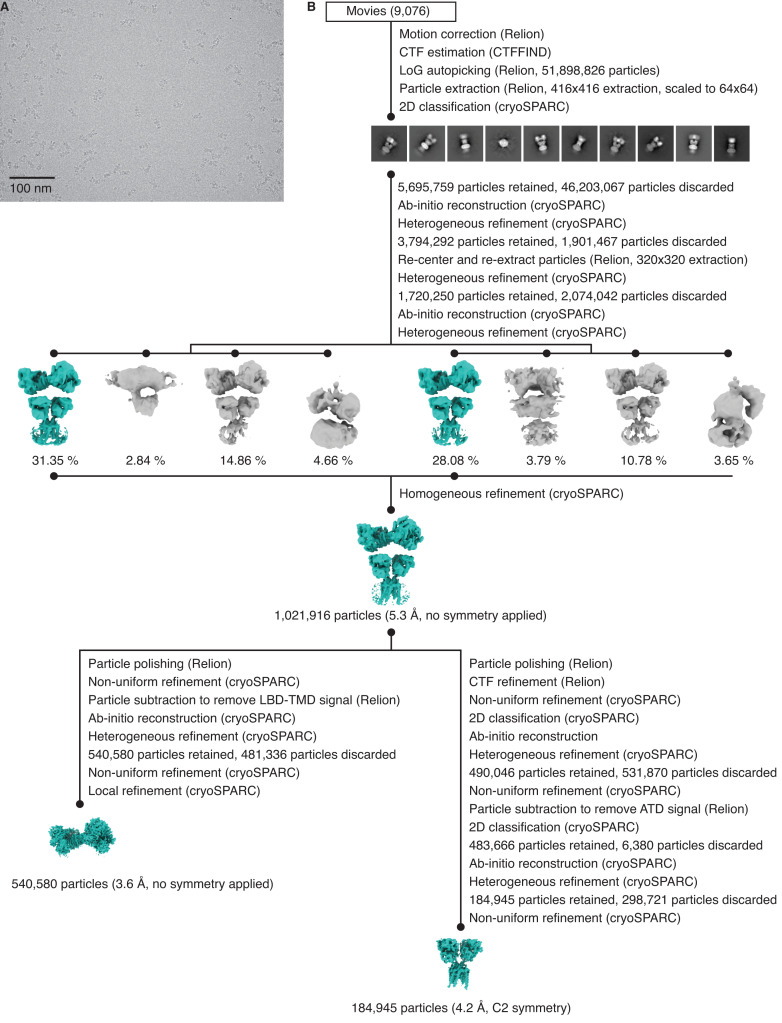
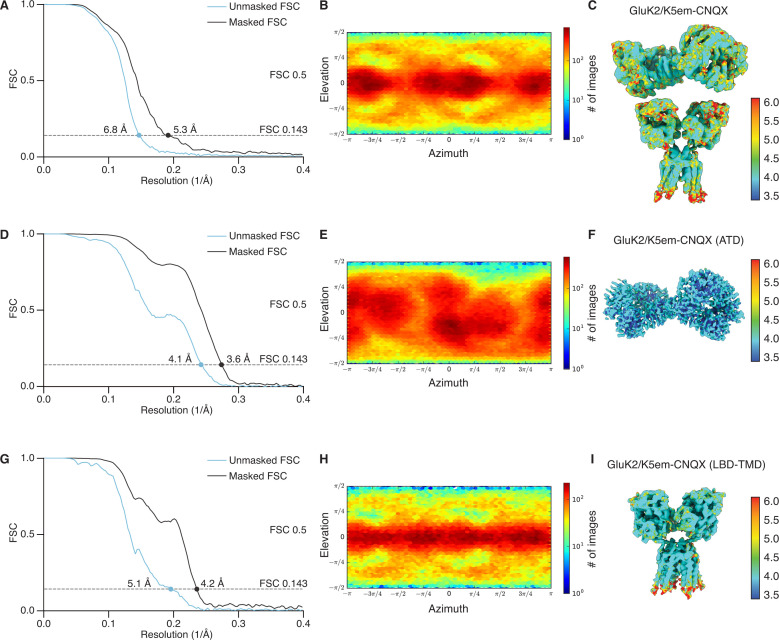
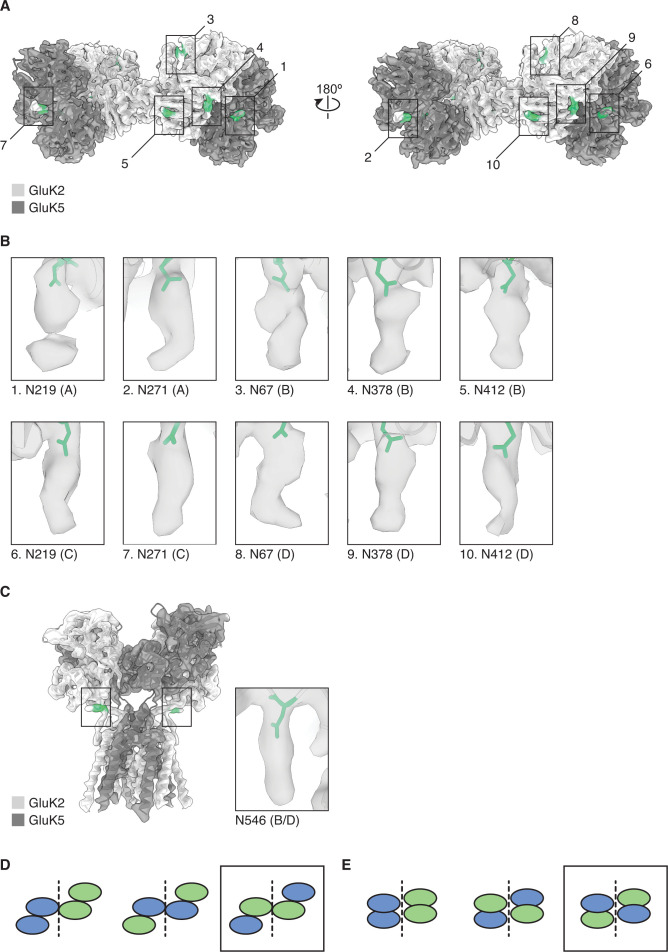
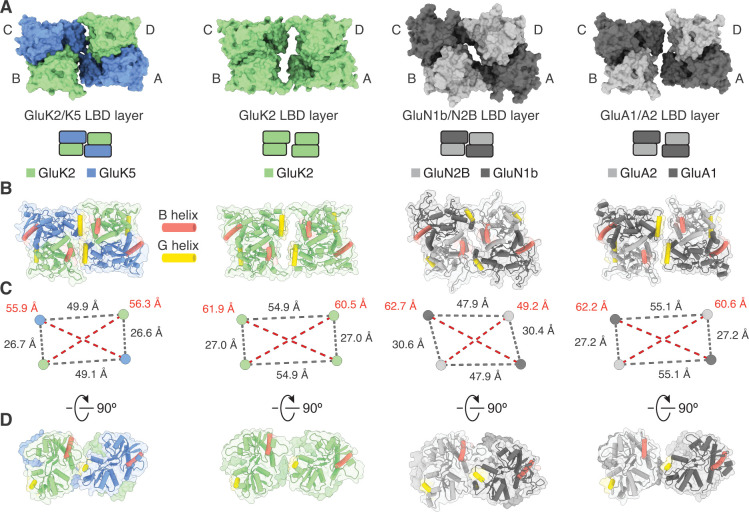
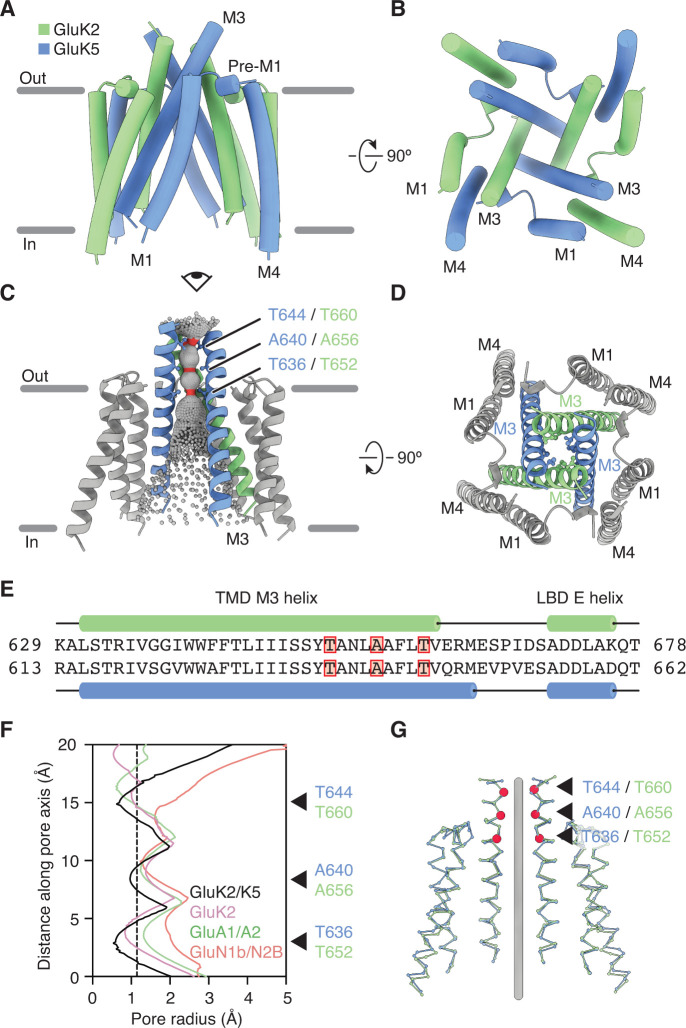
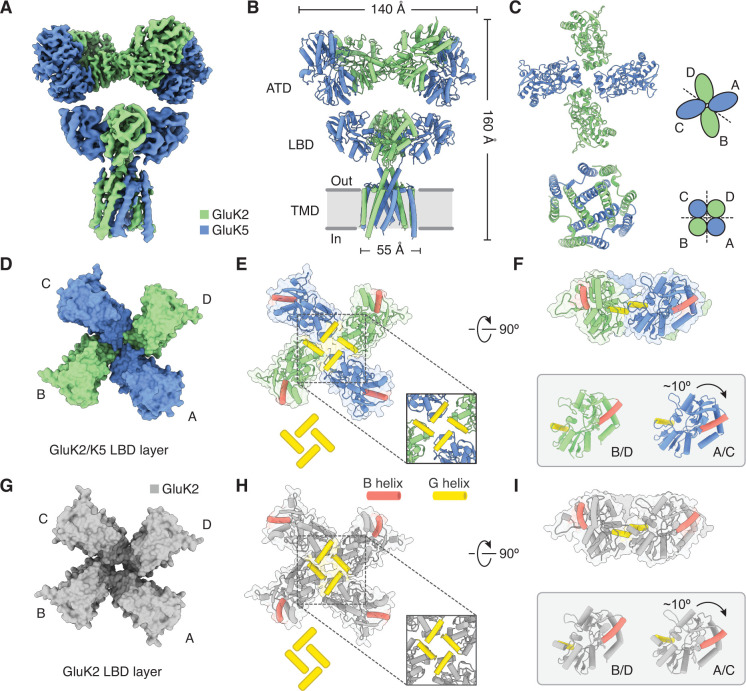
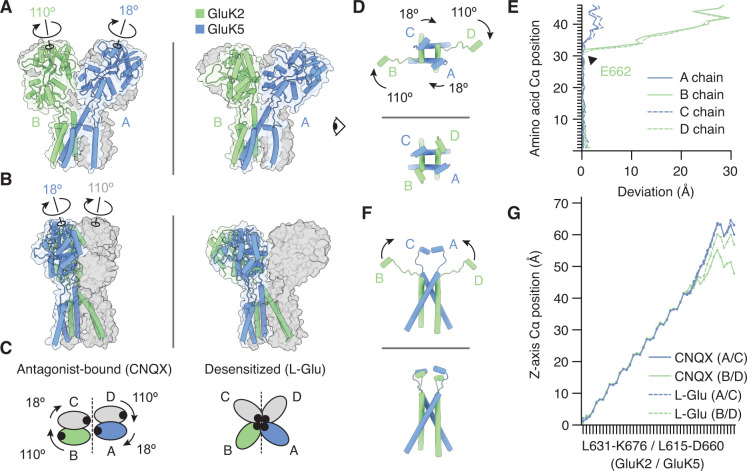
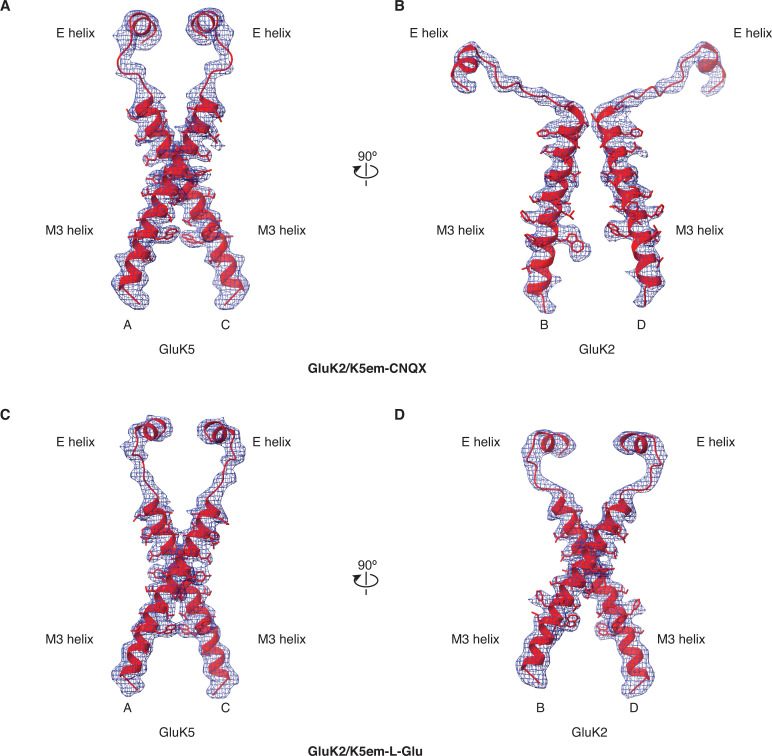
Kainate receptors (KARs) are L-glutamate-gated ion channels that regulate synaptic transmission and modulate neuronal circuits. KARs have strict assembly rules and primarily function as heteromeric receptors in the brain. A longstanding question is how KAR heteromer subunits organize and coordinate together to fulfill their signature physiological roles. Here we report structures of the GluK2/GluK5 heteromer in apo, antagonist-bound, and desensitized states. The receptor assembles with two copies of each subunit, ligand binding domains arranged as two heterodimers and GluK5 subunits proximal to the channel. Strikingly, during desensitization, GluK2, but not GluK5, subunits undergo major structural rearrangements to facilitate channel closure. We show how the large conformational differences between antagonist-bound and desensitized states are mediated by the linkers connecting the pore helices to the ligand binding domains. This work presents the first KAR heteromer structure, reveals how its subunits are organized, and resolves how the heteromer can accommodate functionally distinct closed channel structures.

Keywords: HEK cells; Sf9 cells; baculovirus; human; molecular biophysics; neuroscience; structural biology.


Conflict of interest statement

NK, PB, AP, DB, JM No competing interests declared

Figures

Figure 1.
Figure 1.. Structure of the GluK2/K5 heteromer.
(A) Cryo-electron microscopy (cryo-EM) structure of the GluK2/K5em heteromer in a 6-cyano-7-nitroquinoxaline-2,3-dione (CNQX)-bound state with GluK2em and GluK5em subunits rendered in green and blue, respectively. The panel shows the map for the amino terminal domain (ATD) layer and the map for the ligand binding domain (LBD)-transmembrane domain (TMD) assembly which were reconstructed independently, as described in the text. (B and C) Molecular model for the receptor colored as in (A) and shown from two different views parallel to the membrane. (D–F) The three layers of the GluK2/K5em heteromer as viewed from the extracellular space. The local symmetries of the ATD (D, twofold), LBD (E, twofold), and TMD (F, fourfold) are illustrated.
Figure 1—figure supplement 1.
Figure 1—figure supplement 1.. Heteromer construct design and structural annotation.
Amino acid sequences for GluK2em and GluK5em cryo-electron microscopy (cryo-EM) expression constructs aligned with wild-type subunit sequences from human (Homo sapiens, hs) and rat (Rattus norvegicus, rn). Alignment made with Clustal Omega server and asterisks indicate positions which have a single fully conserved residue, colons indicate conservation between groups with strongly similar properties, and periods indicate conservation between groups of weakly similar properties. N-linked glycans used for subunit identification and computationally predicted by the N-glycosylation NetNGlyc 1.0 server are shown in green. These positions are N67, N378, N412, N546 (GluK2) and N219, N271, N322, N372, N394 (GluK5). Annotations are given for predicted signal peptides (red dashed boxes), mutations (yellow), and the GluK5 C-terminal replacement (blue).
Figure 1—figure supplement 2.
Figure 1—figure supplement 2.. Heteromer construct illustrations and functional validation.
(A) Illustrations of GluK2em (top, green) and GluK5em (bottom, blue). The GluK2em subunit is annotated to indicate amino terminal domain (ATD), ligand binding domain (LBD), and transmembrane domain (TMD). TMD pre-M1 helix, transmembrane helices (M1, M3, M4), re-entrant helix (M2), and LBD-TMD linkers (S1–M1, M3–S2, S2–M4) are depicted. Cysteine mutations for GluK2em (C576V, C595S) and GluK5em (C559V, C578S, C619I, C813A) are marked by yellow dots, and the ‘A2 tail’ (YKSRAEAKRMK) on GluK5em is shown in cyan. C-terminal affinity tags are not illustrated. (B–D) Responses of cells transfected with wild-type (WT) GluK2 (top row) or cells co-transfected with WT GluK2 and WT GluK5 (bottom row). Typical responses to long application (250 ms, black bar) and a short pulse (1 ms, black triangle) of L-Glu are shown in (B) and (C), respectively. The traces are shown as an overlay in (D), with traces from the 1 ms pulse experiment (C) shown in color. The brief L-Glu pulse evokes a slow deactivation current in the GluK2 and GluK5 co-transfection condition which signifies GluK2/K5 heteromer activity. (E–G) Functional assays for GluK2em and GluK5em constructs used for structural work. Constructs were tested by evaluating GluK2em alone (E) and GluK2em co-expressed with GluK5em (F). Outside-out patches were exposed to 1 mM L-Glu for 250 ms (desensitization, black traces) and 1 ms (deactivation, colored traces). Heteromers were identified using the 1 ms response, as GluK2/K5 current decay (deactivation) occurs on a slower time scale compared to GluK2 (G).
Figure 1—figure supplement 3.
Figure 1—figure supplement 3.. Heteromer biochemistry and cryo-electron microscopy (cryo-EM).
(A and B) Size exclusion chromatography trace for the GluK2/K5em receptor (A) and SDS-PAGE of purified receptor after Coomassie staining (B).
Figure 1—figure supplement 4.
Figure 1—figure supplement 4.. Cryo-electron microscopy (cryo-EM) image processing and structure for GluK2/K5em in an apo resting state.
(A) Cryo-EM micrograph of GluK2/K5em-apo. (B) Data processing workflow for GluK2/K5em-apo cryo-EM images. The workflow proceeds from top to bottom. Cryo-EM density maps are color-coded as green or gray according to whether they are retained or discarded, respectively. The percentage of particles in each class from heterogeneous refinement is given. (C) Final structure after non-uniform refinement shown from four perspectives. The red annotations indicate that the amino terminal domain (ATD) layer is observed tilting away from the receptor central axis by ~15°. Inset is given to show the two pairs of ligand binding domain (LBD) dimers (dashed box, right). (D) Gold-standard Fourier shell correlation (FSC) curves for the unmasked map (cyan) and masked map (black). (E) Angular distribution plot for particles in the reconstruction, as generated by cryoSPARC. (F) Local resolution heat map with color bar units in Å.
Figure 1—figure supplement 5.
Figure 1—figure supplement 5.. Analysis of ligand binding domain (LBD) conformations.
(A) Cryo-electron microscopy (cryo-EM) densities for all four LBDs (gray) from the GluK2/K5em-apo cryo-EM map. Each LBD density is fitted with an apo LBD crystal structure (top row, yellow) or a L-glutamate (L-Glu)-bound LBD crystal structure (bottom row, magenta). No apo kainate receptor (KAR) LBD structure is available so we used the AMPAR GluA2 apo LBD crystal structure as an approximation (PDB: 1FTO). The structure of GluK2 with L-Glu (PDB: 1S50) was used in all four bottom panels because no GluK5 crystal structures are available. The analysis shows that LBDs from the cryo-EM structure are compatible with apo LBD conformations. (B) Individual LBDs from the model of GluK2/K5em-CNQX (gray) were analyzed by superimposing them with an antagonist-bound LBD crystal structure (cyan), or a L-Glu-bound LBD crystal structure (magenta). RMSD values are given for each LBD comparison. The cryo-EM structure has C2 symmetry imposed so the A/C and B/D subunits are equivalent. No 6-cyano-7-nitroquinoxaline-2,3-dione (CNQX)-bound KAR LBD structure is available so GluK2 bound by antagonist LY466195 was used for the comparison (PDB: 5CMK). The structure of GluK2-L-Glu (PDB: 1S50) was used in the bottom row. This shows that LBDs from the GluK2/K5em-CNQX structure have open binding clefts which are compatible with antagonist occupancy. (C) Individual LBDs from the model of GluK2/K5em-L-Glu (gray) were analyzed as in (B). The analysis shows that the LBDs from the GluK2/K5em-L-Glu structure have closed binding clefts which are compatible with L-Glu occupancy. The cryo-EM structure has C2 symmetry imposed so the A/C and B/D subunits are equivalent.
Figure 1—figure supplement 6.
Figure 1—figure supplement 6.. Cryo-electron microscopy (cryo-EM) image processing workflow for GluK2/K5em with 6-cyano-7-nitroquinoxaline-2,3-dione (CNQX).
(A) Cryo-EM micrograph of GluK2/K5em-CNQX. (B) Data processing workflow for GluK2/K5em-CNQX cryo-EM images. The workflow proceeds from top to bottom. Cryo-EM density maps are color-coded as green or gray according to whether they are retained or discarded, respectively. Three-dimensional class averages were generated from two parallel heterogenous refinement jobs, with each job processing approximately half of the data. The percentage of particles in each class is given.
Figure 1—figure supplement 7.
Figure 1—figure supplement 7.. Resolution determination for GluK2/K5em structures with 6-cyano-7-nitroquinoxaline-2,3-dione (CNQX).
(A, D, and G) Gold-standard Fourier shell correlation (FSC) curves for the unmasked maps (cyan) and masked maps (black). (B, E, and H) Angular distribution for particles in the reconstructions as produced by cryoSPARC. (C, F, and I) Local resolution heat map for the structures with color bar units in Å. The panels correspond to the GluK2/K5em-CNQX full-length structure (A–C), amino terminal domain (ATD) structure (D–F), and the ligand binding domain (LBD)-transmembrane domain (TMD) structure (G–I).
Figure 1—figure supplement 8.
Figure 1—figure supplement 8.. Mutually exclusive sites of glycosylation on GluK2 and GluK5 subunits.
(A) The amino terminal domain (ATD) map for GluK2/K5em shown with its structural model. GluK2em and GluK5em subunits are shown in light gray and dark gray, respectively. Selected N-linked glycan positions that are mutually exclusive between GluK2em and GluK5em subunits are shown in green and marked by numbered bounding boxes. (B) Magnified views of N-linked glycans for GluK5em (A/C subunits) and GluK2em (B/D subunits). (C) The ligand binding domain (LBD)-transmembrane domain (TMD) map for GluK2/K5em shown with its structural model. Subunits are colored as in (A). The inset shows the glycan found at position N546 on GluK2em. Only one instance of N546 is shown in the inset because the LBD-TMD map has C2 symmetry applied making the glycan densities equivalent on B and D subunits. (D and E) Three theoretical subunit configurations for the GluK2/K5 ATD layer (C) and LBD layer (D) assuming a 2:2 stoichiometry. Cartoons illustrate the ATD and LBD layers as viewed from the extracellular side. Analysis in (A) and (B) validates the third subunit configurations (black boxes).
Figure 2.
Figure 2.. Analysis of the GluK2/K5 ligand binding domain (LBD) layer.
(A) Extracellular view of LBD layers for (left to right) GluK2/K5em, GluK2, GluN1b/N2B, and GluA1/A2. The LBD layers are extracted from full-length antagonist-bound cryo-electron microscopy (cryo-EM) structures: GluK2/K5em-CNQX, GluK2-LY466195 (PDB: 5KUH), GluN1b/N2B-SDZ 220–040/L689,560 (PDB: 6WHU), GluA1/A2-γ8-NBQX (PDB: 6QKC). (B) LBD layers as viewed in (A), but shown with secondary structure and helices B (red) and G (yellow) colored as visual guides for subunit orientation. (C) Intersubunit measurements for heteromeric LBD layers as shown in (A). Measurements are between the centers of mass for each LBD as calculated in UCSF ChimeraX. (D) LBDs are shown colored as in (B) but viewed parallel to the membrane.
Figure 3.
Figure 3.. GluK2/K5 channel structure and symmetry.
(A and B) GluK2/K5em transmembrane domain (TMD) as seen parallel to the membrane (A) and perpendicular to the membrane from the intracellular side (B). Eye icon in (A) gives the perspective presented in (B). GluK2em and GluK5em subunits rendered in green and blue, respectively. (C) Visualization of the pore volume. Regions with pore radius less than 1.15 Å are red, water-accessible sections with radius larger than 1.15 Å are gray. One receptor subunit is hidden to give a view of the pore. (D) View of the channel from the extracellular side with M3 helix bundle (ribbons) and residues at pore constriction sites (ball-and-stick atoms). (E) Sequence alignment between GluK2 and GluK5 for the M3 helix of the TMD and the E helix of the ligand binding domain (LBD). Residues at pore constrictions are highlighted in red. (F) Comparison of pore profiles for GluK2/K5em (black), GluK2 (magenta), GluA1/A2 (green), and GluN1/N2B (red). Arrows indicate constrictions along GluK2/K5em permeation pathway. Plot shows pore radius as a function of channel position. Vertical dashed line marks 1.15 Å pore radius. Analysis done using PDB files 5KUF (GluK2), 6QKC (GluA1/A2), and 6WHU (GluN1b/N2B). (G) The two GluK2em subunits are aligned as a rigid body with the two GluK5em subunits. Gray line marks the central axis of the channel. Red markers and arrows designate pore constrictions seen in (C,F).
Figure 4.
Figure 4.. Structure of GluK2/K5 in a desensitized state.
(A) Cryo-electron microscopy (cryo-EM) structure of the GluK2/K5em heteromer in a L-glutamate (L-Glu)-bound state with GluK2em and GluK5em subunits rendered in green and blue, respectively. The panel shows the map for the amino terminal domain (ATD) layer and the map for the ligand binding domain (LBD)-transmembrane domain (TMD) assembly which were reconstructed independently, as described in the text. (B) Molecular model for the receptor is colored as in (A) and shown parallel to the membrane. (C) The LBD (top) and TMD (bottom) layers as viewed from the extracellular space. The local symmetries of the LBD (twofold) and TMD (fourfold) are illustrated. (D and E) Top view of LBD layer for the GluK2/K5em heteromer. The model is shown without (D) and with (E) secondary structure. Helices B (red) and G (yellow) are colored as visual guides for subunit orientation. Inset highlights the desensitization ring formed by G helices. (F) LBDs are shown colored as in (E) but viewed parallel to the membrane. Individual B/D and A/C LBDs are aligned and presented to highlight different out of plane tilts, and the more elevated position of the G helices in A/C subunits. (G–I) Visualization of the LBD layer from the GluK2 homomer (PDB: 5KUF). GluK2 subunits shown in gray, and panel coloring and arrangement is otherwise the same as in (D–F).
Figure 4—figure supplement 1.
Figure 4—figure supplement 1.. Cryo-electron microscopy (cryo-EM) image processing workflow for GluK2/K5em with L-glutamate (L-Glu).
(A) Cryo-EM micrograph of GluK2/K5em-L-Glu. (B) Data processing workflow for GluK2/K5em-L-Glu cryo-EM images. The workflow proceeds from top to bottom. Cryo-EM density maps are color-coded as green or gray according to whether they are retained or discarded, respectively. The percentage of particles in each class is given.
Figure 4—figure supplement 2.
Figure 4—figure supplement 2.. Resolution determination for GluK2/K5em structures with L-glutamate (L-Glu).
(A, D, and G) Gold-standard Fourier shell correlation (FSC) curves for the unmasked maps (cyan) and masked maps (black). (B, E, and H) Angular distribution for particles in the reconstructions as produced by cryoSPARC. (C, F, and I) Local resolution heat map for the structures with color bar units in Å. The panels correspond to the GluK2/K5em-L-Glu full-length structure (A–C), amino terminal domain (ATD) structure (D–F), and the ligand binding domain (LBD)-transmembrane domain (TMD) structure (G–I).
Figure 5.
Figure 5.. The M3-S2 linkers accommodate different ligand binding domain (LBD) arrangements.
(A) GluK2/K5em LBD-transmembrane domain (TMD) assembly, without the amino terminal domain (ATD) layer. Antagonist-bound state (left) annotated with arrows to convey conformational differences with the desensitized state (right). (B) Conformational differences as shown from the perspective of the eye icon given in (A). (C) Cartoon depicting differences between the states as viewed extracellularly, down the receptor axis. Black dots symbolize LBD binding cleft locations. (D and E) Lateral motions along the range from M3 helices through E helices. Comparison between antagonist-bound (D, top) and desensitized (D, bottom). Panel (E) considers the antagonist-bound state as a reference and measures the extent to which each chain in the desensitized state deviates from that reference. M3 helices show low deviation in all four subunits, consistent with minimal conformational difference. The M3-S2 linkers and E helix show modest deviation in GluK5em (A/C) and large deviations in GluK2em (B/D). Ranges are from L631-K676 (GluK2em) and L615-D660 (GluK5em). (F and G) Vertical differences along the M3 helix through E helix range. Comparison between antagonist-bound (F, top) and desensitized (F, bottom) indicates that lateral differences in GluK2em (B/D) subunits position are paired with a vertical rise (~6 Å). Panel (G) measures the vertical rise in each subunit as a function of amino acid residue, showing that for the antagonist-bound state the GluK2em (B/D) E helices reside at lower positions than in GluK5em subunits (A/C). This difference is essentially not present in the desensitized state, where all subunit chains rise in similar ways to reach approximately equal elevations above the membrane.
Figure 5—figure supplement 1.
Figure 5—figure supplement 1.. Cryo-electron microscopy (cryo-EM) density and model for M3 helices, M3-S2 linkers, and E helices.
(A and B) Density map and model for the M3 transmembrane helices, M3-S2 linkers, and E helices of the ligand binding domain (LBD) for GluK2/K5em-6-cyano-7-nitroquinoxaline-2,3-dione (CNQX). The A/C subunits are shown in (A) and B/D subunits in (B). The LBD-transmembrane domain (TMD) density map from particle subtraction is used for the panels. (C and D) Same as in (A and B) but for the GluK2/K5em-L-glutamate (L-Glu) structure.

Similar articles

Cited by

References

    1. Aller MI, Pecoraro V, Paternain AV, Canals S, Lerma J. Increased dosage of High-Affinity kainate receptor gene grik4 alters synaptic transmission and reproduces autism spectrum disorders features. The Journal of Neuroscience. 2015;35:13619–13628. doi: 10.1523/JNEUROSCI.2217-15.2015. - DOI - PMC - PubMed
    1. Alt A, Weiss B, Ogden AM, Knauss JL, Oler J, Ho K, Large TH, Bleakman D. Pharmacological characterization of glutamatergic agonists and antagonists at recombinant human homomeric and heteromeric kainate receptors in vitro. Neuropharmacology. 2004;46:793–806. doi: 10.1016/j.neuropharm.2003.11.026. - DOI - PubMed
    1. Armstrong N, Jasti J, Beich-Frandsen M, Gouaux E. Measurement of conformational changes accompanying desensitization in an ionotropic glutamate receptor. Cell. 2006;127:85–97. doi: 10.1016/j.cell.2006.08.037. - DOI - PubMed
    1. Barberis A, Sachidhanandam S, Mulle C. GluR6/KA2 kainate receptors mediate slow-deactivating currents. Journal of Neuroscience. 2008;28:6402–6406. doi: 10.1523/JNEUROSCI.1204-08.2008. - DOI - PMC - PubMed
    1. Bowie D. Ionotropic glutamate receptors & CNS disorders. CNS & Neurological Disorders Drug Targets. 2008;7:129– 143. doi: 10.2174/187152708784083821. - DOI - PMC - PubMed

Publication types