. 2021 Feb 9;217(2):iyaa027.
doi: 10.1093/genetics/iyaa027.

Rapid evolution at the Drosophila telomere: transposable element dynamics at an intrinsically unstable locus

Affiliations

Rapid evolution at the Drosophila telomere: transposable element dynamics at an intrinsically unstable locus

Michael P McGurk et al. Genetics. .

Abstract

Drosophila telomeres have been maintained by three families of active transposable elements (TEs), HeT-A, TAHRE, and TART, collectively referred to as HTTs, for tens of millions of years, which contrasts with an unusually high degree of HTT interspecific variation. While the impacts of conflict and domestication are often invoked to explain HTT variation, the telomeres are unstable structures such that neutral mutational processes and evolutionary tradeoffs may also drive HTT evolution. We leveraged population genomic data to analyze nearly 10,000 HTT insertions in 85 Drosophila melanogaster genomes and compared their variation to other more typical TE families. We observe that occasional large-scale copy number expansions of both HTTs and other TE families occur, highlighting that the HTTs are, like their feral cousins, typically repressed but primed to take over given the opportunity. However, large expansions of HTTs are not caused by the runaway activity of any particular HTT subfamilies or even associated with telomere-specific TE activity, as might be expected if HTTs are in strong genetic conflict with their hosts. Rather than conflict, we instead suggest that distinctive aspects of HTT copy number variation and sequence diversity largely reflect telomere instability, with HTT insertions being lost at much higher rates than other TEs elsewhere in the genome. We extend previous observations that telomere deletions occur at a high rate, and surprisingly discover that more than one-third do not appear to have been healed with an HTT insertion. We also report that some HTT families may be preferentially activated by the erosion of whole telomeres, implying the existence of HTT-specific host control mechanisms. We further suggest that the persistent telomere localization of HTTs may reflect a highly successful evolutionary strategy that trades away a stable insertion site in order to have reduced impact on the host genome. We propose that HTT evolution is driven by multiple processes, with niche specialization and telomere instability being previously underappreciated and likely predominant.

Keywords: Drosophila; genomic conflict; telomere; terminal deletions; transposable element.


Figures

Figure 1
Figure 1
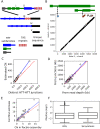
Methodological overview. (A) Graphical representation of a Drosophila telomere and the junctions we use to query telomere variation: (i) junctions between adjacent HTTs of the same subfamily, (ii) a junction between adjacent insertions of two different HTT subfamilies, (iii) a junction between the HTT at the base of a telomere and its neighboring TAS repeat, and (iv) a junction between a healed terminal deficiency and unique sequence. The bottom diagram (v) depicts the structure of a chromosome with an unhealed deficiency. (B) An example using HeT-A5 to depict the correspondence between the junctions of adjacent insertions of the same subfamily (i in A) and Illumina read pairs from strain N16. Each dot corresponds to a read pair where both ends map unambiguously to the HeT-A5 consensus sequence. The Y-axis corresponds to the HeT-A5 plus strand and the X-axis to the minus strand. The diagonal of dots colored black corresponds to concordant reads that align as would be expected given the consensus element. Nonconcordant reads aligning off this diagonal reflect junctions between tandem elements (above the diagonal) or internal deletions (below the diagonal). Small indels may shift reads just above or below the diagonal, for example the gray cluster near the diagonal. Junctions between different families of repeats are detected by considering plots where the X- and Y-axes correspond to different consensus sequences. ConTExt identifies junctions by clustering the nonconcordant reads, cluster assignments are reflected by the color of the dots. The five clusters forming a horizontal line across the top of the plot correspond to five distinct tandem junctions between the 3ʹ end of a HeT-A5 element and the generally truncated 5ʹ-end of an adjacent HeT-A5. Two of the tandem arrangements are illustrated above the plot. (C–F) Comparisons of different approaches for estimating telomere length and HTT copy number, and comparisons against simulated data. The blue lines indicate OLS linear regressions and the red dotted lines indicate a one-to-one relationship for comparison. (C) The relationship between the total number of distinct HTT–HTT junctions identified by ConTExt in each strain (X-axis) and the total HTT copy number inferred from the read depth over these junctions (Y-axis). (D) A comparison of total telomere length in each strain estimated from the mapping-quality-filtered read count of junctions (Y-axis) and from coverage of HTT consensus sequences without mapping quality filtering (X-axis). The junction-based telomere-length estimates are obtained by multiplying the inferred copy number of each identified HTT–HTT junction by the length of the distal element inferred from its degree of 5ʹ truncation. (E) Correlation in CN estimates from simulated Illumina datasets with true copy number. Each dot represents the copy number of an HTT family in one of the five PacBio genomes. The X-axis indicates its copy number estimated from the number of 3ʹ-ends detectable in BLAST alignments between the PacBio assembly and the HTT consensus sequences. The Y-axis is the copy number estimated by ConTExt from data simulated from the PacBio genomes using ART. (F) The downward bias in copy number we observe in the true GDL data is recapitulated in the simulations. The Y-axis is the observed read count divided by the read count expected given the junction’s local GC content. The boxplots depict the distribution of this ratio across all identified junctions in the true GDL data and the simulated data.
Figure 2
Figure 2
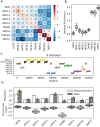
Telomeres are highly dynamic in Drosophila melanogaster. (A) Telomere length distribution (in kb) as estimated from HTT sequence abundance for each strain, grouped by population. Filled circles represent outlier strains. B: Beijing, I: Ithaca, N: Netherlands, T: Tasmania, Z: Zimbabwe. (B) A ternary plot depicting the proportion of each HTT family in each GDL strain. The angle of the tick on each axis indicates the corresponding gridline for that HTT family. (C) Proportion of full-length elements per subfamily per strain. (D) Telomere composition depicted by proportion of total telomere length per HTT subfamily as estimated from copy number. White corresponds to short telomere strains (bottom 10%), gray to long telomere strains (top 10%). (E) Telomere composition depicted by proportion of total telomere length per HTT family as estimated from copy number. White and gray are the same as in (D).
Figure 3
Figure 3
Comparing HTT variability to other TEs within Drosophila melanogaster. (A) Copy number of selected TEs per strain as estimated from junctions. Each dot indicates the copy number of a TE family in a single strain, and red dots indicate strains with extreme copy-number expansions (four standard deviations greater than the mean). TEs are grouped as: Left, TEs with copy number outliers; middle, HTTs; right, all other active TEs. Outliers occurring in strain I01 are indicated with arrows. (B) Scatter plot showing the relationship between mean copy number as estimated from junction data of TE families (log scale) and their variance (log scale) across the GDL. Designations of active and inactive TEs are from prior estimates of sequence divergence and population frequency as described in the Materials and Methods. Solid line represents the expected relationship under the assumption of little variation in population frequency and low linkage disequilibrium among insertions. Shaded regions summarize the distributions of mean and variance for inactive (gray), active (yellow), and the HTT and R-elements (purple) TE families, covering two standard deviations of bivariate Gaussians matched to the moments of the data they are approximating. (C) Boxplots depicting the distribution of variance-to-mean ratios (log10) in each of the four categories of the TEs.
Figure 4
Figure 4
HTT copy number and sequence variation in the context of other TEs. (A) A schematic of how allele copy number is analyzed. Top: Hypothetical example depicting the number of copies of a TE family in a single strain that contains given positions of the consensus sequence (as described in “Estimating copy number from read depth”). Both truncated and full-length copies of a TE will include positions near the 3ʹ end of the consensus, but only full-length copies will include positions near the 5ʹ end. Shown are two positions where polymorphisms exist such that the copy number can be partitioned into the major (black) and minor alleles (orange) (for details on allele copy-number estimation, see Materials and Methods section “Interpreting sequence variation within repeats”). Bottom: A schematic depicting hypothetical copy number variation of the most common minor allele across six strains. If the variance in copy number is greater or less than the mean, the copy number variation is called overdispersed (light red) or underdispersed (blue), respectively. (B) Sequence diversity across all copies of each active TE family in the GDL, estimated from the depth of reads supporting each possible allele. The contribution of positions where the minor allele displays overdispersed copy number variation, suggesting a variant in an active element, is indicated in red. The contribution of positions where the minor allele displays underdispersed copy number variation, suggesting a variant in an inactive element, is indicated in blue. (C) Boxplots depicting the fraction of diversity contributed by positions with overdispersed minor alleles for both HTTs and non-HTT active TEs. The difference in medians is 49% (p = 3e−4, permutation test, 100,000 permutations). (D, E) The mean–variance relationships of HeT-A (D) and hobo (E) broken down by the copy number of the major and minor alleles. Each dot reflects the observed mean and variance of the copy number of the major (blue) and minor (gold) alleles of positions with >0.1 sequence diversity. For reference, the shaded regions are re-plotted from Figure 3B. (F) The mean-variance relationship of TAHRE’s minor alleles, colored by whether the minor allele is found in the heterochromatic TAHRE insertions (blue) or is likely telomeric (red). Shaded regions are re-plotted from Figure 3B.
Figure 5
Figure 5
Terminal deficiencies are frequent and tend to be healed by TART family elements. (A) Location of all identified terminal deficiencies (triangles represent individual terminal deletions) and elements involved (see color legend; “none” indicates a terminal deficiency lacking any HTT–subtelomere junction) across all lines. Thin and thick black bars represent UTRs and exons, respectively, thin lines represent introns. Top, Chromosome 2 R; middle, Chromosome 3 L; bottom, Chromosome 3 R. X-axis scales are in kilobases; note that the telomeres are to the right for 2 R and 3 R, and to the left for 3 L. (B) TAS-L copy-number boxplot in strains with (+) or without (–) deficiencies on 3 L. (C) Boxplots comparing the total telomere length of strains with homozygous deficiencies and heterozygous deficiencies without observed HTT–subtelomere junctions (unhealed) to the telomere length of strains with healed deficiencies and without deficiencies. Strains with healed deficiencies (whether homozygous or heterozygous) will have eight telomeres whereas those with homozygous unhealed deficiencies will have only seven. Note that the Y-axis is in log10-scale.
Figure 6
Figure 6
HTT insertions tend to be enriched adjacent to themselves. (A) The observed frequency with which two HTTs neighbor each other relative to the expected frequency (log2). (B) Boxplots of the posterior distributions describing the degree to which elements tend to neighbor themselves (log2). The whiskers reflect the 95% credible intervals. (C) A visualization of the HTT subfamilies, depicted as thick bars, in the X chromosome telomere of the Release 6 reference. We depict alignments with at least 90% identity to the consensus; if a region is homologous to two elements, we assign it to the element with the greatest homology, which was only an issue due to some homology between TART-A and TART-C. The upward ticks indicate the 3ʹ-end of an element and the downward ticks the 5ʹ-end; a full-length insertion has both ticks. TART-A_PNTR is the TART-A Perfect Near-Terminal Repeat. (D) Top: The observed proportion with which each subfamily is found anywhere in the telomere (white) or is the first HTT found at the base of a telomere (gray). The error bars are 95% credible intervals computed analytically for Dirichlet-Multinomial models with uniform priors. Bottom: Boxplots summarizing posterior samples of the relative enrichment (log2) of each subfamily at the base of the telomere, accounting for telomere composition differences across strains. The whiskers span the 95% credible interval, determined as quantiles of the posterior sample.

Similar articles

Cited by

References

    1. Abad JP, De Pablos B, Osoegawa K, De Jong PJ, Martín-Gallardo A, et al. 2004. TAHRE, a novel telomeric retrotransposon from Drosophila melanogaster, reveals the origin of Drosophila telomeres. Mol Biol Evol. 21:1620–1624. - PubMed
    1. Agudo M, Losada A, Abad JP, Pimpinelli S, Ripoll P, et al. 1999. Centromeres from telomeres? The centromeric region of the Y chromosome of Drosophila melanogaster contains a tandem array of telomeric HeT-A- and TART-related sequences. Nucleic Acids Res. 27:3318–3324. - PMC - PubMed
    1. Arkhipova IR. 2012. Telomerase, retrotransposons, and evolution. In: Lue NF, Autexier C editors. Telomerases. Hoboken, NJ: John Wiley & Sons, Inc, p. 265–299.
    1. Bao W, Kojima KK, Kohany O. 2015. Repbase Update, a database of repetitive elements in eukaryotic genomes. Mob DNA. 6:11. - PMC - PubMed
    1. Begun DJ, Aquadro CF. 1995. Evolution at the tip and base of the X chromosome in an African population of Drosophila melanogaster. Mol Biol Evol. 12:382–390. - PubMed

Publication types

Substances

LinkOut - more resources