

Inference of population genetic parameters from an irregular time series of seasonal influenza virus sequences
- PMID: 33724414
- PMCID: PMC8045704
- DOI: 10.1093/genetics/iyaa039
Inference of population genetic parameters from an irregular time series of seasonal influenza virus sequences
Abstract
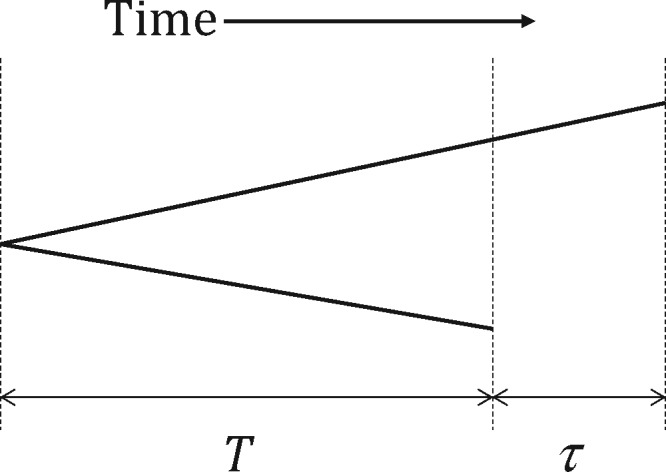
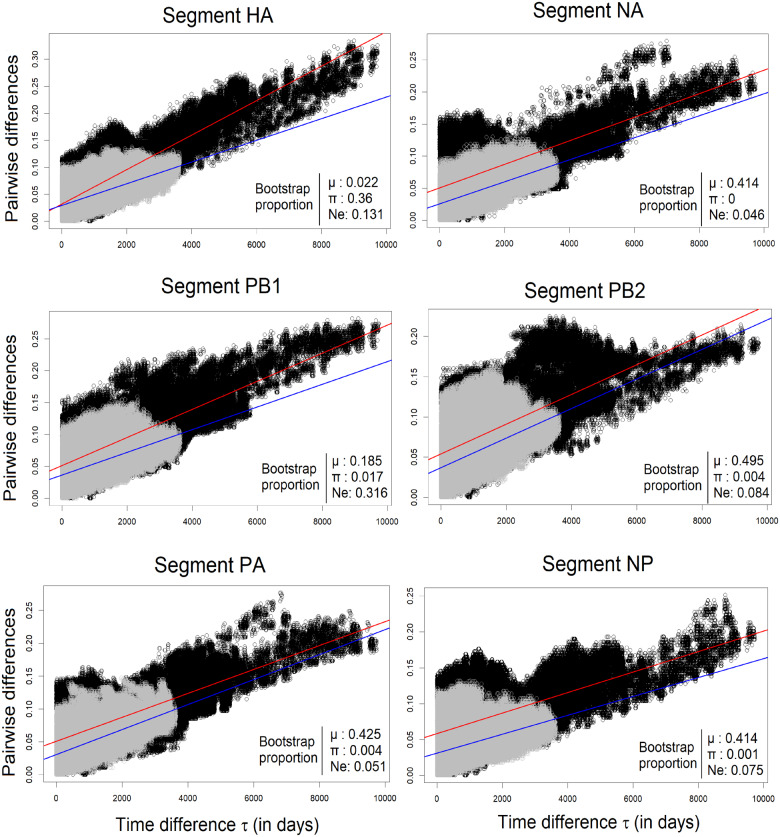
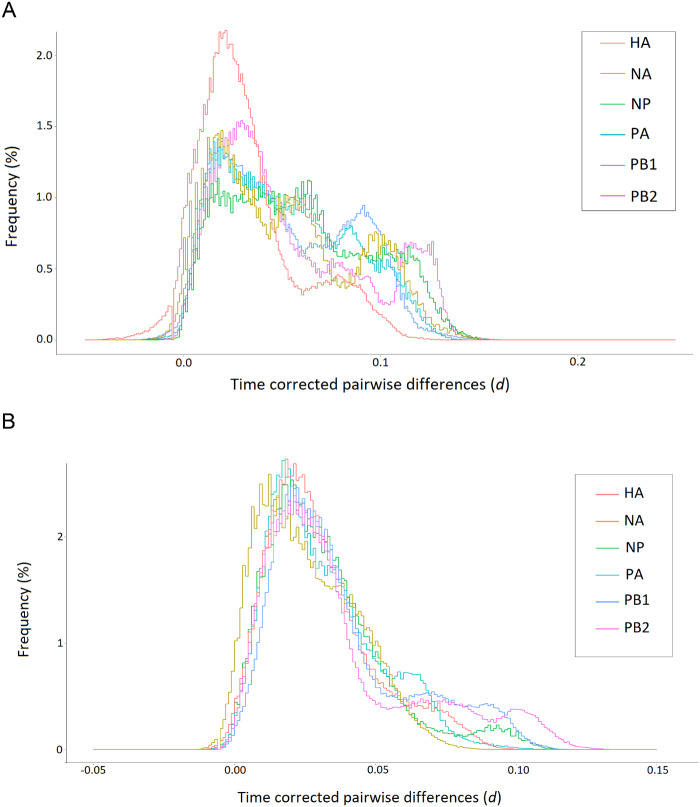
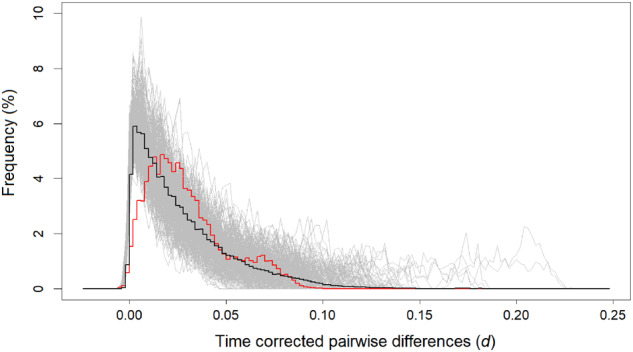
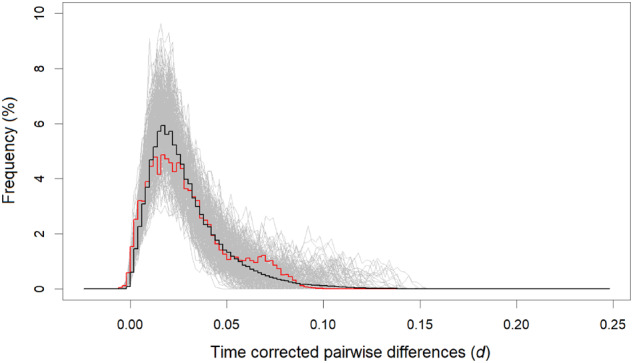
Basic summary statistics that quantify the population genetic structure of influenza virus are important for understanding and inferring the evolutionary and epidemiological processes. However, the sampling dates of global virus sequences in the last several decades are scattered nonuniformly throughout the calendar. Such temporal structure of samples and the small effective size of viral population hampers the use of conventional methods to calculate summary statistics. Here, we define statistics that overcome this problem by correcting for the sampling-time difference in quantifying a pairwise sequence difference. A simple linear regression method jointly estimates the mutation rate and the level of sequence polymorphism, thus providing an estimate of the effective population size. It also leads to the definition of Wright's FST for arbitrary time-series data. Furthermore, as an alternative to Tajima's D statistic or the site-frequency spectrum, a mismatch distribution corrected for sampling-time differences can be obtained and compared between actual and simulated data. Application of these methods to seasonal influenza A/H3N2 viruses sampled between 1980 and 2017 and sequences simulated under the model of recurrent positive selection with metapopulation dynamics allowed us to estimate the synonymous mutation rate and find parameter values for selection and demographic structure that fit the observation. We found that the mutation rates of HA and PB1 segments before 2007 were particularly high and that including recurrent positive selection in our model was essential for the genealogical structure of the HA segment. Methods developed here can be generally applied to population genetic inferences using serially sampled genetic data.
Keywords: influenza virus; mismatch distribution; serial sample; summary statistics.
© The Author(s) 2021. Published by Oxford University Press on behalf of Genetics Society of America. All rights reserved. For permissions, please email: journals.permissions@oup.com.
Figures
Similar articles
-
Population genetic processes affecting the mode of selective sweeps and effective population size in influenza virus H3N2.BMC Evol Biol. 2016 Aug 3;16:156. doi: 10.1186/s12862-016-0727-8. BMC Evol Biol. 2016. PMID: 27487769 Free PMC article.
-
Molecular epidemiology and evolution of A(H1N1)pdm09 and H3N2 virus during winter 2012-2013 in Beijing, China.Infect Genet Evol. 2014 Aug;26:228-40. doi: 10.1016/j.meegid.2014.05.034. Epub 2014 Jun 7. Infect Genet Evol. 2014. PMID: 24911284
-
The avian-origin PB1 gene segment facilitated replication and transmissibility of the H3N2/1968 pandemic influenza virus.J Virol. 2015 Apr;89(8):4170-9. doi: 10.1128/JVI.03194-14. Epub 2015 Jan 28. J Virol. 2015. PMID: 25631088 Free PMC article.
-
H3N2 influenza viruses in humans: Viral mechanisms, evolution, and evaluation.Hum Vaccin Immunother. 2018;14(8):1840-1847. doi: 10.1080/21645515.2018.1462639. Epub 2018 May 14. Hum Vaccin Immunother. 2018. PMID: 29641358 Free PMC article. Review.
-
An Epidemiological Analysis of Summer Influenza Epidemics in Okinawa.Intern Med. 2016;55(24):3579-3584. doi: 10.2169/internalmedicine.55.7107. Epub 2016 Dec 15. Intern Med. 2016. PMID: 27980256 Free PMC article. Review.
Cited by
-
Effects of host and pathogenicity on mutation rates in avian influenza A viruses.Virus Evol. 2022 Feb 21;8(1):veac013. doi: 10.1093/ve/veac013. eCollection 2022. Virus Evol. 2022. PMID: 35295747 Free PMC article.
References
Publication types
MeSH terms
LinkOut - more resources
Full Text Sources
Other Literature Sources
Medical
Miscellaneous
