Randomized Controlled Trial
. 2021 May;89(5):895-910.
doi: 10.1002/ana.26067. Epub 2021 Mar 30.

Serum Glial Fibrillary Acidic Protein: A Neuromyelitis Optica Spectrum Disorder Biomarker

Collaborators, Affiliations
Randomized Controlled Trial

Serum Glial Fibrillary Acidic Protein: A Neuromyelitis Optica Spectrum Disorder Biomarker

Orhan Aktas et al. Ann Neurol. 2021 May.

Abstract

Objective: Blood tests to monitor disease activity, attack severity, or treatment impact in neuromyelitis optica spectrum disorder (NMOSD) have not been developed. This study investigated the relationship between serum glial fibrillary acidic protein (sGFAP) concentration and NMOSD activity and assessed the impact of inebilizumab treatment.

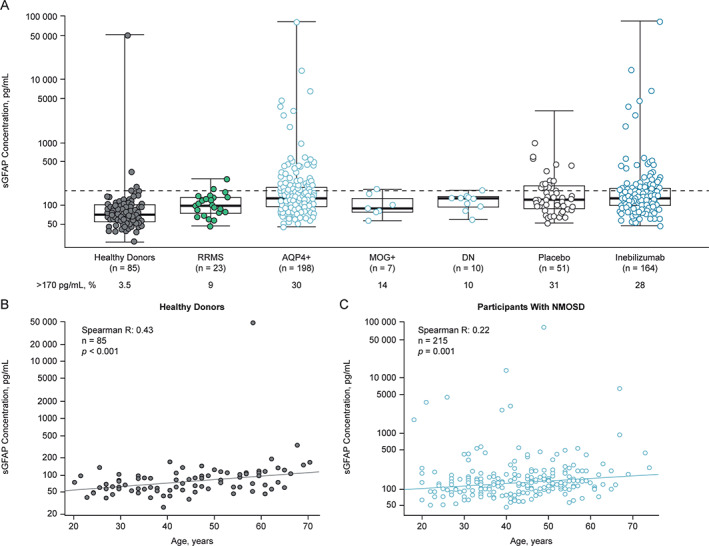
Methods: N-MOmentum was a prospective, multicenter, double-blind, placebo-controlled, randomized clinical trial in adults with NMOSD. sGFAP levels were measured by single-molecule arrays (SIMOA) in 1,260 serial and attack-related samples from 215 N-MOmentum participants (92% aquaporin 4-immunoglobulin G-seropositive) and in control samples (from healthy donors and patients with relapsing-remitting multiple sclerosis).

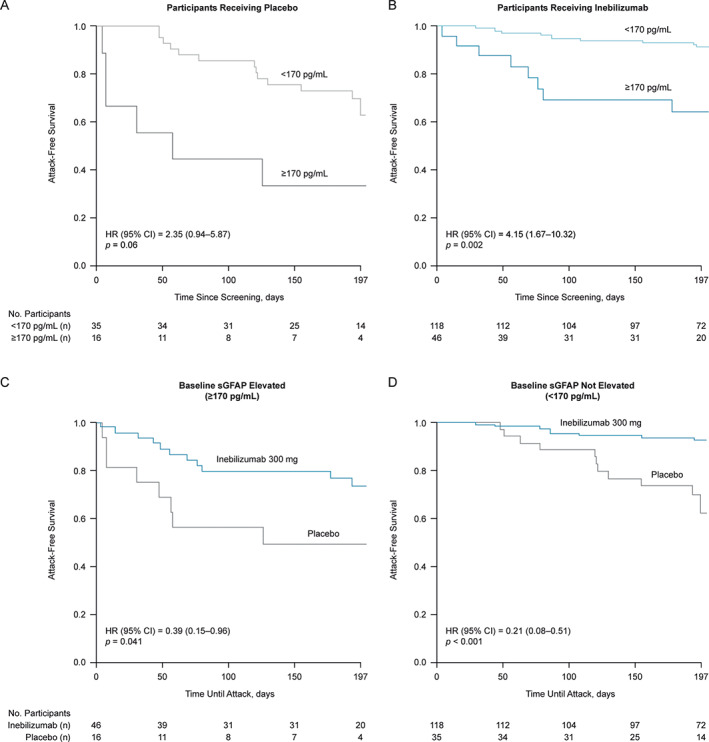
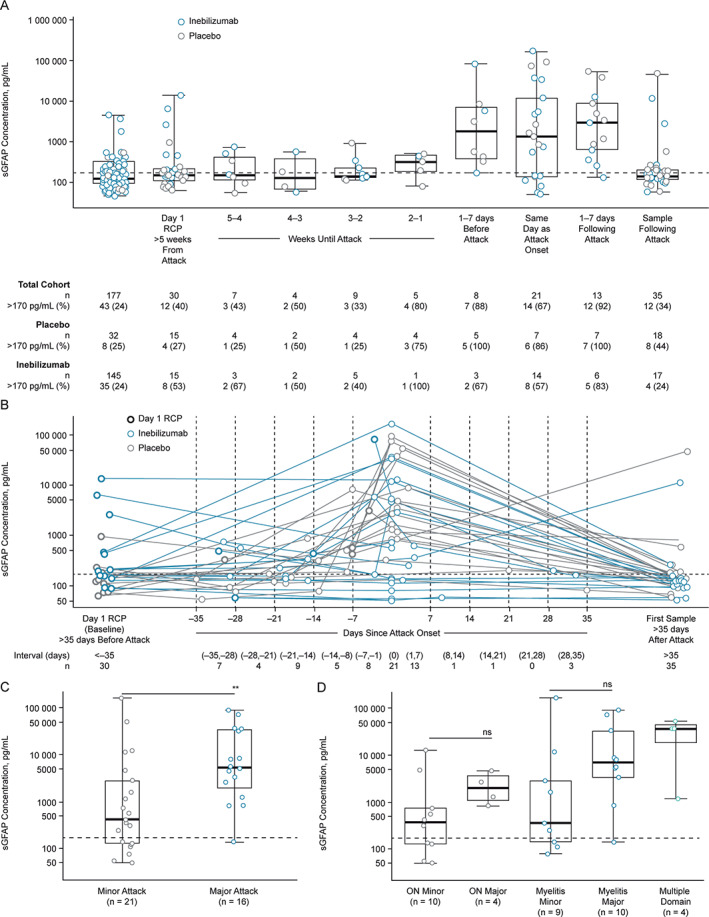
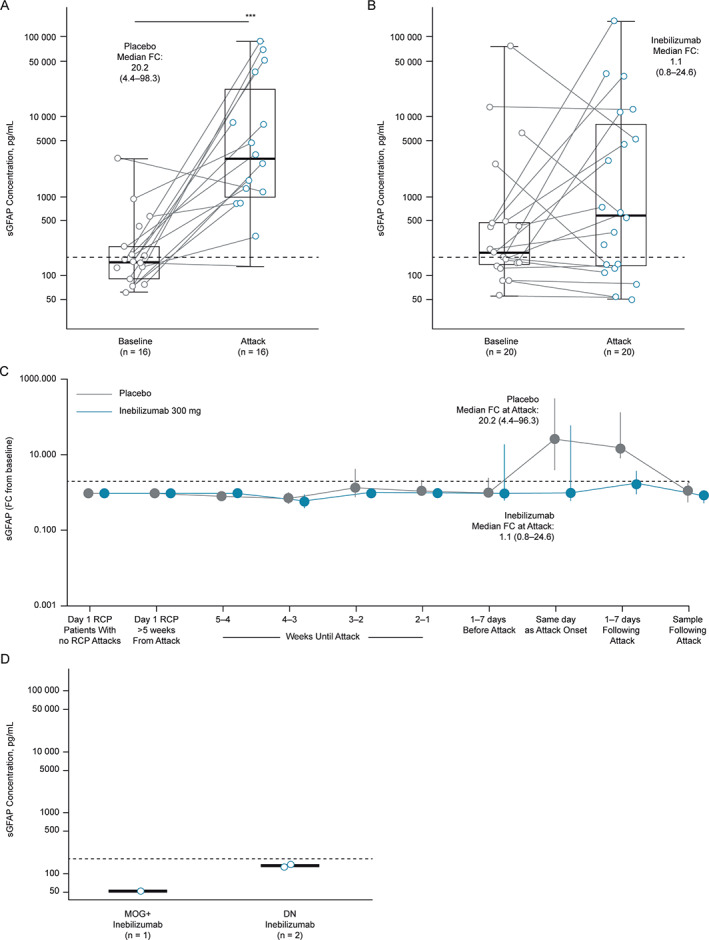
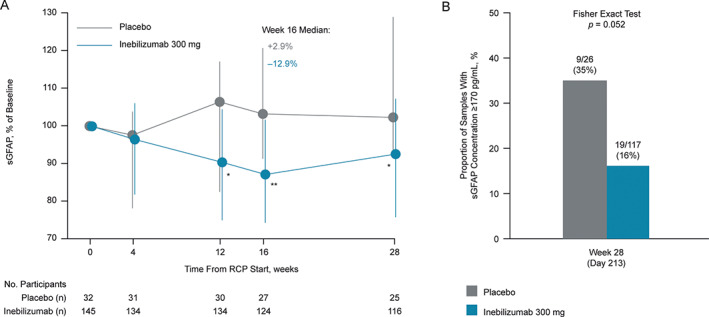
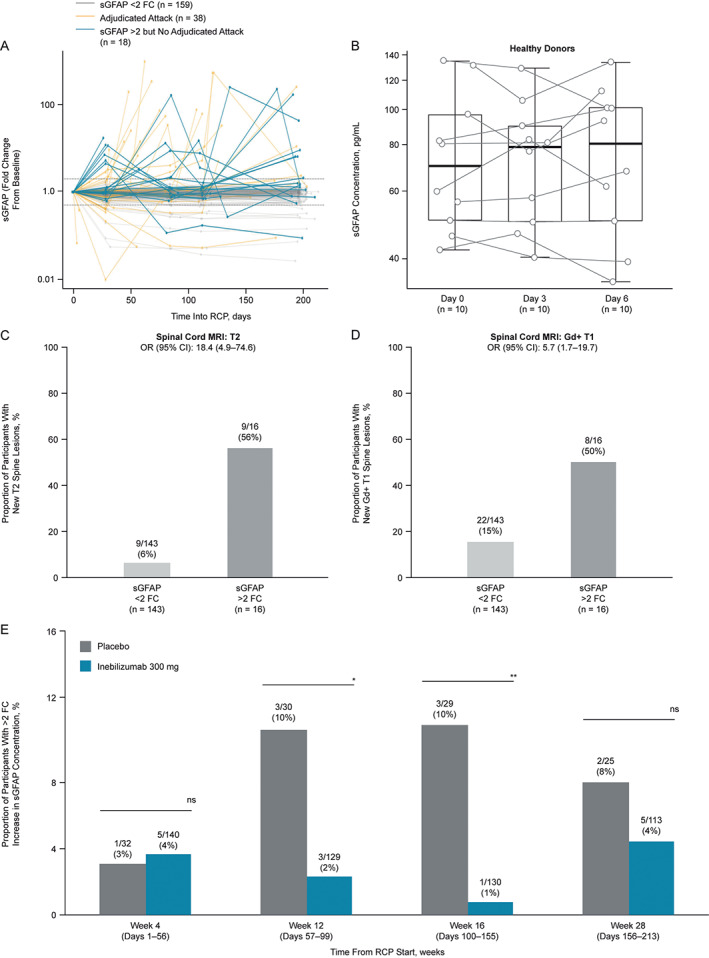
Results: At baseline, 62 participants (29%) exhibited high sGFAP concentrations (≥170 pg/ml; ≥2 standard deviations above healthy donor mean concentration) and were more likely to experience an adjudicated attack than participants with lower baseline concentrations (hazard ratio [95% confidence interval], 3.09 [1.6-6.1], p = 0.001). Median (interquartile range [IQR]) concentrations increased within 1 week of an attack (baseline: 168.4, IQR = 128.9-449.7 pg/ml; attack: 2,160.1, IQR = 302.7-9,455.0 pg/ml, p = 0.0015) and correlated with attack severity (median fold change from baseline [FC], minor attacks: 1.06, IQR = 0.9-7.4; major attacks: 34.32, IQR = 8.7-107.5, p = 0.023). This attack-related increase in sGFAP occurred primarily in placebo-treated participants (FC: 20.2, IQR = 4.4-98.3, p = 0.001) and was not observed in inebilizumab-treated participants (FC: 1.1, IQR = 0.8-24.6, p > 0.05). Five participants (28%) with elevated baseline sGFAP reported neurological symptoms leading to nonadjudicated attack assessments.

Interpretation: Serum GFAP may serve as a biomarker of NMOSD activity, attack risk, and treatment effects. ANN NEUROL 2021;89:895-910.

Trial registration: ClinicalTrials.gov NCT02200770.


Conflict of interest statement

Viela Bio and MedImmune funded the N‐MOmentum study. Viela Bio is the owner of inebilizumab. Mitsubishi Tanabe Pharma Corporation and Hansoh Pharmaceutical Group Co. Ltd. have partnerships with Viela Bio to develop and commercialize inebilizumab for NMOSD (and other potential indications) in Asia. O.A. serves on a steering committee for Viela Bio and has received funding for travel and fees from Viela Bio. M.A.S., W.R., D.S., and E.K. are employees of Viela Bio. J.L.B. reports payment for study design/consultation from Viela Bio and personal fees from Mitsubishi Tanabe Pharma Corporation. B.A.C.C. has nothing to report.

Figures

FIGURE 1
FIGURE 1
Baseline sGFAP concentration in the reference and NMOSD cohorts, and correlation of sGFAP with age. *p < 0.05; **p < 0.01; **p < 0.001. (A) Graph shows baseline sGFAP concentrations by cohort and antibody serostatus. Dashed line represents 2 SDs from the healthy donor mean (170 pg/ml). Box and whiskers represent sample quartiles. Statistical significance of differences in sGFAP concentration between groups was assessed using the Mann–Whitney U test. (B and C) Graphs show the correlation between age and baseline sGFAP concentration in both heathy donors and NMOSD participants. AQP4+ = aquaporin 4‐immunoglobulin G seropositive; DN = double negative serostatus; MOG+ = myelin oligodendrocyte glycoprotein‐immunoglobulin G seropositive; NMOSD = neuromyelitis optica spectrum disorder; RRMS = relapsing–remitting multiple sclerosis; SD = standard deviation; sGFAP = serum glial fibrillary acidic protein.
FIGURE 2
FIGURE 2
Attack‐free survival in participants with NMOSD according to treatment and baseline sGFAP status. Graphs show Kaplan–Meier plots of time until first NMOSD attack during the RCP in (A) placebo and (B) inebilizumab participants with baseline sGFAP concentration ≥170 pg/ml versus those with baseline sGFAP concentration <170 pg/ml. Statistical significance of difference in time until first adjudicated attack between groups was assessed using Wald's test. (C and D) Graphs show Kaplan–Meier plots of time until first attack between participants receiving inebilizumab or placebo with baseline sGFAP concentration <170 pg/ml or ≥170 pg/ml. Statistical significance of difference in time until first adjudicated attack between groups was assessed using Wald's test. CI = confidence interval; EDSS = Expanded Disability Status Scale; HR = hazard ratio; NMOSD = neuromyelitis optica spectrum disorder; RCP = randomized controlled period; sGFAP = serum glial fibrillary acidic protein.
FIGURE 3
FIGURE 3
The sGFAP concentration at baseline at visits leading to an adjudicated NMOSD attack, and during attack. (A) Graph shows a boxplot of sGFAP measurements leading up to attack in 38 participants who experienced an adjudicated attack and provided sGFAP measurements. Baseline samples >5 weeks from attack were available in 30 of 38 participants. Eight participants experienced attacks within 5 weeks of the baseline sample collection. (B) Graph shows a profile plot of sGFAP measurements in the days leading up to the attack. Graphs show sGFAP concentration of samples drawn most proximal to attack and within 1 week of adjudicated NMOSD attack by attack severity (C) and organ domain involvement (D), measured by the OSIS. Of the attacks across multiple domains, 4 were minor myelitis attacks, and one sample from myelitis major group displayed sGFAP within the healthy donor range. Box and whiskers represent sample quartiles. Statistical significance between groups was assessed using Mann–Whitney U test. Dashed lines represent 2 SDs from the healthy donor mean (170 pg/ml). NMOSD = neuromyelitis optica spectrum disorder; ON = optic neuritis; OSIS = Opticospinal Impairment Scale; RCP = randomized controlled period; SD = standard deviation; sGFAP = serum glial fibrillary acidic protein.
FIGURE 4
FIGURE 4
The sGFAP concentration during adjudicated NMOSD attacks. (A and B) Graphs show sGFAP concentration of most proximal samples drawn within 1 week of attack according to treatment in participants with attacks. Statistical significance of increases from baseline was assessed using the Wilcoxon signed‐rank test. Dashed line represents sGFAP concentration 2 SDs from the healthy donor mean (170 pg/ml). (C) Graph displays time course of FC in sGFAP from baseline in the weeks leading up to and proceeding adjudicated attacks. Points represent medians, error bars represent IQR. (D) The sGFAP concentration during adjudicated NMOSD attacks according to treatment group and antibody serostatus. Box and whiskers represent sample quartiles. DN = double negative serostatus; FC = fold change; IQR = interquartile range; MOG+ = myelin oligodendrocyte glycoprotein‐immunoglobulin G seropositive; RCP = randomized controlled period; SD = standard deviation; sGFAP = serum glial fibrillary acidic protein.
FIGURE 5
FIGURE 5
Change in sGFAP concentration from baseline in participants who did not experience an adjudicated NMOSD attack. (A) Graph shows change in sGFAP concentration over time in participants without attacks. Error bars represent interquartile range. Statistical significance of percentage change from baseline, comparing inebilizumab to placebo, was assessed using the Mann–Whitney U test; *p < 0.05; **p < 0.01; ***p < 0.001; week 16 changes from baseline remained significant (adjusted p value < 0.05) between dose groups after the Bonferroni correction was applied to p values. Nineteen of 117 (16%) inebilizumab samples and 9/26 (35%) placebo samples were outside healthy donor range (Fisher's exact test, p = 0.052). (B) Graph shows proportion of participants with elevated sGFAP concentrations (≥170 pg/ml) at week 28 of the RCP in participants receiving placebo or inebilizumab. FC = fold change; NMOSD = neuromyelitis optica spectrum disorder; RCP = randomized controlled period; sGFAP = serum glial fibrillary acidic protein.
FIGURE 6
FIGURE 6
The sGFAP increases in participants without adjudicated attacks are correlated with disease activity. (A) Profile plot of longitudinal fold change from baseline in sGFAP concentration in participants with NMOSD who experienced adjudicated attacks (gold), those who did not experience adjudicated attacks but displayed an increase greater than twofold from baseline (blue), and in those who neither experienced attacks nor displayed increases greater than twofold from baseline (gray) in sGFAP during the RCP. (B) Boxplots displaying sGFAP concentrations observed in 10 healthy controls across 3 blood draws. Proportion of (C) new spinal cord T2 or (D) Gd‐enhancing T1 lesions observed in participants who did not experience committee‐adjudicated attacks and had MRI scans, but either did or did not display a greater than twofold increase in sGFAP during the RCP. (E) Bar chart shows proportion of participants with an increase greater than twofold in sGFAP from baseline. The total number of participants at each time point represent those remaining in the RCP with available sGFAP data. Statistical significance in the between‐group difference was assessed using the Cochran–Armitage test, *p < 0.05; **p < 0.01; ***p < 0.001, week 16 changes from baseline remained significant (adjusted p value < 0.05) after the Bonferroni correction was applied to p values. AC = adjudication committee; CI = confidence interval; FC = fold change; Gd = gadolinium; MRI = magnetic resonance imaging; NMOSD = neuromyelitis optica spectrum disorder; OR = odds ratio; RCP = randomized controlled period; sGFAP = serum glial fibrillary acidic protein.

References

    1. Cree BA, Bennett JL, Sheehan M, et al. Placebo‐controlled study in neuromyelitis optica‐ethical and design considerations. Mult Scler 2016;22:862–872. - PMC - PubMed
    1. Trebst C, Jarius S, Berthele A, et al. Update on the diagnosis and treatment of neuromyelitis optica: recommendations of the Neuromyelitis Optica Study Group (NEMOS). J Neurol 2014;261:1–16. - PMC - PubMed
    1. Cree BA, Lamb S, Morgan K, et al. An open label study of the effects of rituximab in neuromyelitis optica. Neurology 2005;64:1270–1272. - PubMed
    1. Damato V, Evoli A, Iorio R. Efficacy and safety of rituximab therapy in neuromyelitis optica spectrum disorders: a systematic review and meta‐analysis. JAMA Neurol 2016;73:1342–1348. - PubMed
    1. Tahara M, Oeda T, Okada K, et al. Safety and efficacy of rituximab in neuromyelitis optica spectrum disorders (RIN‐1 study): a multicentre, randomised, double‐blind, placebo‐controlled trial. Lancet Neurol 2020;19:298–306. - PubMed

Publication types

MeSH terms

Associated data