. 2021 Apr;35(4):e21461.
doi: 10.1096/fj.202002511R.

RNA-Seq analysis of knocking out the neuroprotective proton-sensitive GPR68 on basal and acute ischemia-induced transcriptome changes and signaling in mouse brain

Affiliations

RNA-Seq analysis of knocking out the neuroprotective proton-sensitive GPR68 on basal and acute ischemia-induced transcriptome changes and signaling in mouse brain

Guokun Zhou et al. FASEB J. 2021 Apr.

Abstract

Brain acid signaling plays important roles in both physiological and disease conditions. One key neuronal metabotropic proton receptor in the brain is GPR68, which contributes to hippocampal long-term potentiation (LTP) and mediates neuroprotection in acidotic and ischemic conditions. Here, to gain greater understanding of GPR68 function in the brain, we performed mRNA-Seq analysis in mice. First, we studied sham-operated animals to determine baseline expression. Compared to wild type (WT), GPR68-/- (KO) brain downregulated genes that are enriched in Gene Ontology (GO) terms of misfolding protein binding, response to organic cyclic compounds, and endoplasmic reticulum chaperone complex. Next, we examined the expression profile following transient middle cerebral artery occlusion (tMCAO). tMCAO-upregulated genes cluster to cytokine/chemokine-related functions and immune responses, while tMCAO-downregulated genes cluster to channel activities and synaptic signaling. For proton-sensitive receptors, tMCAO downregulated ASIC1a and upregulated GPR4 and GPR65, but had no effect on ASIC2, PAC, or GPR68. GPR68 deletion did not alter the expression of these proton receptors, either at baseline or after ischemia. Lastly, we performed GeneVenn analysis of differential genes at baseline and post-tMCAO. Ischemia upregulated the expression of three hemoglobin genes, along with H2-Aa, Ppbp, Siglece, and Tagln, in WT but not in KO. Immunostaining showed that tMCAO-induced hemoglobin localized to neurons. Western blot analysis further showed that hemoglobin induction is GPR68-dependent. Together, these data suggest that GPR68 deletion at baseline disrupts chaperone functions and cellular signaling responses and imply a contribution of hemoglobin-mediated antioxidant mechanism to GPR68-dependent neuroprotection in ischemia.

Keywords: GPR68; OGR1; ischemia; neuroprotection; proton receptor; transcriptome.


Conflict of interest statement

CONFLICT OF INTEREST STATEMENT

The authors declare no competing interests.

Figures
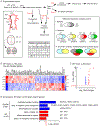
Figure 1.
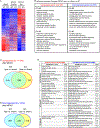
Figure 1.. Transcriptome changes in GPR68−/− brain.
(A) Experimental outline and analysis scheme. Top row shows the experimental flow chart for the 4 sets of experiments (exp 1–4) performed in this study. The table below shows the number of animals studied for each experiment (see Methods for more details on inclusion/exclusion criteria and number of animals excluded). Lower left box shows the scheme of the MCAO surgery. At 24 hr after the reperfusion, ipsilateral and contralateral brain tissue, approximately between AP 1.5 and −2.5, was isolated as illustrated. The boxed region on the right shows the scheme of three main groups of gene expression analysis: I. Baseline difference between WT and KO; II. Ischemia-induced changes; III. GPR68-dependent differential expression after ischemia. (B) Heat map and (C) Volcano plot showing the top 25 up- and down-regulated genes in GPR68−/− (vs. WT) brain. Sham operated brain tissues (3 WT and 3 KO) were used for RNA isolation and RNA-Seq analysis. In B, each row represents the profile of one animal. For all genes listed here, the differences between the two genotypes had the adjusted p value (PAdj) < 0.00001. In C, the X axis shows the fold change (log2 value) of the genes in KO as compared to WT, while the Y axis shows the PAdj value (in −log10 format). (D) Summary graph showing significantly changed GO functions of the top 25 downregulated (in blue bar) and upregulated (in red bar) genes. To the left of the Y axis shows the GO terms. The specific genes clustered to the corresponding GO function are shown on the right side of the bars. In C and D, red dashed lines on graphs indicate the line of Padj = 0.05.
Figure 2.
Figure 2.. Ischemia-induced gene profile changes.
(A) Heatmap showing transcriptome profile in sham operated, MCAO-contralateral brain, MCAO-ipsilateral brain of WT and GPR68−/− animals. (B) GO analysis of top 500 ischemia-altered genes in WT. The list shows the top 10 functions in MF (Molecular Function) and BP (Biological Pathway). (C & D) GeneVenn summary of ischemia-induced differential genes in WT and KO. For each genotype, ischemia-induced changes were analyzed by comparing ipsilateral brain to the sham control. The genes upregulated for >1 fold or downregulated for >50% in each genotype were used for GeneVenn analysis as described in Methods. (E) GO Molecular Function summary of ipsilateral side upregulated and downregulated genes (see Supplemental Table 1 for the gene list in each category). Genes upregulated or downregulated were separated into three categories: 1) WT KO shared refers to those which exhibited changes in both genotypes; 2) WT only for those changed solely in WT; c) KO only for those changed solely in the knockout. For detailed lists of all functional enrichment, see Supplemental Workbook 1.
Figure 3.
Figure 3.. GPR68-dependent changes after stroke in contralateral and ipsilateral brain.
(A & B) Heatmap showing differential genes in the GPR68−/− vs WT comparison of post-tMCAO contralateral (A) and ipsilateral (B) brain tissues.
Figure 4.
Figure 4.. GeneVenn analysis of upregulated genes in GPR68−/−.
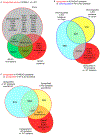
(A) GeneVenn analysis of genes upregulated in the GPR68−/− vs WT comparisons. The two genotypes were first compared within Sham, MCAO ipsilateral, and MCAO contralateral groups. The genes upregulated in KO in each of the three comparisons were further analyzed by a GeneVenn program to identify shared and distinct expression among the groups. (B & C) GeneVenn analysis of 1) genes upregulated in KO from MCAO ipsilateral comparison (i.e., vs. WT MCAO ipsilateral tissue) with 2) those downregulated in (B) or upregulated (C) from the ipsilateral vs sham comparison of the same genotype. Note that the majority of the genes upregulated in the KO ipsilateral vs WT ipsilateral comparison were not present in all other differential comparisons.
Figure 5.
Figure 5.. GeneVenn analysis of downregulated genes in GPR68−/−.
(A) GeneVenn analysis of genes downregulated in the GPR68−/− vs WT comparison in Sham, MCAO ipsilateral, and MCAO contralateral sides. (B) GeneVenn analysis of genes downregulated in ipsilateral side of GPR68−/− vs. WT comparison and those upregulated (B) in the ipsilateral vs sham comparisons of either WT or GPR68−/− brain. Genes in gold font were present only in the KO ipsilateral group in (A) while shared with those upregulated in WT ipsilateral vs sham comparison in (B). These genes fit the expected pattern for GPR68-dependent protective candidates (see Text and Table 2 for more explanation). (C) Summary graph showing significantly changed GO-molecular function of downregulated genes in GPR68−/− vs. WT ipsilateral comparison. (D) RNA-Seq result of hemoglobin family genes. FPKM was used to plot the expression level. P values on graph were Padj values determined in differential expression analysis by DESeq2. Each dot represented one animal.
Figure 6.
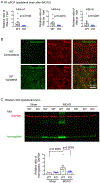
Figure 6.. GPR68 mediates ischemia-induced upregulation of hemoglobin.
(A) RT-qPCR verification of the three hemoglobin genes which were enriched in most Molecular Functions in Figure 5. The expression level was first normalized to a standard curve, as described in Method. Then the relative ratio of Hba or Hbb genes were normalized to that of Hprt. Each dot represents one animal. P values were from Mann-Whitney U test. (B) Immunolocalization of hemoglobin. Cryosections of WT tMCAO brain was stained with anti-hemoglobin (green) and anti-NeuN (red). Images were from contralateral (left panel) and ipsilateral (right panel) striatum. Note that most of increased hemoglobin signals in the ipsilateral side colocalize with NeuN staining. (C) Western blot verification of hemoglobin levels after tMCAO. Ipsilateral brain tissues were collected from sham operated or tMCAO (45’) animals at 24 hr after surgery. Lysates were blotted for hemoglobin and GAPDH (loading control). The summary was from 3 experiments with each dot represent one mouse. To allow comparison between the 3 cohorts of animals, average raw pixel ratio of Hemoglobin to GAPDH of WT sham in each experiment was set arbitrarily to 1.
Figure 7.
Figure 7.. Expression of proton-sensitive receptors in WT and KO brain.
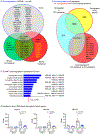
(A) Summary diagram showing the expression level of proton-sensing receptors. The Fragments Per Kilobase of transcript per Million mapped reads (FPKM) values from RNA-Seq were used to determine the relative expression of these receptors. Each dot represents one animal. For all comparisons, there was no significant differences between the two genotypes (Mann-Whitney U test). (B) Ischemia-induced changes. Sham (baseline) values were the same as in (A). p values shown were from One-way ANOVA with Tukey’s post hoc test. All other comparisons not labeled were not significant.
Figure 8.
Figure 8.. Comparison of WT differential expression studies and summary of GPR68-dependent changes.
(A & B) Comparison of current study with a 30 min tMCAO model (A) and a permanent MCAO model (B). Venn diagram analyzed the genes changed in post-ischemia WT in our study vs. the differential genes reported in specific categories (as illustrated on the Venn diagram) in the published studies. Note that the majority of previously identified differential genes were observed in the current study. (C) Summary diagram shows the key changes in GPR68−/− mice at baseline and after ischemia. In Post-Ischemia diagram on the right, the functions listed are those upregulated specifically in WT. The genes listed cluster to multiple functions on the left and were downregulated in KO. For details on the link of the genes to the predicted outcome, see Table 2 and text.

Similar articles

Cited by

References

    1. Chesler M, and Kaila K (1992) Modulation of pH by neuronal activity. Trends Neurosci 15, 396–402 - PubMed
    1. Highstein SM, Holstein GR, Mann MA, and Rabbitt RD (2014) Evidence that protons act as neurotransmitters at vestibular hair cell-calyx afferent synapses. Proc Natl Acad Sci U S A 111, 5421–5426 - PMC - PubMed
    1. Du J, Reznikov LR, Price MP, Zha XM, Lu Y, Moninger TO, Wemmie JA, and Welsh MJ (2014) Protons are a neurotransmitter that regulates synaptic plasticity in the lateral amygdala. Proc Natl Acad Sci U S A 111, 8961–8966 - PMC - PubMed
    1. Glitsch M (2019) Mechano- and pH-sensing convergence on Ca(2+)-mobilising proteins - A recipe for cancer? Cell Calcium 80, 38–45 - PubMed
    1. Silver IA, and Erecinska M (1992) Ion homeostasis in rat brain in vivo: intra- and extracellular [Ca2+] and [H+] in the hippocampus during recovery from short-term, transient ischemia. J Cereb Blood Flow Metab 12, 759–772 - PubMed

Publication types

LinkOut - more resources