. 2021 Apr;25(8):3885-3897.
doi: 10.1111/jcmm.16322. Epub 2021 Mar 16.

INO80 participates in the pathogenesis of recurrent miscarriage by epigenetically regulating trophoblast migration and invasion

Affiliations

INO80 participates in the pathogenesis of recurrent miscarriage by epigenetically regulating trophoblast migration and invasion

Shu Xian et al. J Cell Mol Med. 2021 Apr.

Abstract

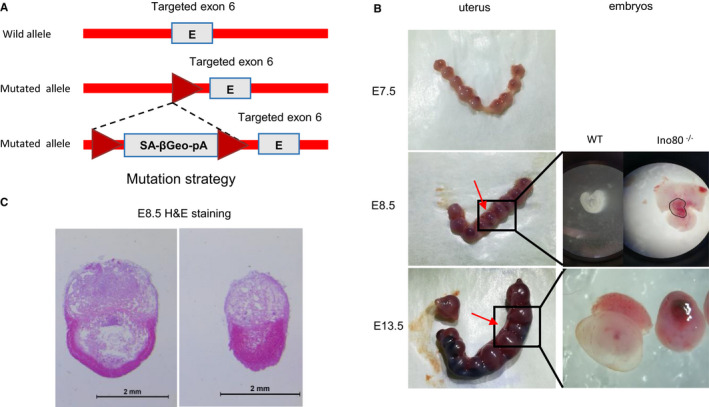
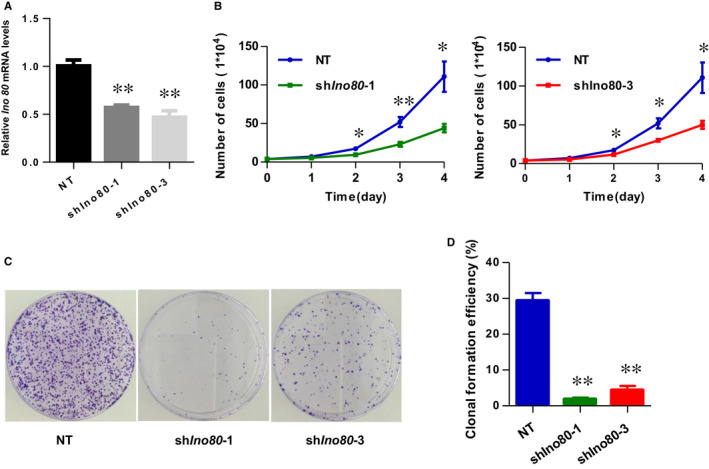
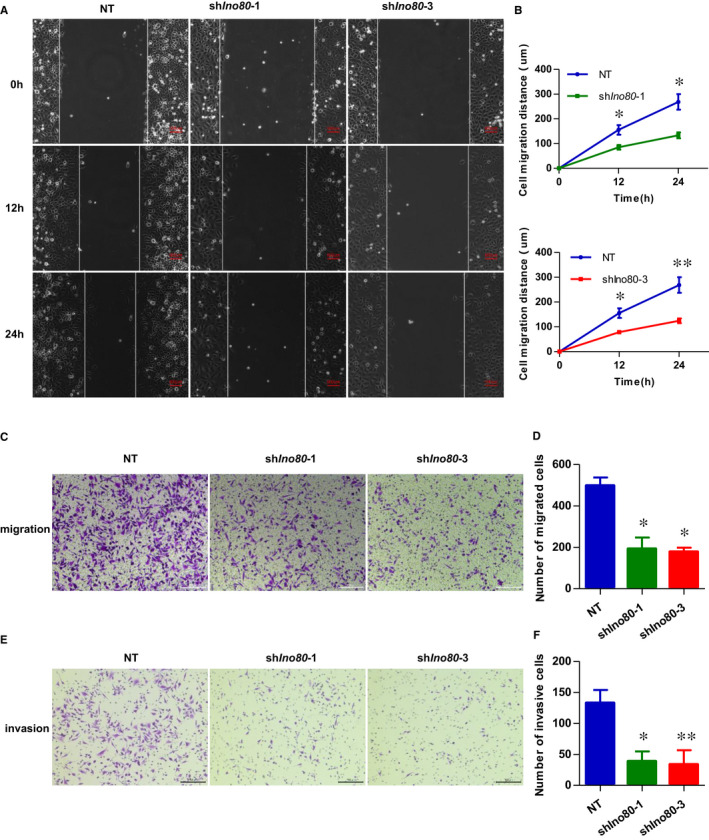
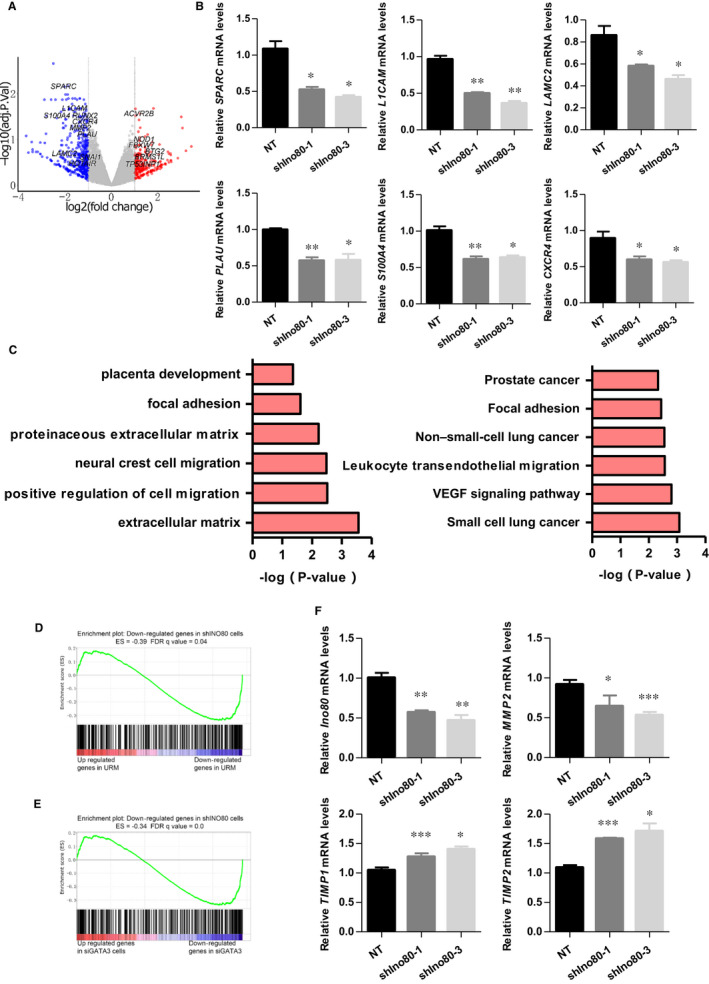
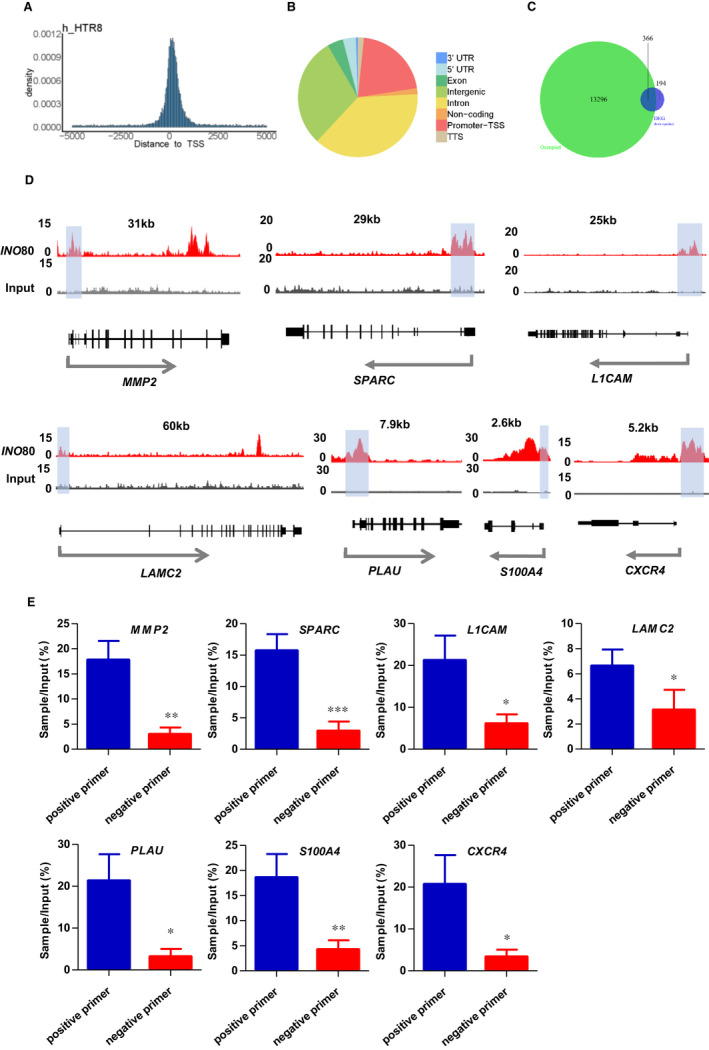
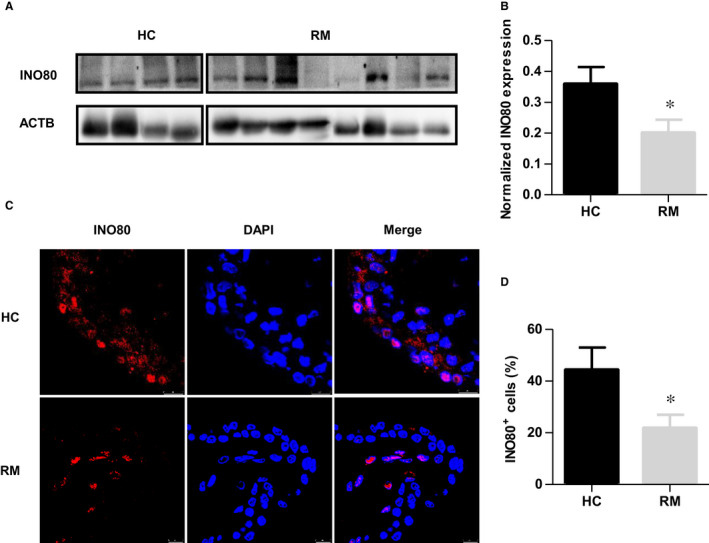
The INO80 complex, a SWI/SNF family chromatin remodeler, has regulatory effects on ESC self-renewal, somatic cell reprogramming and blastocyst development. However, the role of INO80 in regulating trophoblast cells and recurrent miscarriage (RM) remains elusive. To investigate the in vivo effects of Ino80 in embryo development, we disrupted Ino80 in C57 mice, which resulted in embryonic lethality. Silencing of Ino80 led to decreased survival capacity, migration and invasion of trophoblasts. Furthermore, RNA high-throughput sequencing (RNA-seq) revealed that Ino80 silencing closely resembled the gene expression changes in RM tissues. To investigate the mechanisms for these results, RNA-seq combined with high-throughput sequencing (ChIP-seq) was used in trophoblast cells, and it showed that Ino80 physically occupies promoter regions to affect the expression of invasion-associated genes. Last, Western blotting analyses and immunofluorescence staining revealed that the content of INO80 was reduced in RM patients compared to in healthy controls. This study indicates that INO80 has a specific regulatory effect on the viability, migration and invasion of trophoblast cells. Combined with its regulation of the expression of invasion-associated genes, it has been proposed that epigenetic regulation plays an important role in the occurrence of RM, potentially informing RM therapeutic strategies.

Keywords: INO80; invasive; recurrent miscarriage; trophoblast.


Conflict of interest statement

The authors confirm that there are no conflicts of interest.

Figures

FIGURE 1
FIGURE 1
Ino80 was an essential gene required for early mouse embryonic development. (A) The mouse mutation strategy used in our study. (B) Representative images of uterus isolated from ± Ino80 mouse intercross breeding. Left image: numbers refer to individually implanted embryos. Embryos indicated by the red arrow were smaller and the genotyping revealed that they were Ino80−/−. Right images: isolated Ino80+/+ and Ino80−/− embryos at E8.5 and E10.5 showing defective morphology in Ino80−/− embryos. KO knockout, E embryonic day. (C) Representative images to show haematoxylin and eosin (HE) staining of Ino80+/+ and Ino80−/− embryos at E8.5. Scale bar = 2 mm
FIGURE 2
FIGURE 2
Ino80 was required for trophoblast cell viability. (A) Ino80 mRNA expression 3 d after Ino80 silencing. shIno80‐1 and shIno80‐3 represent two different shRNAs against Ino80. shNT represents non‐targeting shRNA control. Values were plotted as mean ± SEM from 3 independent experiments. P value was calculated by Student's t test. **P < 0.01. (B) Growth curve of HTR8/SVneo cells transfected with one of the above‐mentioned three vectors and incubated for 72 h. Counted every 24 h. Values were plotted as mean ± SEM from 3 independent experiments. P value was calculated by Student's t test. *P < 0.05, **P < 0.01. (C) Representative images to show plate clone formation assay of HTR8/SVneo cells transfected with one of the above‐mentioned three vectors and harvested after 14 d. (D) The number of clone formation was counted. Values were plotted as mean ± SEM from 3 independent experiments. P value was calculated by Student's t test. **P < 0.01
FIGURE 3
FIGURE 3
Ino80 was required for trophoblast migration and invasion. (A) Representative images to show scratch‐wound assay. Confluent HTR8/SVneo monolayers were transfected with either shIno80‐1, shIno80‐3 or shNT and subjected to scratch‐wound assay 3 d after infection. Images were taken 0, 12 and 24 h after assay (white lines indicate wound edge). Scale bar = 100 μm. (B) Quantitative analysis of migration distance. The mean distance was calculated from average of 6 microscope fields from 3 independent experiments. Values were plotted as mean ± SEM. P value was calculated by Student's t test. *P < 0.05, **P < 0.01. (C) Representative images to show HTR8/SVneo cells migration in transwell chambers. HTR8/SVneo cells were transfected with either shIno80‐1, shIno80‐3 or shNT, respectively. Scale bar = 200 μm. (D) Quantitative analysis of the number of migrated cells. Migrated cells were quantified by the average of 5 randomly selected regions per experiment, and from 3 independent experiments. Values were plotted as mean ± SEM. P value was calculated by Student's t test. *P < .05. (E) Representative images to show HTR8/SVneo cells invasion in transwell chambers, which were pre‐coated with extracellular matrix proteins. The HTR8/SVneo cells were transfected with either shIno80‐1, shIno80‐3 or shNT, respectively. Scale bar = 200 μm. (F) Quantitative analysis of the number of invasion cells. Invaded cells were quantified by the average of 5 randomly selected regions per experiment, and from 3 independent experiments. Values were plotted as mean ± SEM. P value was calculated by Student's t test. *P < 0.05, **P < 0.01
FIGURE 4
FIGURE 4
Ino80 regulated the expression of invasion‐related genes. (A) Volcano plot to show gene expression changes on Ino80 silencing in HTR8/SVneo cells. Cells were collected 3 d after Ino80 silencing and total RNA was prepared for RNA‐Seq. (B) Expressions of SPARC, L1CAM, LAMC2, PLAU, S100A4 and CXCR4 were determined by real‐time PCR in HTR8/SVneo cells transfected with either shIno80‐1, shIno80‐3 or shNT, respectively. Values were plotted as mean ± SEM from 3 independent experiments. P value was calculated by Student's t test. *P < 0.05, **P < 0.01. (C) Gene ontology analysis and KEGG analysis of genes down‐regulated on Ino80 depletion. Selected 6 categories are shown. (D) Gene set enrichment analysis (GSEA) showing that Ino80 silencing repressed genes were enriched for genes that were low expressed in villus tissues of URM. (E) GSEA showing that Ino80 silencing‐repressed genes were enriched for genes that were low expressed in trophoblasts after GATA3 knock‐down. (F) Expressions of Ino80, MMP2, TIMP1 and TIMP2 were determined by real‐time PCR in HTR8/SVneo cells transfected with either shIno80‐1, shIno80‐3 or shNT, respectively. Values were plotted as mean ± SEM from 3 independent experiments. P value was calculated by Student's t test. *P < 0.05, **P < 0.01, ***P < 0.001
FIGURE 5
FIGURE 5
Ino80 occupied genomic regions near invasion‐associated genes. (A, B) Ino80 peak distribution in the genome. (C) Venn diagram to show the overlaps between Ino80 chromatin immunoprecipitation (ChIP) signal and Ino80 knock‐down‐repressed genes.(D) Genome tracks displaying Ino80 occupancy near selected invasion‐related genes, MMP2, et al, in HTR8/Svneo cells. (E) ChIP‐qPCR showing the enrichment of Ino80 on the chromatin of selected invasion‐related genes. One pair of positive primers and a pair of negative primers were designed near TSS to verify binding, respectively. ChIP‐qPCR data are the average of three biological replicates. Values were plotted as mean ± SEM. P value was calculated by Student's t test. *P < 0.05; **P < 0.01; ***P < 0.001
FIGURE 6
FIGURE 6
INO80 was decreased in chorionic villous tissues of recurrent miscarriage patients. (A) The INO80 protein levels in first‐trimester villous tissues from the HC and RM groups were determined by Western blotting. (B) Quantitative analysis of Western blots. Expression level was normalized by ACTB; n = 15. Values were plotted as mean ± SEM; P value was calculated by Student's t test. *P < 0.05. (C) Representative immunofluorescence images of INO80 in first‐trimester villous sections of RM and HC samples. Red indicates fluorescence signals specific to anti‐INO80 antibodies, and blue indicates nuclei. Scale bar = 25 μm. (D) The number of INO80 + cells was calculated, respectively. Then, the percentage of INO80 + cells normalized to the number of nuclei in the villous tissue of RM and HC samples was assessed; n = 15. Values were plotted as mean ± SEM; P value was calculated by Student's t test. *P < 0.05

Similar articles

Cited by

References

    1. Norwitz ER, Schust DJ, Fisher SJ. Implantation and the survival of early pregnancy. N Engl J Med. 2001;345(19):1400‐1408. - PubMed
    1. Dwi Putra SE, Reichetzeder C, Meixner M, Liere K, Slowinski T, Hocher B. DNA methylation of the glucocorticoid receptor gene promoter in the placenta is associated with blood pressure regulation in human pregnancy. J Hypertens. 2017;35(11):2276‐2286. - PubMed
    1. Yu M, Du G, Xu Q, et al. Integrated analysis of DNA methylome and transcriptome identified CREB5 as a novel risk gene contributing to recurrent pregnancy loss. EBioMedicine. 2018;35:334‐344. - PMC - PubMed
    1. Practice Committee of the American Society for Reproductive M . Evaluation and treatment of recurrent pregnancy loss: a committee opinion. Fertil Steril. 2012;98(5):1103‐1111. - PubMed
    1. El Hachem H, Crepaux V, May‐Panloup P, Descamps P, Legendre G, Bouet PE. Recurrent pregnancy loss: current perspectives. Int J Womens Health. 2017;9:331‐345. - PMC - PubMed

Publication types

MeSH terms

Substances

LinkOut - more resources