

Psoriatic skin inflammation is promoted by c-Jun/AP-1-dependent CCL2 and IL-23 expression in dendritic cells
- PMID: 33724710
- PMCID: PMC8033525
- DOI: 10.15252/emmm.202012409
Psoriatic skin inflammation is promoted by c-Jun/AP-1-dependent CCL2 and IL-23 expression in dendritic cells
Abstract
Toll-like receptor (TLR) stimulation induces innate immune responses involved in many inflammatory disorders including psoriasis. Although activation of the AP-1 transcription factor complex is common in TLR signaling, the specific involvement and induced targets remain poorly understood. Here, we investigated the role of c-Jun/AP-1 protein in skin inflammation following TLR7 activation using human psoriatic skin, dendritic cells (DC), and genetically engineered mouse models. We show that c-Jun regulates CCL2 production in DCs leading to impaired recruitment of plasmacytoid DCs to inflamed skin after treatment with the TLR7/8 agonist Imiquimod. Furthermore, deletion of c-Jun in DCs or chemical blockade of JNK/c-Jun signaling ameliorates psoriasis-like skin inflammation by reducing IL-23 production in DCs. Importantly, the control of IL-23 and CCL2 by c-Jun is most pronounced in murine type-2 DCs. CCL2 and IL-23 expression co-localize with c-Jun in type-2/inflammatory DCs in human psoriatic skin and JNK-AP-1 inhibition reduces the expression of these targets in TLR7/8-stimulated human DCs. Therefore, c-Jun/AP-1 is a central driver of TLR7-induced immune responses by DCs and JNK/c-Jun a potential therapeutic target in psoriasis.
Keywords: TLR7; c-Jun; dendritic cells; psoriasis; targeted therapy.
© 2021 The Authors. Published under the terms of the CC BY 4.0 license.
Conflict of interest statement
The authors declare that they have no conflict of interest.
Figures
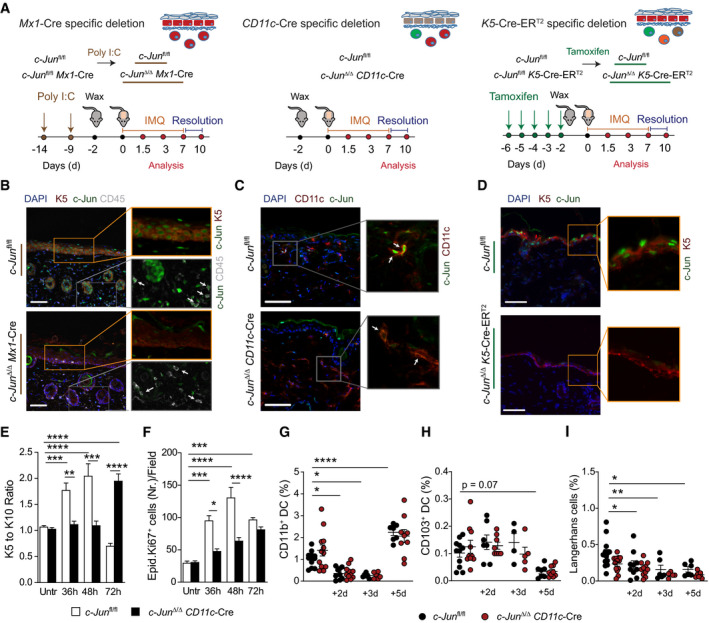
- A
Graphical timeline of IMQ treatment for the different Cre‐Lines. Mice received poly I:C (Mx1‐Cre) or Tamoxifen (K5‐Cre‐ERT2) for cell‐type specific deletion of c‐Jun and were waxed 2 days before start of IMQ treatment. IMQ was applied daily on the back skin and mice were taken for analysis after 1.5, 3, or 7 days after the first IMQ application, which corresponds to an IMQ treatment of 1, 3 or 7 times, respectively. After 7 days of IMQ application, mice were left untreated for another 3 days to study the resolution of IMQ‐induced skin inflammation. Controls (c‐Junfl /fl) were treated equally to Mx‐1 or K5‐Cre‐ERT2 mice in all experiments, which is indicated by a color code (bronze = poly I:C and green = Tamoxifen) here and for all Figures henceforth.
- B–D
Validation of the deletion efficiency of c‐Jun in the Mx1‐Cre, the CD11c‐Cre and K5‐Cre‐ERT2 mouse model. Immunofluorescence of c‐Jun (green), K5 (red) and CD45 (white) (B), of c‐Jun (green) and CD11c (red) (C) and of c‐Jun (green) and K5 (red) (D) was performed in back skin from the indicated genotypes. DAPI was used to counterstain. Arrows indicate CD45+ (B) or CD11c+ skin cells (C). Magnification: 25× (B), 40× (C), 40× (D). Scale Bar: 50 µm.
- E, F
Ratio of K5 to K10 positive areas (E), and number of Ki‐67+ cells (F) in epidermis of indicated mice was analyzed by immunofluorescence performed as described in Appendix Fig S1A and B. Three randomly chosen fields per section were analyzed for each sample (n = 6–10 (E), n = 5–12 (F); 2–4 independent experiments)
- G–I
Flow cytometry of DC subsets in total skin of indicated mice after 2, 3 and 5d of daily IMQ treatment. CD11b+ DC cells were defined as MHCII+CD172+CD11b+CD64− (G), CD103+ DC as MHCII+XCR1+CD103+CD64− (H) and Langerhans cells as MHCII+CD172+CD207+ CD64− (I) among live, single, CD45+ cells. Graphs show DC subsets as % of live, single cells (n = 6–12 (G), n = 4–11 (H), n = 5–13 (I); 2–4 independent experiments).
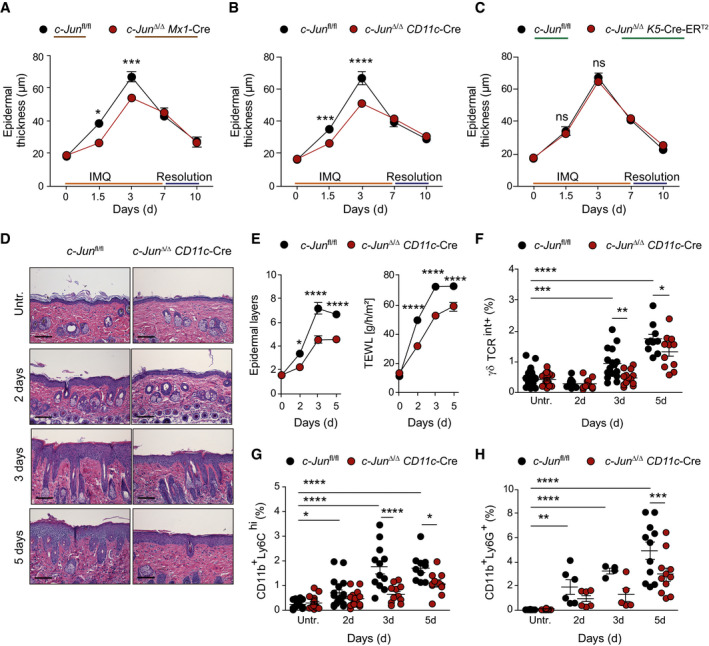
- A–C
Epidermal thickness of the back skin was analyzed at the indicated time points in c‐Jun Δ/Δ Mx1‐Cre (A), c‐Jun Δ/Δ CD11c‐Cre (B) and c‐Jun Δ/Δ K5‐Cre‐ERT2 mice (C) on hematoxylin and eosin (H&E) stained sections (n = 5–21 (A), n = 6–29 (B), n = 5–18 (C); ≥ 2 independent experiments).
- D
H&E stained sections of back skin from indicated mice treated with IMQ for 2, 3, or 5 days. Bright‐field images, Magnification: 20×, Scale bar: 100 µm.
- E
Layers of epidermis (left) and Trans‐epidermal water loss (TEWL) (right) were analyzed in the back skin of indicated mice (Left: n = 8–14, right: n = 6–14; ≥ 2 independent experiments).
- F–H
Flow cytometry of total back skin after 2, 3, and 5 days of IMQ treatment. Analyzed were dermal γδ T cells (γδ TCRint+) (F), monocytes (CD11b+Ly6Chi) (G), and neutrophils (CD11b+Ly6G+) (H). Graphs show immune cells as % of live, single cells (n = 10–28 (F), n = 10–21 (G), n = 4–25 (H); ≥ 2 independent experiments).
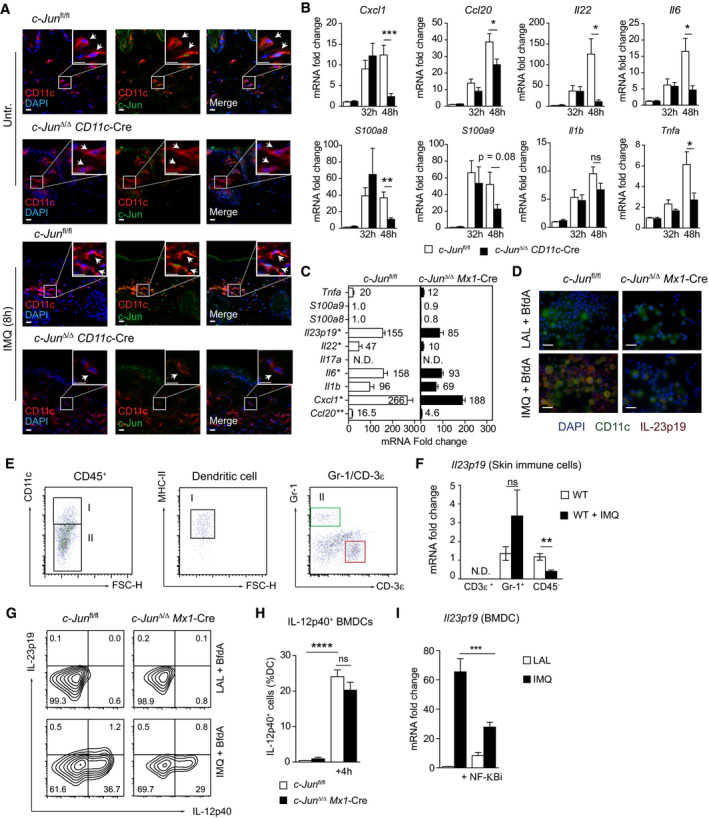
Immunofluorescence of c‐Jun (green), CD11c (red) and DAPI in mouse back skin of indicated mice treated with IMQ for 8 h. Insets give an enlarged view of the framed area. Scale bar: 10 µm, Magnification: 40×.
qRT–PCR detection of chemokines Cxcl1, Ccl20, antimicrobial proteins S100a8, S100a9 and the pro‐inflammatory cytokines Tnfa, Il22, Il6 and Il1b in total RNA isolated from the back skin of indicated mice treated with IMQ for 32 or 48 h (n = 9–20; 3–6 experiments).
qRT–PCR mRNA expression analysis of indicated cytokines in BMDCs. Bar graph shows fold change of targets in IMQ (4 h) stimulated BMDCs relative to LAL. Asterisk shows significance between the genotypes in IMQ‐treated samples (n = 3–7; 2–3 independent experiments).
Immunofluorescence of CD11c (green), IL‐23p19 (red) and DAPI in indicated BMDCs stimulated with IMQ for 5 h in the presence of Brefeldin A. Scale bar: 25 µm, Magnification: 60×.
Gating strategy to sort DCs (CD45+CD11c+ MHCII+), T cells (CD3ε+), granulocytes (Gr‐1+) and non‐immune cells (CD45−) from back skin treated with IMQ for 8 h.
qRT–PCR detection of Il23p19 mRNA expression levels in CD3ε +, Gr‐1+ and CD45− cells sorted from back skin as described in (E) (n = 4–6, 3 independent experiments).
IL‐23p19 and IL‐12p40 expression in BMDCs was analyzed by intracellular flow cytometry. BMDCs were stimulated with IMQ for 4 h in the presence of Brefeldin A. Representative plots shown are pregated on live, single, CD45+ and CD11c+ cells.
Bar graph shows % of live, single, CD45+, CD11c+ cells (% DCs) expressing IL12‐p40 (n = 7–10; 3 independent experiments).
qRT–PCR detection of Il23p19 mRNA expression in BMDCs pretreated with MG‐132 (NF‐κBi, 20 µM) for 1 h and stimulated with IMQ for 4 h (n = 5–6; 2 independent experiments).
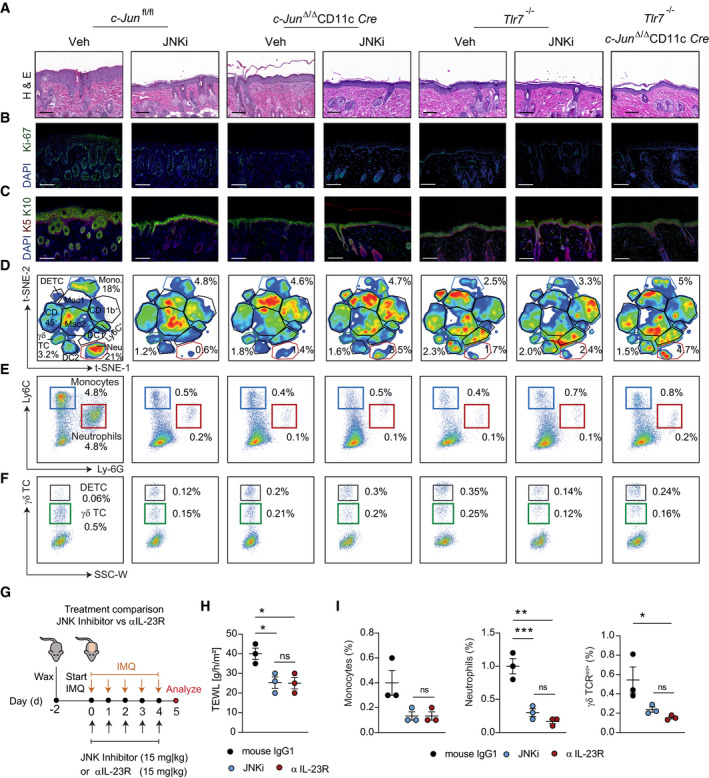
- A–C
Back skin of c‐Jun fl/fl, c‐Jun Δ/Δ CD11c‐Cre, Tlr7 −/− and Tlr7 −/− c‐Jun Δ/Δ CD11c‐Cre mice was treated with IMQ and JNKi or vehicle for 5 days. Shown are representative H&E stained sections (Bright‐field images, Magnification: 20×, Scale bar: 100 µm) (A), immunofluorescence staining’s of Ki‐67 (green) and DAPI (Scale bar: 100 µm, Magnification: 20×) (B) and of K5 (red), K10 (green) and DAPI (Scale bar: 100 µm, Magnification: 20×) (C) in murine back skin. For quantification 2–3 randomly chosen fields per section were counted.
- D–F
Flow cytometric analysis of cell suspension from back skin of indicated mice and treatment. t‐SNE‐ plots (D) show the cutaneous immune cell phenotype. Populations defined by t‐SNE algorithm were confirmed by conventional gating as described in Appendix Fig S7A and representative plots are shown in (E) for Monocytes and Neutrophils and in (F) for γδ T cells and dendritic epidermal T cells (DETC). Numbers adjacent to marked areas indicate percentage of cell population among CD45+ cells (D) and live, single cells (E, F). Representative plots shown are pregated on live, single, CD45+ (D) and CD11b+ (E) or CD11b− cells (F).
- G
Experimental design for blocking IL‐23 signaling in the IMQ‐induced skin inflammation model. Back skin of wild‐type mice was treated daily with IMQ and anti‐IL23R antibody (15 mg/kg, i.p.) or isotype control for 5 consecutive days. To compare JNK Inhibitor (15 mg/kg, i.p.) was given (n = 3)
- H
Trans‐epidermal water loss (TEWL) was analyzed in the back skin at the end of treatment.
- I
Flow cytometry of total back skin after 5 days of IMQ treatment. Analyzed were dermal γδ T cells (γδ TCRint+), Monocytes (CD11b+Ly6Chi), and Neutrophils (CD11b+Ly6G+). Graphs show immune cells as % of live, single cells.
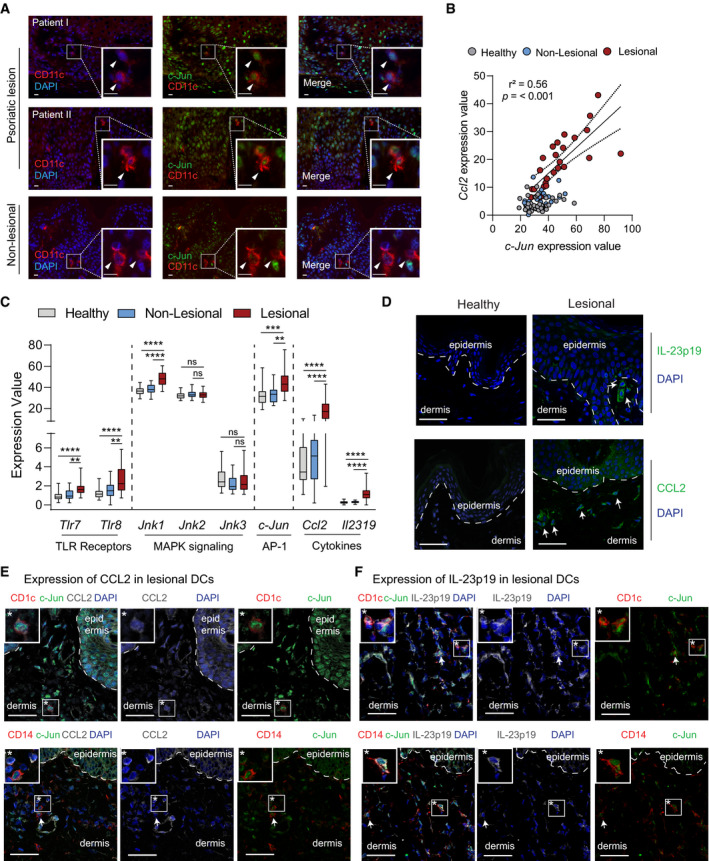
- A
Immunofluorescence of c‐Jun (green), CD11c (red) and DAPI in psoriatic lesions from two patients and in non‐lesional skin from one patient. Insets give an enlarged view of the framed area. Arrows indicate CD11c+ skin cells. Scale bar: 10 µm, Magnification: 40x.
- B
Linear regression analysis between c‐Jun and Ccl2 in healthy (n = 38), non‐lesional (n = 27) and lesional (n = 28) skin. Expression values were obtained from the GEO Data Set [GSE121212]. A Pearson’s correlation test was performed and r 2 and P values are indicated in the plot.
- C
Expression values of Tlr7, Tlr8, Jnk1, Jnk2, Jnk3, c‐Jun, Ccl2 and Il23p19 in healthy (n = 38), non‐lesional (n = 27) and lesional (n = 28) skin. Expression values were obtained from the GEO Data Set [GSE121212]. Box and whiskers plot: Central band shows median, box extends from the 25th to 75th percentiles and whiskers go down to the smallest (min) and up to the largest (max) value.
- D
Representative immunofluorescence of CCL2 or IL‐23p19 (green) and DAPI in healthy and lesional skin. Arrows indicate IL‐23p19+ (upper panels) or CCL2+ dermal cells (lower panels). Magnification: 40x. Scale bar: 50 µm (n = 2 patient samples).
- E, F
Representative immunofluorescence of CCL2 (E) or IL‐23p19 (F) (white), c‐Jun (green) and the DC markers CD1c or CD14 (red) was performed on lesional psoriatic skin. DAPI was used to counterstain. Arrows indicate triple‐positive cells and an asterisk highlights a representative one that is shown enlarged in a white‐framed inlet. Magnification: 40×. Scale bar: 50 µm (n = 2 patient samples).
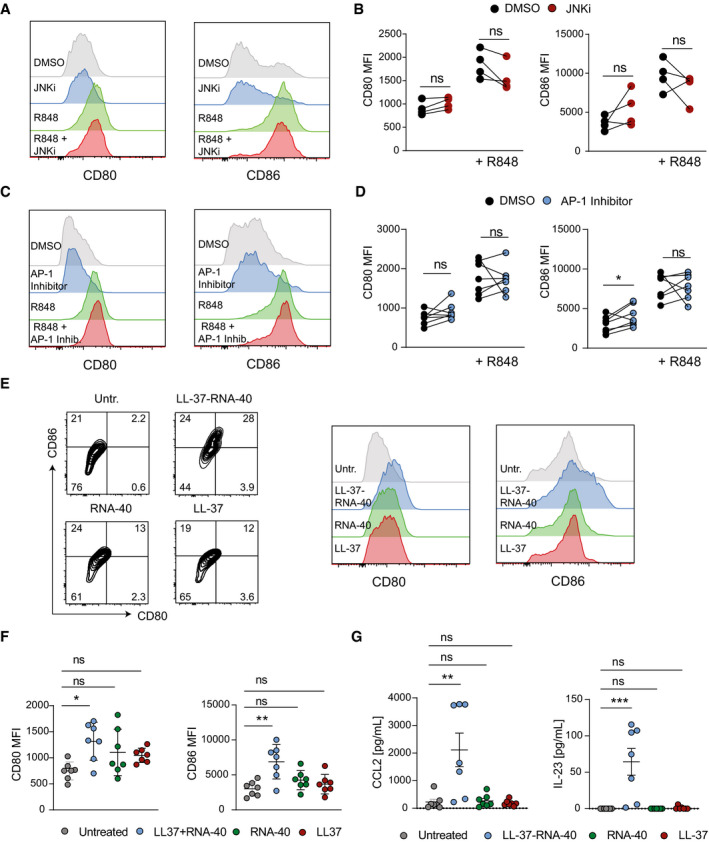
- A–D
Human mo‐DCs were pretreated with DMSO (1:1,000) or JNK Inhibitor (SP600125, 25 µM) (A, B) or AP‐1 Inhibitor (T‐5224, 20 µM) (C, D) for 1 h and stimulated with R848 for 24 h. Gated CD1a+ cells were analyzed for surface expression of CD80 and CD86 by flow cytometry. Shown are representative histograms (A, C) and mean fluorescence intensity (MFI) (B, D) (n = 4 (B); representative result from 2 independent experiments is shown, n = 7 (D); 2 independent experiments).
- E–G
Human mo‐DCs were stimulated with LL‐37‐RNA‐40 complex or LL‐37 or RNA‐40 for 24 h. Representative flow cytometry plots and histograms are shown in (E) and mean fluorescence intensity (MFI) of CD80 and C86 is shown in (F). Expression of CCL2 and IL‐23 was analyzed by ELISA (G) (n = 7, 2 independent experiments).
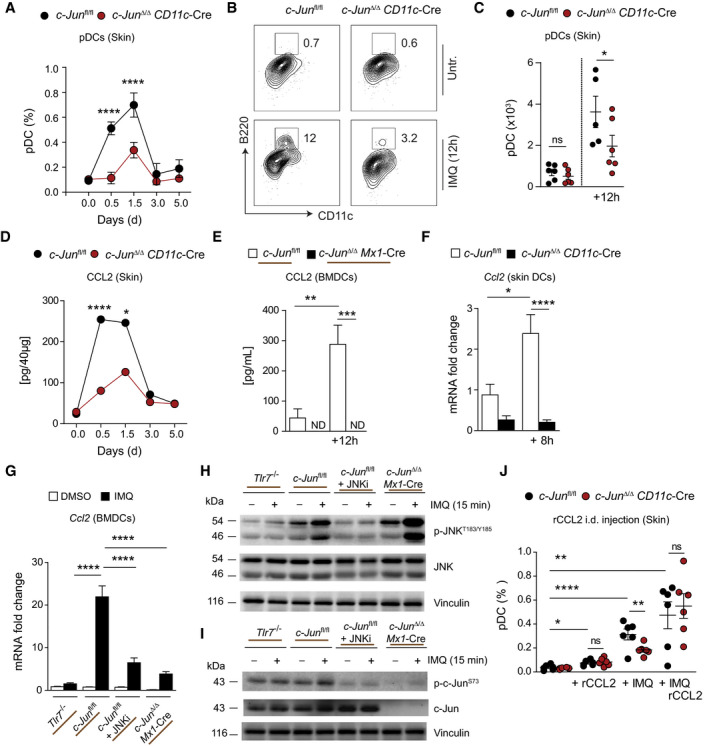
- A
Skin infiltration of pDCs (BST‐2+ B220+ CD11cint CD11b−) was analyzed by flow cytometry. Graph shows immune cells as % of live, single cells (n = 2–15; 1–3 independent experiments).
- B
Representative flow cytometry plots of skin pDCs 12 h after IMQ treatment.
- C
Total cell number of skin pDCs defined as in (B) is shown (n = 5–6: 2 independent experiments)
- D
ELISA for CCL2 performed on total back skin treated with IMQ (n = 5–14; 2 independent experiments).
- E
BMDCs generated from c‐Jun fl/fl or c‐Jun Δ/Δ Mx1‐Cre BM were stimulated with IMQ for 12 h. CCL2 protein was quantified by ELISA (n = 7–10; 3 independent experiments).
- F
qRT–PCR detection of Ccl2 mRNA in CD11c+MHCII+ cells sorted from IMQ‐treated back skin (8 h) (n = 5–12; 3 experiments).
- G
BMDCs were generated from Tlr7 −/−, c‐Jun fl/fl, or c‐Jun Δ/Δ Mx1‐Cre BM and stimulated with IMQ for 4 h and/or pretreated with SP600125 (JNKi, 25 µM) for 1 h. Ccl2 mRNA was quantified by qRT–PCR (n = 4–18; 2–4 experiments).
- H, I
Western blot analysis of Phospho‐ or total JNK and c‐Jun in BMDCs of indicated genotype pretreated with DMSO (1: 1,000) or SP600125 (JNKi, 25 µM) for 1 h and stimulated with IMQ (5 µg/ml) for 15 min.
- J
Flow cytometry of back skin 12 h after intradermal (i.d.) injection of 1 µg rCCL2 and/or IMQ treatment. Analyzed were pDCs (BST‐2+B220+CD11cintCD11b−) shown as % of live, single cells (n = 6; 2 independent experiments).
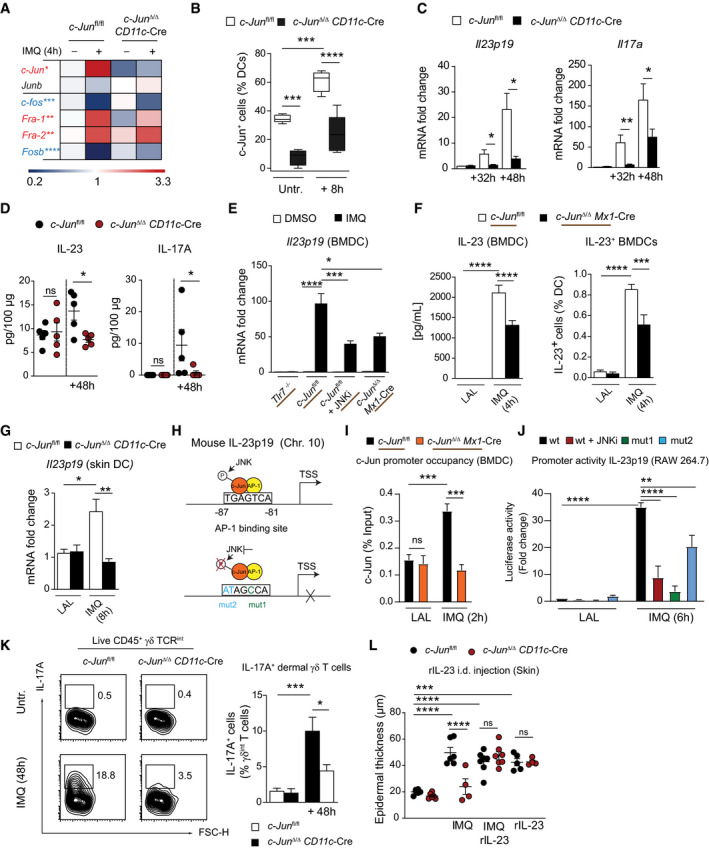
Heat map visualization of AP‐1 family member expression in DCs sorted from back skin of indicated mice after 4 h IMQ stimulation as quantified by qRT–PCR. Color code (red = up, blue = down‐regulation) shows fold change of Ap‐1 mRNA to untreated c‐Jun fl/fl DC control. Asterisk shows significant differences in IMQ activated to control c‐Jun fl/fl DCs (n = 4–14; 2–4 independent experiments).
Graph shows the percentage of c‐Jun positive skin DCs quantified by immunofluorescence performed as described in Fig EV2 (A) (n = 5, 3 experiments).
qRT–PCR detection of Il23p19 and Il17a in total RNA isolated from the back skin of indicated mice treated with IMQ for 32 or 48 h (n = 10–21; 3–6 experiments).
IL‐23 and IL‐17A protein was quantified by Luminex multiplex assay in cutaneous lysates of indicated mice after IMQ treatment (48 h) (n = 5; 2 independent experiments).
qRT–PCR detection of Il23p19 mRNA expression levels in BMDCs of indicated genotype stimulated with IMQ for 4 h and/or pretreated with JNKi (SP600125, 25 µM, 1 h) (n = 4–14; 2–5 independent experiments).
IL‐23 protein was quantified by ELISA (1 × 10⁶ BMDCs/well) and by intracellular flow cytometry (IL‐23p19+p40+ cells among live, single, CD45+, CD11c+ cells) in c‐Jun fl/fl and c‐Jun Δ/Δ Mx1‐Cre BMDCs stimulated with IMQ for 4 h (Left: n = 10–13; Right: n = 9–10; ≥ 3 independent experiments).
qRT–PCR detection of Il23p19 mRNA expression levels in CD11c+MHCII+ cells sorted from IMQ (8 h)‐treated back skin of indicated mice (n = 5–12; 3 experiments).
Genomic location and sequence of a putative AP‐1 binding site in the mouse promoter of IL‐23p19. Blockade of c‐Jun/AP‐1 TF binding by inhibition of phosphorylation (JNKi, red), or mutation of the binding sequence (mut 1 = T ‐> C; green | mut 2 = TG ‐> AT; blue) reduces IL‐23p19 promoter activity (see Fig 4J).
c‐Jun chromatin immunoprecipitation of c‐Jun fl/fl and c‐Jun Δ/Δ Mx1‐Cre BMDCs stimulated with IMQ for 2 h (n = 4–6; 3 independent experiments).
Luciferase activity was quantified in lysates of RAW 264.7 cells transfected with pGL3 basic vector harboring wild‐type (wt) or mutated (mut1 or 2) IL‐23p19 promoter. Transfected cells were pretreated with JNKi (SP600125, 25 µM, 1 h) and stimulated with IMQ (6 h). Results are shown as fold change to pGL‐3‐wt transfected, LAL (Limulus amebocyte lysate)‐treated RAW264.7 cells (n = 4; 2 independent experiments).
IL‐17A production by dermal γδ T cells was analyzed in IMQ‐treated skin (Day 2) of indicated mice by intracellular flow cytometry. Shown are representative plots (left) and a bar graph (right) of IL‐17A+ cells pregated on live, single, CD45+, γδ TCRint+ cells (n = 7–10; 3 independent experiments).
Epidermal thickness of back skin was quantified in H&E stained sections of indicated mice treated with rIL‐23 (i.d., 1 µg) and/or IMQ for two consecutive days (n = 4–7; 3 independent experiments).
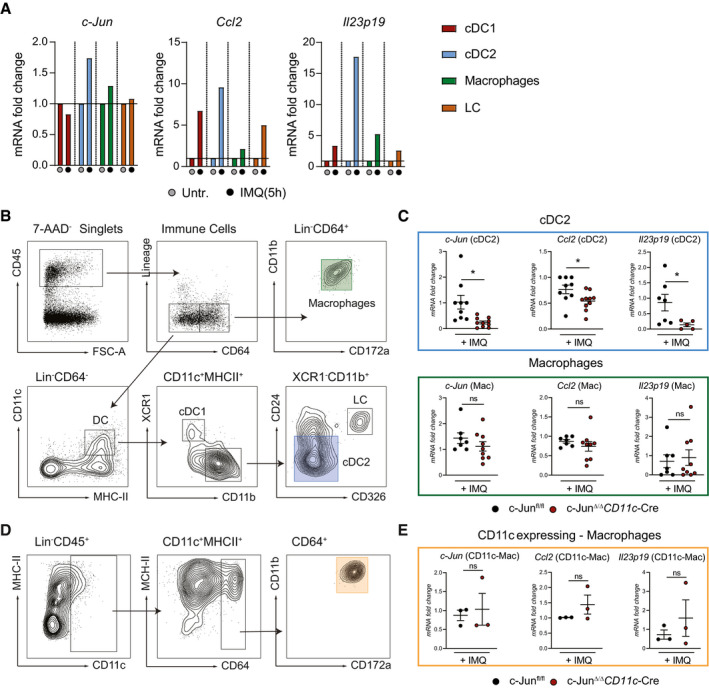
DC subsets (cDC1, cDC2), macrophages (MP), and Langerhans cells (LC) were sorted from IMQ‐treated back skin (5 h). c‐Jun, Ccl2, and Il23p19 mRNA was analyzed by qRT–PCR. Sort strategy is shown in (B) (10 mice were pooled per condition, 1 experiment).
Sort strategy for the separation of MPs (CD45+Lin−CD64+CD172a+CD11b+), and the DC (CD45+Lin−CD64−CD11c+MHCII+) subsets cDC1 (XCR1+CD11b− DC), cDC2 (XCR1−CD11b+CD24−/intCD326−) and LC (XCR1−CD11b+CD24+CD326+) in IMQ‐treated (5 h) murine back skin.
qRT–PCR detection of c‐Jun, Ccl2, and Il23p19 in MPs and cDC2 sorted as described in (B) from indicated mice (MPs: n = 7–9; 3 independent experiments, cDC2: n = 5–10; 2–3 independent experiments and back skin from 2 mice was pooled).
Sort strategy for CD11c expressing MPs (CD45+Lin−CD11cint/lowMHCII+CD64+CD11b+CD172a+) is shown. Murine skin was treated for 5 h with IMQ.
Expression of indicated targets was analyzed by qRT–PCR in cells sorted as described in (D) (n = 3; Back skin from 2 mice was pooled).
- A
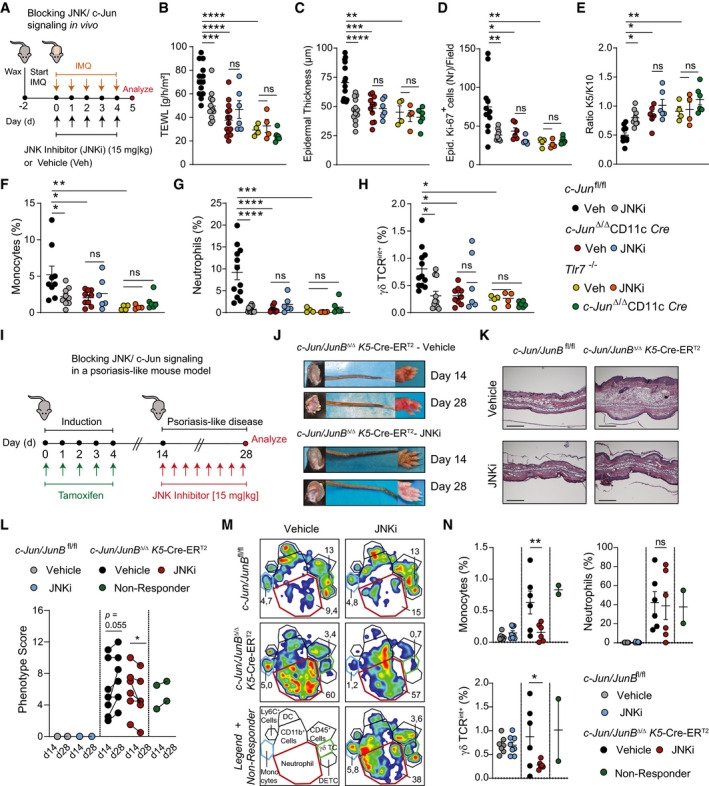
Experimental design for blocking JNK/c‐Jun signaling in the IMQ‐induced skin inflammation model. c‐Jun fl/fl, c‐Jun Δ/Δ CD11c‐Cre, Tlr7 −/−, and Tlr7 −/− c‐Jun Δ/Δ CD11c‐Cre mice were treated with IMQ and JNK inhibitor SP600125 (JNKi, 15 mg/kg, i.p.) or vehicle for 5 consecutive days.
- B–E
After 5 days of treatment TEWL was measured on the back skin (B), epidermal thickness was analyzed on H&E stained sections (C), epidermal Ki‐67+ cells (D) and the ratio of K5 to K10 positive areas (E) were analyzed by immunofluorescence as described in Fig EV3 (B, C) (n = 4–15; ≥ 2 independent experiments).
- F–H
Quantification of immune cell populations as defined in Fig EV3 (E, F). Results are given as percentage of live, single cells (n = 4–12; 2–4 independent experiments).
- I
Experimental design for blocking JNK/c‐Jun signaling in c‐Jun/JunB Δ/Δ K5‐Cre‐ERT2 mice. Psoriasis‐like disease was induced by injection of Tamoxifen (i.p., 5 days). Treatment with JNK Inhibitor (15 mg/kg, every other day, i.p.) started on day 14 for 2 weeks.
- J
Representative images of ear, tail and paw of c‐Jun/JunB Δ/Δ K5‐Cre‐ERT2 at the start (Day 14) and end (Day 28) of treatment with JNK Inhibitor or vehicle.
- K
H&E stained sections of mouse ear from indicated mice. Bright‐field images, Scale bar: 250 µm, Magnification: 10×.
- L
Psoriasis‐like phenotype was scored from 0 to 4 for ear, tail, paw and snout. Shown is the cumulative score at therapy start (Day 14) and end (Day 28). Non‐responders are c‐Jun/JunB Δ/Δ K5‐Cre‐ERT2 mice treated with JNK Inhibitor, which showed disease‐progression (n = 2–9, 2 independent experiments).
- M
Representative t‐SNE‐ plots (n = 2–3) show the cutaneous immune cell phenotype at therapy end (Day 28). Numbers adjacent to gates give cell populations frequency among live, single, CD45+ cells. t‐SNE Legend‐Plot labels the populations defined by t‐SNE‐ algorithm.
- N
Dermal γδ T cells (γδ TCRint+), monocytes (CD11b+Ly6Chi), and neutrophils (CD11b+Ly6G+) were analyzed by flow cytometry in mouse ear at the end of treatment (Day 28). Graphs show immune cells as % of live, single cells (n = 2–8, 2 independent experiments).
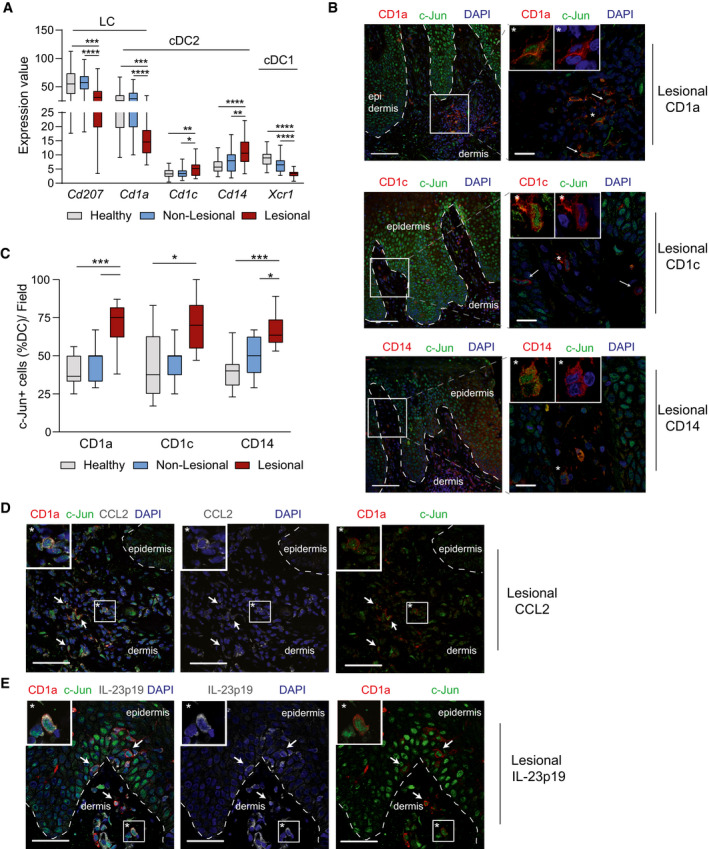
- A
Gene expression values of Cd207, Cd1a, Cd1c, Cd14, Xcr1 in healthy (n = 38), non‐lesional (n = 27), and lesional (n = 28) skin. Expression values were obtained from the GEO Data Set [GSE121212]. Box and whiskers plot: Central band shows median, box extends from the 25th to 75th percentiles, and whiskers go down to the smallest (min) and up to the largest (max) value.
- B
Immunofluorescence of c‐Jun (green), CD1a or CD1c or CD14 (red) and DAPI in psoriatic lesions. Shown is a representative image (Magnification: 25×, Scale Bar: 100µm) with an Inset (Magnification: 63×, Scale Bar: 20 µm, Deconvoluted). Arrows indicate c‐Jun+ DCs. Asterisk highlights a DC with prominent c‐Jun expression as shown enlarged in 2 white‐framed windows (DC Marker (red) + c‐Jun (green, left) or DAPI (blue, right)).
- C
Quantification of c‐Jun+ DCs (CD1a, CD1c, or CD14) in psoriatic lesions as shown in (B). Four randomly chosen fields on one section were analyzed for each sample (n = 2 patient samples/condition). Box and whiskers plot: Central band shows median, box extends from the 25th to 75th percentiles, and whiskers go down to the smallest (min) and up to the largest (max) value.
- D, E
Representative immunofluorescence of c‐Jun (green), CD1a (red), CCL2 (D), or IL‐23p19 (E) (white) and DAPI in psoriatic lesions. Arrows indicate triple‐positive cells and an asterisk highlights a representative one that is shown enlarged in a white‐framed inlet. Magnification: 40x. Scale bar: 50 µm (n = 2 patient samples).
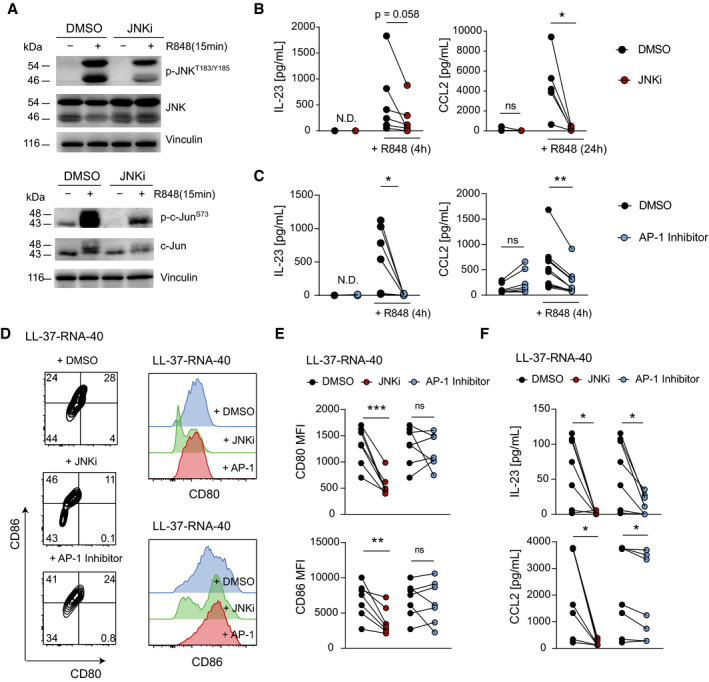
- A
Western blot analyses of Phospho‐ or total JNK and c‐Jun in human mo‐DCs pretreated with DMSO (1: 1,000) or SP600125 (JNKi, 25 µM) for 1 h and stimulated with R848 (10 µg/mL) for 15 min.
- B, C
Human mo‐DCs pretreated with JNKi (SP600125, 25 µM) (B) or AP‐1 Inhibitor (T‐5224, 20 µM) (C) for 1 h were stimulated with R848 (10 µg/ml). CCL2 and IL‐23 were analyzed by ELISA (n = 5–11; 2–3 independent experiments).
- D
Representative flow cytometry plots (left) and histograms (right) of human mo‐DCs stimulated with LL‐37‐RNA‐40 for 24 h are shown. Inhibitors (JNKi; 25 µM or AP‐1 Inhibitor; 20 µM) were given 1 h before stimulation. Plots shown are pregated on live, single, CD1a+ cells.
- E, F
Human mo‐DCs described in (D) were analyzed for mean fluorescence intensity of CD80 or CD86 by flow cytometry (E) and CCL2 or IL‐23 protein by ELISA (F) (n = 7; 2 independent experiments).
References
-
- Behfar S, Hassanshahi G, Nazari A, Khorramdelazad H (2018) A brief look at the role of monocyte chemoattractant protein‐1 (CCL2) in the pathophysiology of psoriasis. Cytokine 110: 226–231 - PubMed
-
- Berndt BE, Zhang M, Chen G‐H, Huffnagle GB, Kao JY (2007) The role of dendritic cells in the development of acute dextran sulfate sodium colitis. J Immunol 179: 6255 - PubMed
-
- Boehncke W‐H, Schön MP (2015) Psoriasis. Lancet 386: 983–994 - PubMed
-
- Bourdely P, Anselmi G, Vaivode K, Ramos RN, Missolo‐Koussou Y, Hidalgo S, Tosselo J, Nuñez N, Richer W, Vincent‐Salomon A et al (2020) Transcriptional and functional analysis of CD1c(+) human dendritic cells identifies a CD163(+) subset priming CD8(+)CD103(+) T cells. Immunity 53: 335–352.e338 - PMC - PubMed
Publication types
MeSH terms
Substances
Associated data
- Actions
Grants and funding
LinkOut - more resources
Full Text Sources
Other Literature Sources
Research Materials
Miscellaneous
