

Time trends of major cancers incidence and mortality in Guangzhou, China 2004-2015: A Joinpoint and Age-Period-Cohort Analysis
- PMID: 33724715
- PMCID: PMC8026941
- DOI: 10.1002/cam4.3744
Time trends of major cancers incidence and mortality in Guangzhou, China 2004-2015: A Joinpoint and Age-Period-Cohort Analysis
Abstract
Background: Cancer is an important focus of public health worldwide. This study aims to provide a comprehensive overview of temporal trends in incidence and mortality of leading cancer in Guangzhou, China from 2004 to 2015.
Methods: Data were collected from the population-based registry in Guangzhou. Age-standardized incidence rate (ASIR) and age-standardized mortality rate (ASMR) were calculated and Joinpoint regression was used for evaluating the average annual percent changes (AAPC) among the entire study period and the estimated annual percent changes (EAPC) in time segments. The effects of age, period, and birth cohort were assessed by the age-period-cohort model.
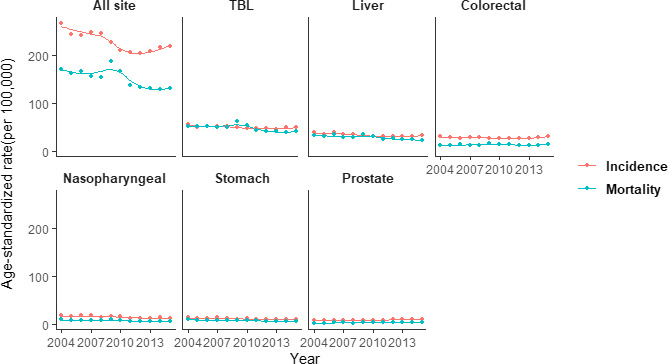
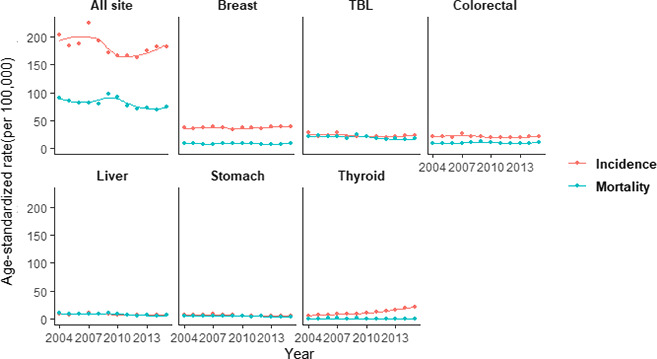
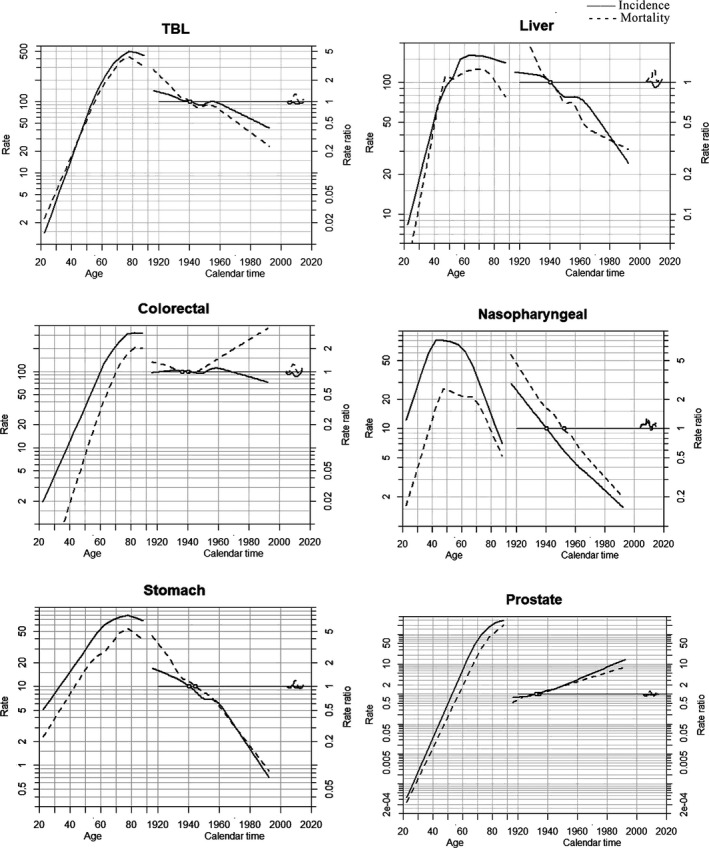
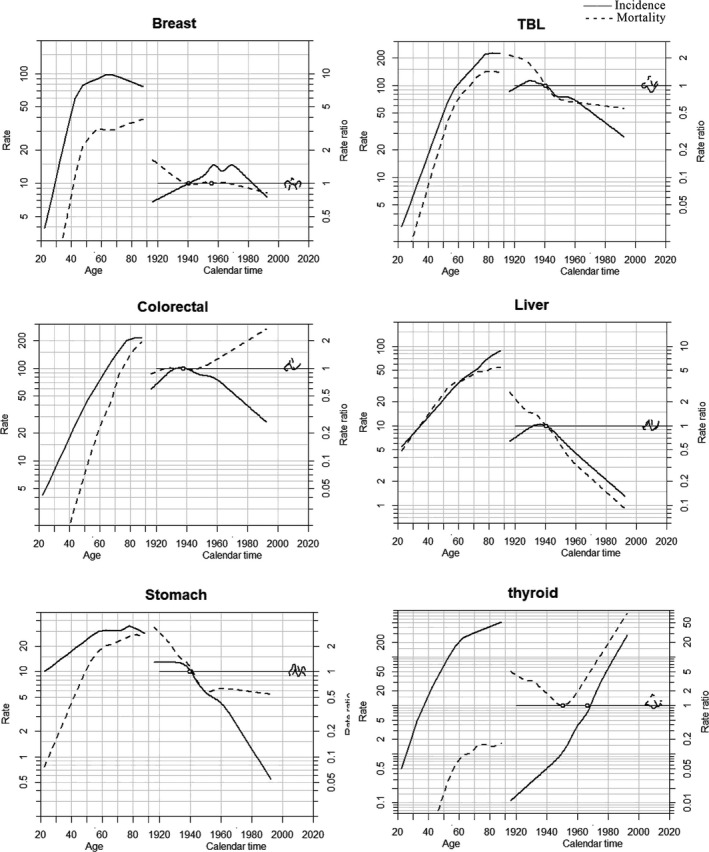
Results: The age-standardized incidence and mortality by the world standard population decreased significantly among males with AAPC of -1.7% (95% CI: -3.0%, 0.2%) and -2.7% (95% CI: -4.3%, -1.1%) for all malignancies during 2004-2015, while among females, the age-standardized incidence had a non-significant reduction with AAPC of -1.3% (95% CI: -2.8%, 0.2%) and the age-standardized mortality demonstrated a remarkable decline (AAPC -2.0%, 95% CI: -3.6%, -0.3%). For males, the most commonly diagnosed cancers were trachea, bronchus, and lung (TBL), liver, colorectal, nasopharyngeal, stomach, and prostate cancer. For females, breast, TBL, colorectal, liver stomach, and thyroid cancer ranked the top. Unfavorable trends were observed in ASIR of colorectal, thyroid, and prostate cancer. APC models yielded different ages, periods, and birth cohort effect patterns by cancer sites.
Conclusions: Cancer burden remained a public health challenge in Guangzhou as the aging population and lifestyles changes, despite declines in incidence and mortality rates in some cancers. Surveillance of cancer trends contributed to valuable insights into cancer prevention and control.
Keywords: Age-Period-Cohort analysis; Guangzhou; incidence; mortality; time trend.
© 2021 The Authors. Cancer Medicine published by John Wiley & Sons Ltd.
Conflict of interest statement
The author declares that there is no conflict of interest.
Figures
Similar articles
-
Temporal Trends in the Incidence and Mortality of Major Reproductive-Related Cancers in Women in Guangzhou From 2010 to 2020: A Joinpoint and Age-Period-Cohort Study.Int J Public Health. 2023 Mar 23;68:1605300. doi: 10.3389/ijph.2023.1605300. eCollection 2023. Int J Public Health. 2023. PMID: 37035104 Free PMC article.
-
Trends in incidence and mortality of tuberculosis in India over past three decades: a joinpoint and age-period-cohort analysis.BMC Pulm Med. 2021 Nov 16;21(1):375. doi: 10.1186/s12890-021-01740-y. BMC Pulm Med. 2021. PMID: 34784911 Free PMC article.
-
Long-Term Trends of Liver Cancer Incidence and Mortality in China 1990-2017: A Joinpoint and Age-Period-Cohort Analysis.Int J Environ Res Public Health. 2019 Aug 12;16(16):2878. doi: 10.3390/ijerph16162878. Int J Environ Res Public Health. 2019. PMID: 31408961 Free PMC article.
-
Progress in cancer mortality, incidence, and survival: a global overview.Eur J Cancer Prev. 2020 Sep;29(5):367-381. doi: 10.1097/CEJ.0000000000000594. Eur J Cancer Prev. 2020. PMID: 32740162 Review.
-
Spatial and temporal variations of childhood cancers: Literature review and contribution of the French national registry.Cancer Med. 2018 Oct;7(10):5299-5314. doi: 10.1002/cam4.1774. Epub 2018 Sep 19. Cancer Med. 2018. PMID: 30230715 Free PMC article. Review.
Cited by
-
Spatial and temporal distribution and evolutionary trend of thyroid cancer incidence in Guangzhou, 2010-2020.Endocrine. 2025 Aug;89(2):484-496. doi: 10.1007/s12020-025-04274-z. Epub 2025 May 19. Endocrine. 2025. PMID: 40389764
-
Exploring Prostate Cancer Incidence Trends and Age Change in Cancer Registration Areas of Jiangsu Province, China, 2009 to 2019.Curr Oncol. 2024 Sep 14;31(9):5516-5527. doi: 10.3390/curroncol31090408. Curr Oncol. 2024. PMID: 39330036 Free PMC article.
-
Temporal Pattern and Age-Period-Cohort Analysis of Breast Cancer Incidence in Iranian Women (2009-2017).Arch Iran Med. 2023 Jun 1;26(6):285-289. doi: 10.34172/aim.2023.44. Arch Iran Med. 2023. PMID: 38310428 Free PMC article.
-
Trend analysis and age-period-cohort effects on morbidity and mortality of liver cancer from 2010 to 2020 in Guangzhou, China.Front Oncol. 2024 May 2;14:1387587. doi: 10.3389/fonc.2024.1387587. eCollection 2024. Front Oncol. 2024. PMID: 38756657 Free PMC article.
-
Temporal Trends in the Incidence and Mortality of Major Reproductive-Related Cancers in Women in Guangzhou From 2010 to 2020: A Joinpoint and Age-Period-Cohort Study.Int J Public Health. 2023 Mar 23;68:1605300. doi: 10.3389/ijph.2023.1605300. eCollection 2023. Int J Public Health. 2023. PMID: 37035104 Free PMC article.
References
-
- Fitzmaurice C, Abate D, Abbasi N, et al. Global, regional, and national cancer incidence, mortality, years of life lost, years lived with disability, and disability‐adjusted life‐years for 29 cancer groups, 1990 to 2017: a systematic analysis for the global burden of disease study. JAMA Oncology. 2019;5(12):1749‐1768. - PMC - PubMed
-
- Wei W, Zeng H, Zheng R, et al. Cancer registration in China and its role in cancer prevention and control. Lancet Oncol. 2020;21(7):e342‐e349. - PubMed
-
- Bray F, Ferlay J, Soerjomataram I, Siegel RL, Torre LA, Jemal A. Global cancer statistics 2018: GLOBOCAN estimates of incidence and mortality worldwide for 36 cancers in 185 countries. CA Cancer J Clin. 2018;68(6):394‐424. - PubMed
-
- Siegel RL, Miller KD, Jemal A. Cancer statistics, 2019. CA Cancer J Clin. 2019;69(1):7‐34. - PubMed
Publication types
MeSH terms
LinkOut - more resources
Full Text Sources
Other Literature Sources
Medical
