. 2021 Apr 20;55(8):5084-5096.
doi: 10.1021/acs.est.0c07384. Epub 2021 Mar 16.

Lifetime Accumulation of Microplastic in Children and Adults

Affiliations

Lifetime Accumulation of Microplastic in Children and Adults

Nur Hazimah Mohamed Nor et al. Environ Sci Technol. .

Abstract

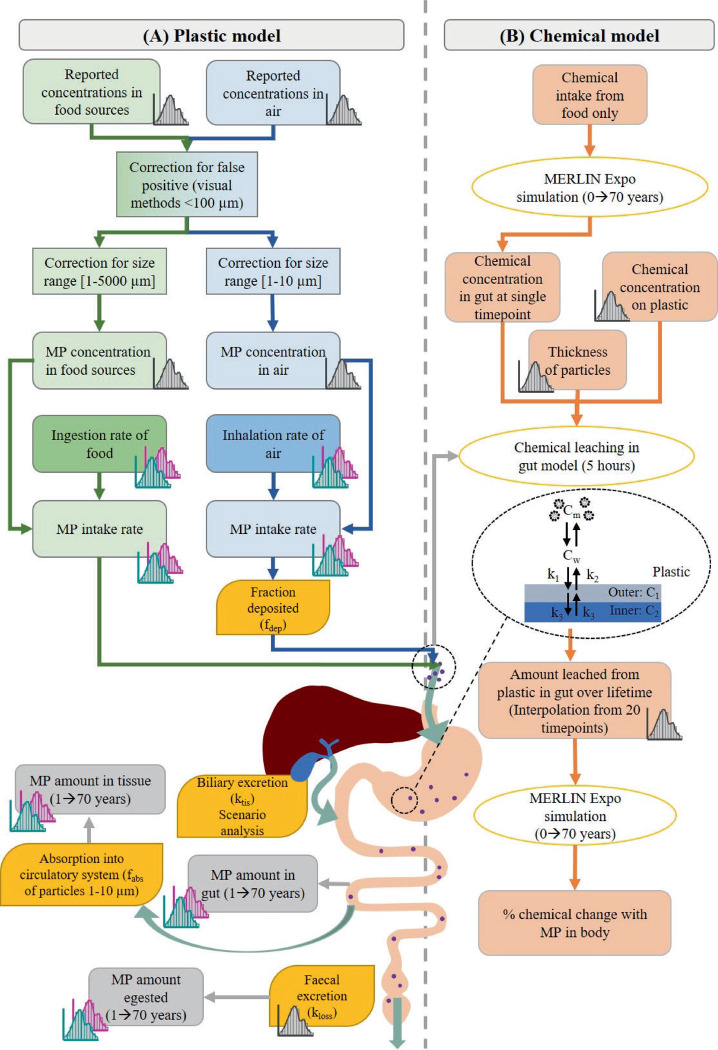
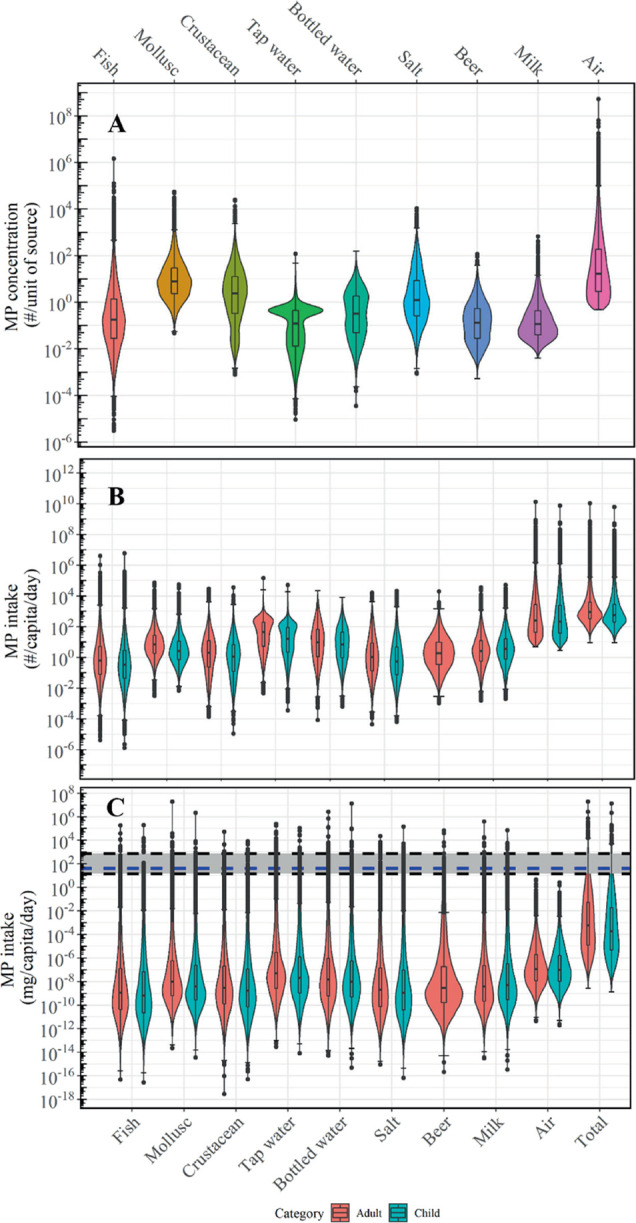
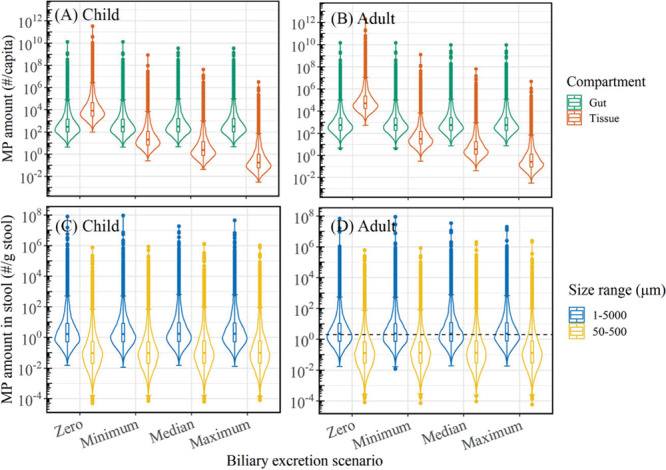
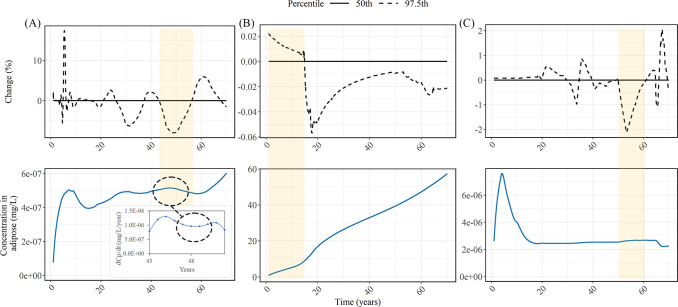
Human exposure to microplastic is recognized as a global problem, but the uncertainty, variability, and lifetime accumulation are unresolved. We provide a probabilistic lifetime exposure model for children and adults, which accounts for intake via eight food types and inhalation, intestinal absorption, biliary excretion, and plastic-associated chemical exposure via a physiologically based pharmacokinetic submodel. The model probabilistically simulates microplastic concentrations in the gut, body tissue, and stool, the latter allowing validation against empirical data. Rescaling methods were used to ensure comparability between microplastic abundance data. Microplastic (1-5000 μm) median intake rates are 553 particles/capita/day (184 ng/capita/day) and 883 particles/capita/day (583 ng/capita/day) for children and adults, respectively. This intake can irreversibly accumulate to 8.32 × 10³ (90% CI, 7.08 × 10²-1.91 × 10⁶) particles/capita or 6.4 (90% CI, 0.1-2.31 × 10³) ng/capita for children until age 18, and up to 5.01 × 10⁴ (90% CI, 5.25 × 10³-9.33 × 10⁶) particles/capita or 40.7 (90% CI, 0.8-9.85 × 10³) ng/capita for adults until age 70 in the body tissue for 1-10 μm particles. Simulated microplastic concentrations in stool agree with empirical data. Chemical absorption from food and ingested microplastic of the nine intake media based on biphasic, reversible, and size-specific sorption kinetics, reveals that the contribution of microplastics to total chemical intake is small. The as-yet-unknown contributions of other food types are discussed in light of future research needs.


Conflict of interest statement

The authors declare no competing financial interest.

Figures

Figure 1
Figure 1
Schematic overview of the workflow for (A) the plastic model and (B) chemical model. (A) Green boxes and arrows indicate MP from food; blue boxes and arrows indicate MP from air. Yellow boxes represent the parameter inputs. Grey boxes and arrows represent the outputs: the MP amount accumulated in gut and tissue and amount egested. (B) Total MP intake calculated from the plastic model (shown at the inlet of the stomach) was used to calculate total chemical leached from MP in the chemical model. Cm is the chemical concentration in gut fluid micelles, CW is the chemical concentration in water in the gut, C1 and C2 are the chemical concentrations in the outer and inner phases of MP, respectively; k1 and k2 are the sorption and desorption rate constants, respectively; k3 is the intrapolymer rate constant. Orange boxes represent the inputs for the chemical model and orange-outlined ovals represent the models used to calculate the chemical distributions and leaching from MP. Histogram symbols represent inputs with distributions. Green histogram: child (1–18 years); pink histogram: adults (19–70 years).
Figure 2
Figure 2
MP concentrations and intake in each source. (A) Violin plots of MP concentration in food (1–5000 μm) and air (1–10 μm). Concentrations are presented as per gram of body wet weight (BWW) for fish and crustacean, per gram of tissue wet weight (TWW) for mollusc, per liter for all liquids, per gram for salt, and per cubic meter for air. (B) Violin plots of MP number intakes (particles/capita/day) and total MP number intake from food and air for an adult and child. (C) Violin plots of MP mass intakes (mg/capita/day) and the total MP mass intake from food and air for an adult and child. Black dashed lines and the shaded gray region (14–714 mg/capita/day) indicates the range of mass intake estimation by WWF,101 and the blue dashed line (40 mg/capita/day) indicates the mass intake of inorganic particles. The box plot is showing the median (middle line) and interquartile range (box length). Note that data are only realistic within the 95% confidence interval (horizontal line on the whiskers of the box plot).
Figure 3
Figure 3
Distribution of MP amounts in the gut and tissue compartment at the end of the simulation for (A) a child (1–18 years) and (B) adult (1–70 years). Scenarios: no biliary excretion (ktis = 0 d–1), minimum (ktis = 0.067 d–1), median (ktis = 0.61 d–1), and maximum (ktis = 8.30 d–1). Distribution of the amount egested in stools at the end of the simulation for (C) a child and (D) adult. Blue violin plots represent the full MP continuum, and yellow violin plots are scaled to the size range of 50–500 μm to compare with MP concentrations in stool from the study by Schwabl et al. (black dashed line). Note that data are only realistic within the 95% confidence interval (horizontal line on the whiskers of box plot).
Figure 4
Figure 4
Percentage change of chemicals in adipose tissues as a result of additional chemical exposure via MPs (top panel) and the initial adipose tissue concentrations from dietary intake of compounds (bottom panel). (A) BaP; (B) DEHP; (C) PCB126. The yellow highlighted parts show how the percentage change varies depending on the change in adipose tissue concentrations. Inset in panel A shows the rate of change of chemical leaching from MPs for ages between 43 and 52 years to demonstrate that the maxima adipose tissue concentrations coincide with the minima of the leaching rate of chemicals from MPs.

References

    1. Zhang Q.; Xu E. G.; Li J.; Chen Q.; Ma L.; Zeng E. Y.; Shi H. A Review of Microplastics in Table Salt, Drinking Water, and Air: Direct Human Exposure. Environ. Sci. Technol. 2020, 3740.10.1021/acs.est.9b04535. - DOI - PubMed
    1. Cox K. D.; Covernton G. A.; Davies H. L.; Dower J. F.; Juanes F.; Dudas S. E. Human Consumption of Microplastics. Environ. Sci. Technol. 2019, 53, 7068–7074. 10.1021/acs.est.9b01517. - DOI - PubMed
    1. Presence of Microplastics and Nanoplastics in Food , with Particular Focus on Seafood EFSA Panel on Contaminants in the Food Chain ( CONTAM ). EFSA J. 2016, 14, e04501.10.2903/j.efsa.2016.4501. - DOI
    1. Barboza L. G. A.; Vethaak A. D.; Lavorante B. R. B. O.; Lundebye A.-K.; Guilhermino L. Marine Microplastic Debris : An Emerging Issue for Food Security , Food Safety and Human Health. Mar. Pollut. Bull. 2018, 133, 336–348. 10.1016/j.marpolbul.2018.05.047. - DOI - PubMed
    1. Peixoto D.; Pinheiro C.; Amorim J.; Oliva-Teles L.; Guilhermino L.; Vieira M. N. Microplastic Pollution in Commercial Salt for Human Consumption : A Review. Estuar. Coast. Shelf Sci. January 2018, 219, 161–168. 10.1016/j.ecss.2019.02.018. - DOI

Publication types

LinkOut - more resources