. 2021 Apr 22;6(8):e146827.
doi: 10.1172/jci.insight.146827.

Resistance to androgen receptor signaling inhibition does not necessitate development of neuroendocrine prostate cancer

Affiliations

Resistance to androgen receptor signaling inhibition does not necessitate development of neuroendocrine prostate cancer

W Nathaniel Brennen et al. JCI Insight. .

Abstract

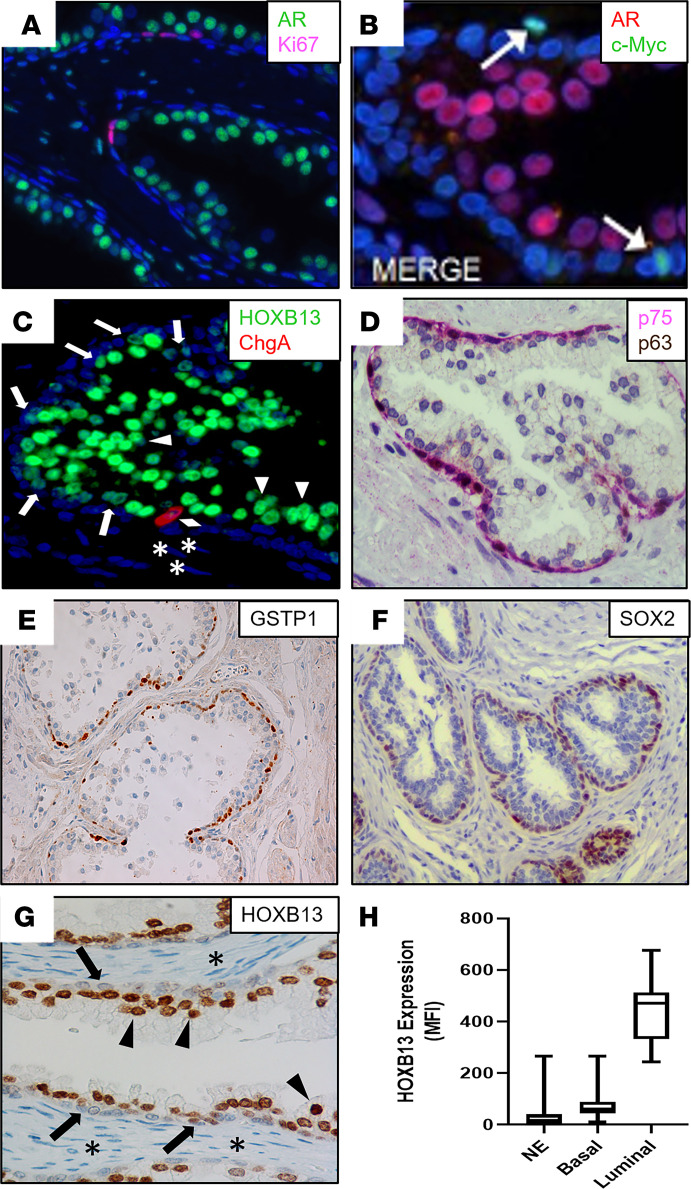
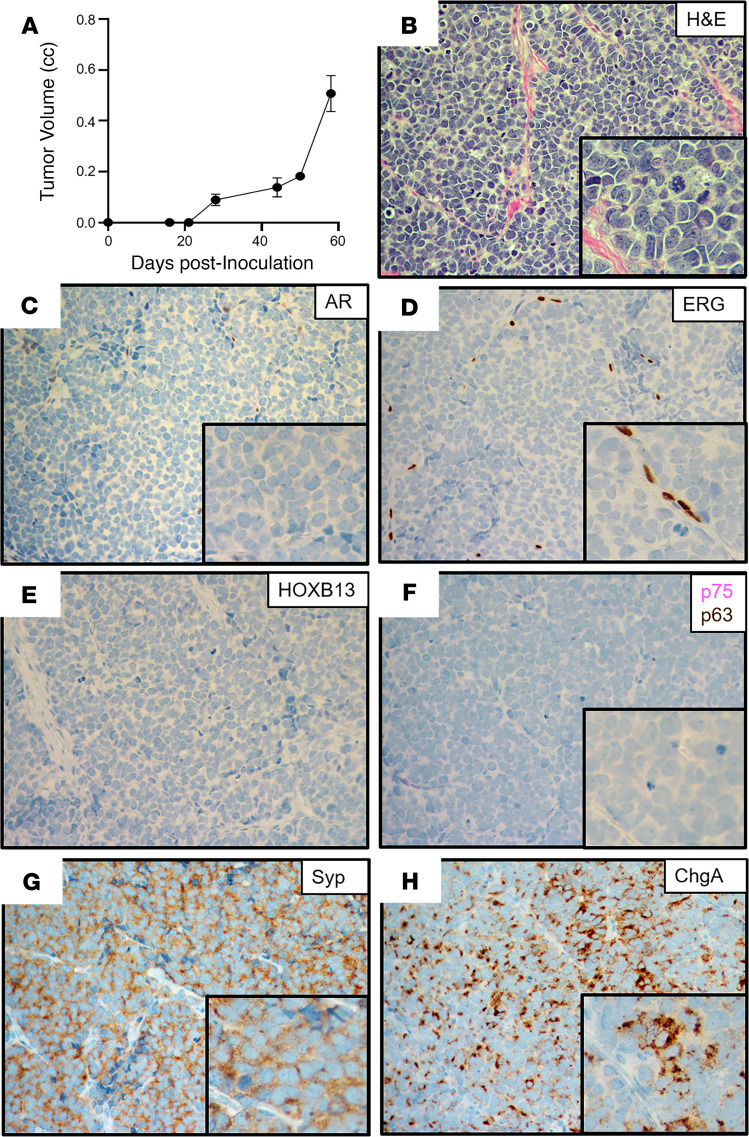
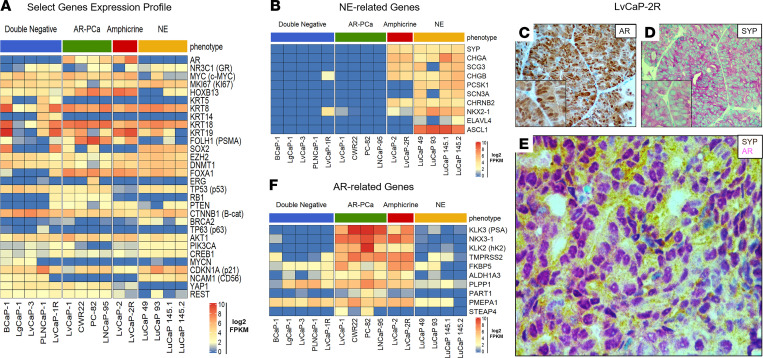
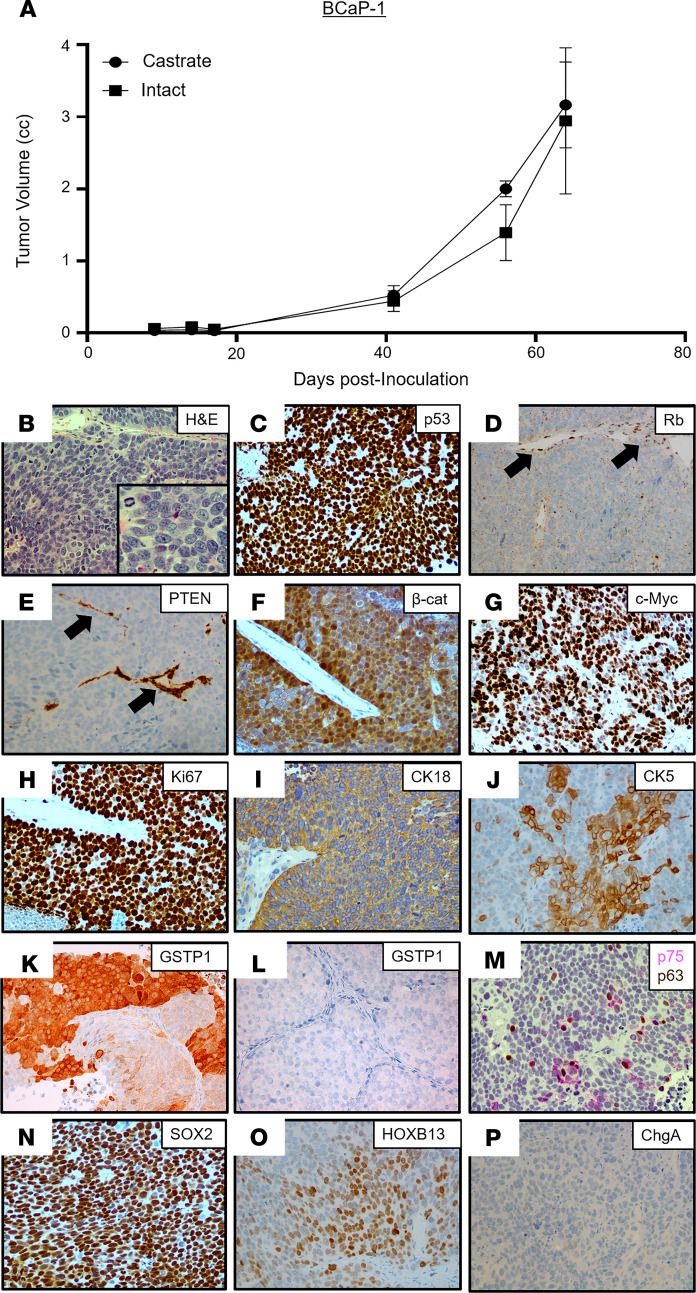
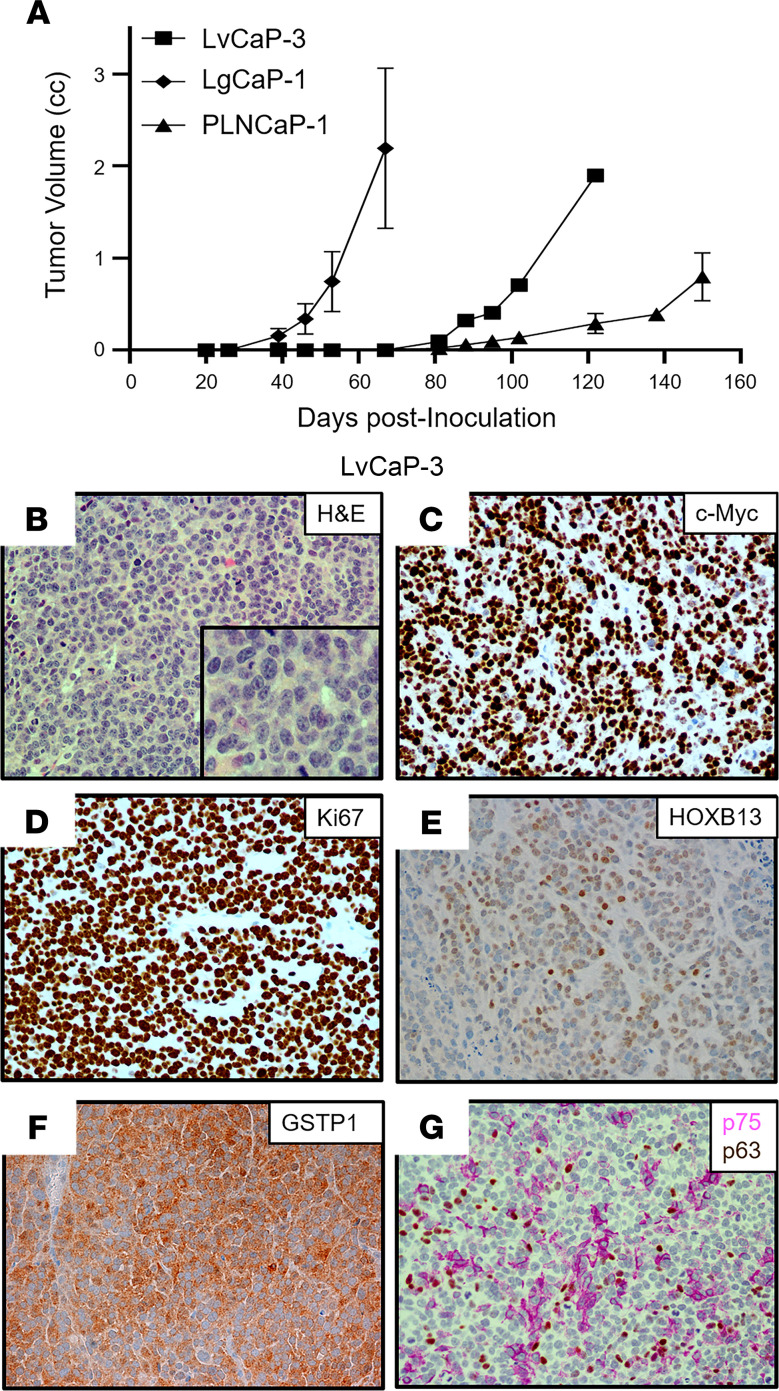
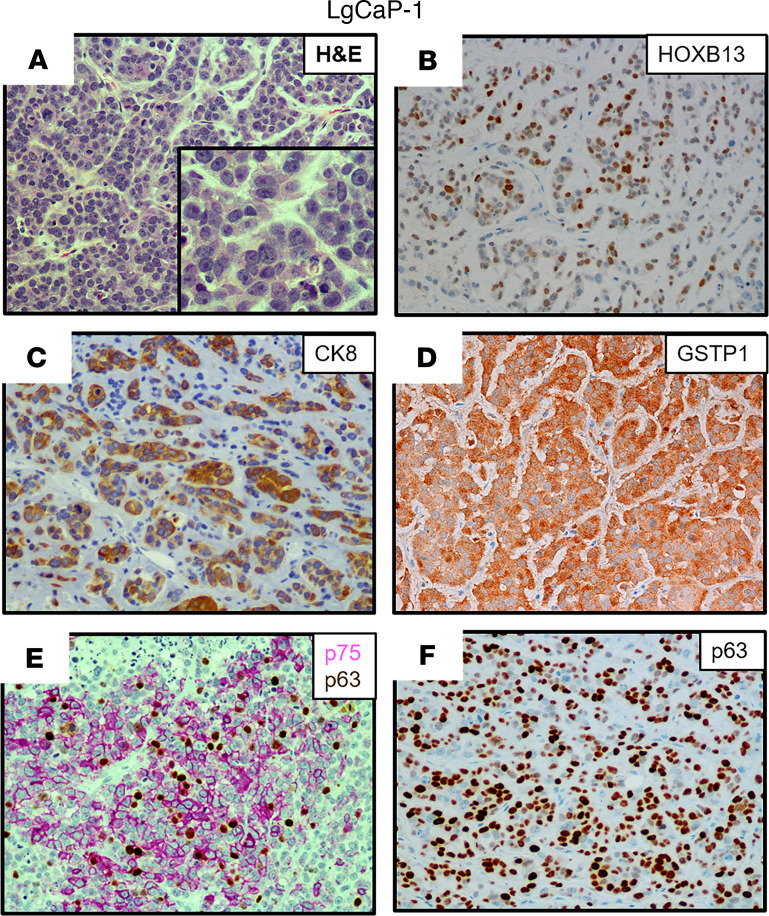
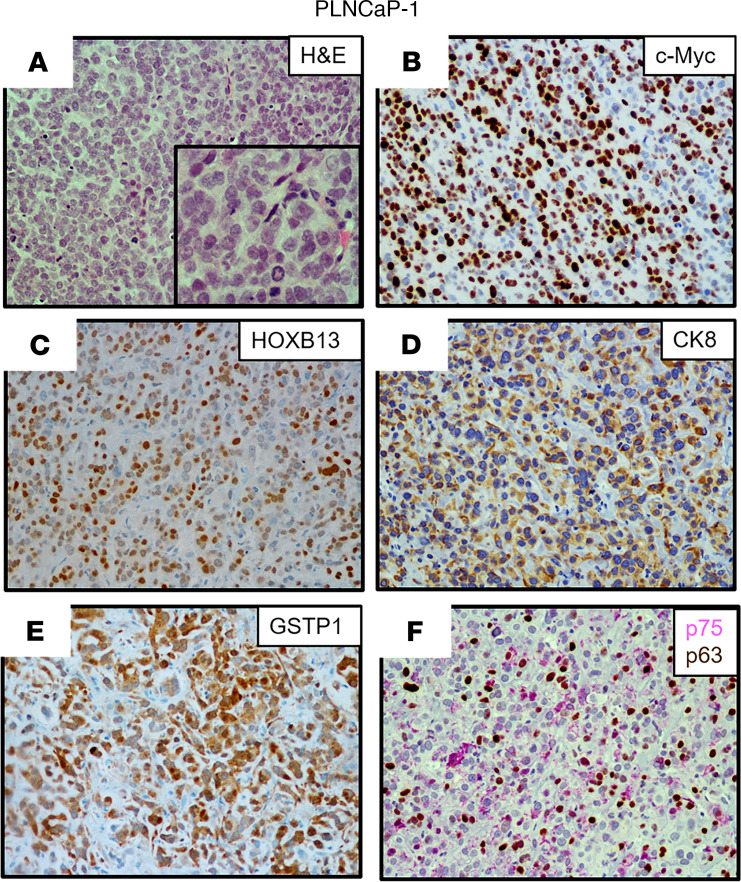
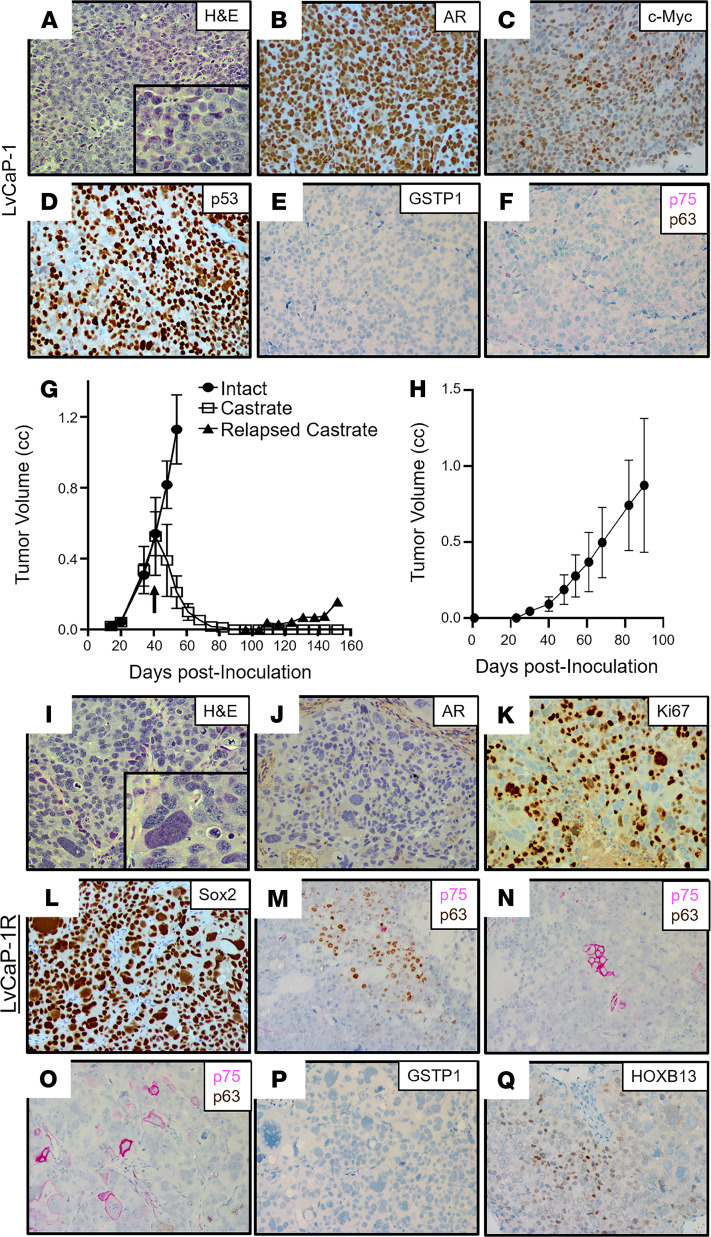
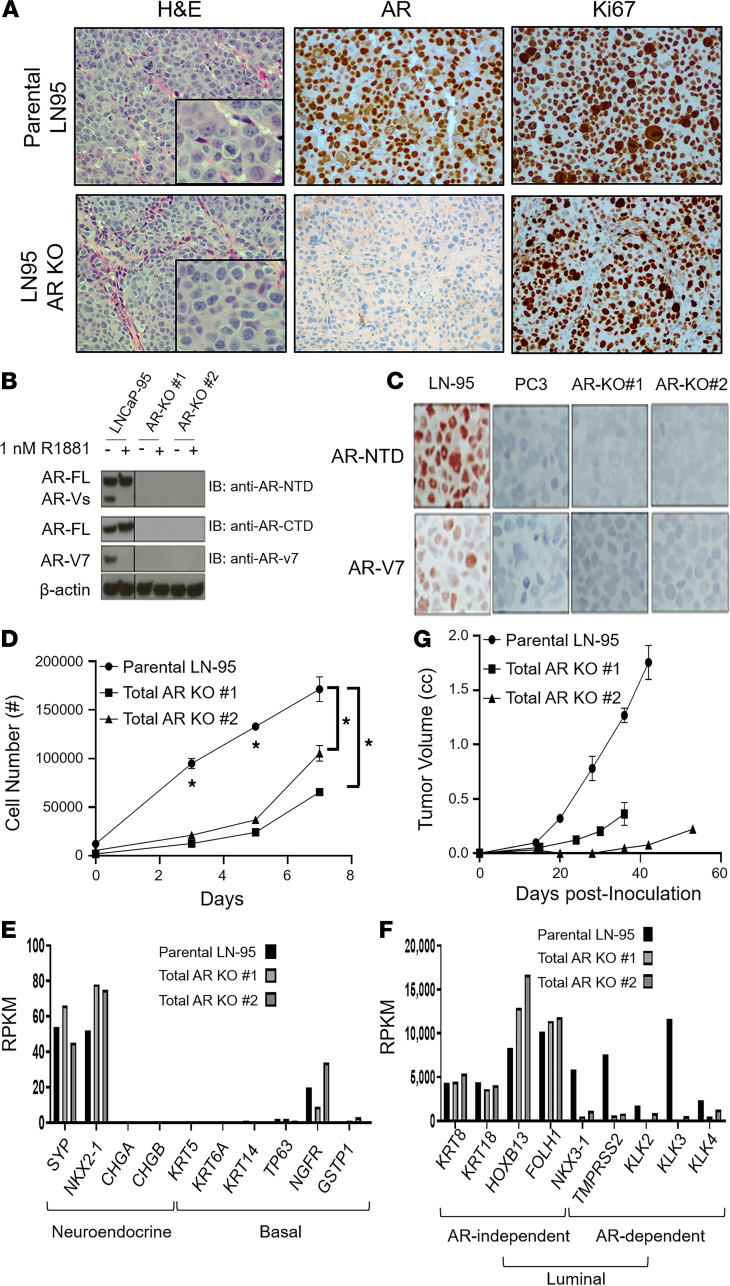
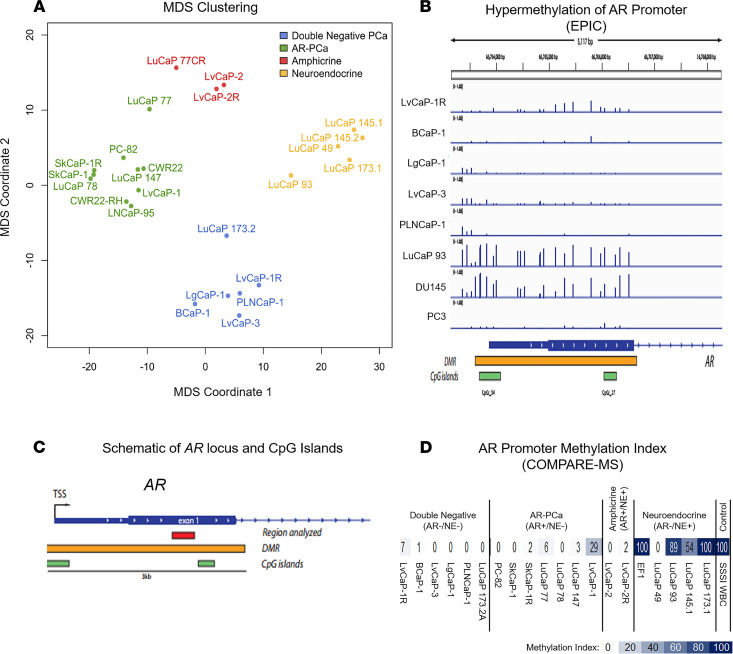
Resistance to AR signaling inhibitors (ARSis) in a subset of metastatic castration-resistant prostate cancers (mCRPCs) occurs with the emergence of AR- neuroendocrine prostate cancer (NEPC) coupled with mutations/deletions in PTEN, TP53, and RB1 and the overexpression of DNMTs, EZH2, and/or SOX2. To resolve whether the lack of AR is the driving factor for the emergence of the NE phenotype, molecular, cell, and tumor biology analyses were performed on 23 xenografts derived from patients with PC, recapitulating the full spectrum of genetic alterations proposed to drive NE differentiation. Additionally, phenotypic response to CRISPR/Cas9-mediated AR KO in AR+ CRPC cells was evaluated. These analyses document that (a) ARSi-resistant NEPC developed without androgen deprivation treatment; (b) ARS in ARSi-resistant AR+/NE+ double-positive "amphicrine" mCRPCs did not suppress NE differentiation; (c) the lack of AR expression did not necessitate acquiring a NE phenotype, despite concomitant mutations/deletions in PTEN and TP53, and the loss of RB1 but occurred via emergence of an AR-/NE- double-negative PC (DNPC); (d) despite DNPC cells having homogeneous genetic driver mutations, they were phenotypically heterogeneous, expressing basal lineage markers alone or in combination with luminal lineage markers; and (e) AR loss was associated with AR promoter hypermethylation in NEPCs but not in DNPCs.

Keywords: Oncology; Prostate cancer.


Conflict of interest statement

Conflict of interest: The authors have declared that no conflict of interest exists.

Figures

Figure 1
Figure 1. Lineage marker expression in the benign prostate.
(A) IF staining of the AR (green) and Ki67 (pink), which documents that the majority of proliferation is restricted to the basal epithelial layer. Nuclei stained with DAPI (blue). (B) IF staining of c-Myc (green) and AR (red), documenting that the small subset of basal cells expressing c-Myc does not express AR. Nuclei stained with DAPI (blue). (C) IF staining of HOXB13 (green) and CHGA (red). Nuclei stained with DAPI (blue). Arrowheads indicate HOXB13-high luminal cells. Arrows indicate HOXB13-low basal cells. Diamond indicates CHGA+ neuroendocrine cell. Asterisks indicate HOXB13 stromal cells. (D) Dual IHC staining of NFGR (pink) and p63 (brown) identifies the basal layer. (E) IHC staining of GSTP1 (brown) in basal layer. (F) IHC staining of SOX2 in basal layer. (G) IHC staining of HOXB13. Arrowheads indicate HOXB13-high luminal cells. Arrows indicate HOXB13-low basal cells. Asterisks indicate HOXB13 stromal cells. (H) Box plots indicate median and IQR range for the MFI of HOXB13 staining normalized to nuclear area in neuroendocrine (n = 97), basal (n = 97), and luminal cells (n = 24) of the normal prostate (whiskers = min/max values). CHGA, chromogranin A; NGFR, nerve growth factor receptor.
Figure 2
Figure 2. Characteristics of the NCI-H660 xenograft.
(A) Growth rate in castrated NSG male mice (n = 5). (B) H&E histology (original magnification, ×200; inset [original magnification, ×400]). (CH) IHC (original magnification, ×200) for (C) AR; (D) ERG (note positive staining in tumor endothelial cells); (E) HOXB13; (F) NFGR (pink) and p63 (brown) dual stain; (G) SYP; and (H) CHGA. NGFR, nerve growth factor receptor; SYP, synaptophysin; CHGA, chromogranin A.
Figure 3
Figure 3. Gene expression in lethal mCRPC PDXs and amphicrine phenotype in LvCaP-2R.
Lethal mCRPC PDXs analyzed for RNA expression of (A) select genes and (B) NE-associated genes. (CE) IHC step-section of LvCaP-2R PDX stained for (C) AR (original magnification, ×200), (D) SYP (original magnification, ×200), and (E) dual staining (original magnification, ×400) for AR (pink) and SYP (brown), documenting the coexpression of both markers in the same cell (i.e., amphicrine). (F) RNA-Seq analysis for AR-regulated genes in a panel of PDXs representing different phenotypes (e.g., DN, ARPC, amphicrine, and NE). mCRPC, metastatic castration-resistant prostate cancer; NE, neuroendocrine; PDXs, patient-derived xenografts; SYP, synaptophysin; DN, double-negative.
Figure 4
Figure 4. Characteristics of the BCaP-1 PDX.
(A) Growth rate in intact vs. castrated NSG male mice (n = 5). (B) H&E histology (original magnification, ×200; inset [original magnification, ×400]). (CP) IHC (original magnification, ×200) for (C) p53; (D) Rb (note that endothelial cell nuclei are an internal positive control for staining [black arrows]); (E) PTEN (note that endothelial cells are an internal positive control for staining [black arrows]); (F) β-catenin; (G) c-MYC; (H) Ki67; (I) CK18; (J) focal CK5; (K) GSTP1 in BCaP-1 (positive); (L) GSTP1 in SkCaP-1 (negative control); (M) dual staining for p75 (pink) and p63 (brown); (N) Sox2; (O) HOXB13; and (P) CHGA. PDX, patient-derived xenograft; CHGA, chromogranin A.
Figure 5
Figure 5. Characteristics of the LvCaP-3 PDX.
(A) Comparative growth rate in castrated NSG male mice (n = 5) of LvCaP-3, LgCaP-1, and PLNCaP-1. (B) H&E histology (original magnification, ×200; inset [original magnification, ×400]). (CF) IHC (original magnification, ×200) for (C) c-MYC, (D) Ki67, (E) HOXB13, and (F) GSTP1. (G) Dual staining for NGFR (pink) and p63 (brown). PDX, patient-derived xenograft; NGFR, nerve growth factor receptor.
Figure 6
Figure 6. Characteristics of the LgCaP-1 PDX.
(A) H&E histology (original magnification, ×200; inset [original magnification, ×400]); (BE) IHC (original magnification, ×200) for (B) HOXB13; (C) CK8; (D) GSTP1; (E) NGFR (pink); and (F) p63 (brown). PDX, patient-derived xenograft; NGFR, nerve growth factor receptor.
Figure 7
Figure 7. Characteristics of the PLNCaP-1 PDX.
(A) H&E histology (original magnification, ×200; inset [original magnification, ×400]). (BF) IHC (original magnification, ×200) for (B) c-MYC; (C) HOXB13; (D) CK8; (E) GSTP1; and (F) NGFR (pink) and p63 (brown). PDX, patient-derived xenograft; NGFR, nerve growth factor receptor.
Figure 8
Figure 8. Characteristics of the LvCaP-1 PDX.
(A) H&E histology (original magnification, ×200; inset [original magnification, ×400]). (BF) IHC (original magnification, ×200) for (B) AR; (C) HOXB13; (D) p53; (E) GSTP1; and (F) dual staining for NGFR (pink) and p63 (brown). (G) Growth rate in intact and subsequent regression and relapse to castration in NSG male mice (n = 5 each). Characteristics of the LvCaP-1R PDX. (H) Growth rate in castrated NSG male mice (n = 5 each); (I) H&E histology (original magnification, ×200; inset [original magnification, ×400]) showing a pleomorphic giant cell. (JQ) IHC (original magnification, ×200) for (J) AR; (K) Ki67; (L) SOX2; (MO) dual staining for NGFR (pink) and p63 (brown); (P) GSTP1; and (Q) HOXB13. PDX, patient-derived xenograft; NGFR, nerve growth factor receptor.
Figure 9
Figure 9. Characterization of LN-95 parental vs.
total AR-KO cells. (A) Left panels are the histology (original magnification, ×200; inset [original magnification, ×400]); middle panels are the AR protein expression (original magnification, ×200); and right panels are the Ki67 expression (original magnification, ×200) of the PDXs. (B) Western blot documentation of the successful KO of AR protein in multiple clones of LN-95 cells. (C) IHC (original magnification, ×200) staining of parental LN-95 cells expressing both full-length AR (AR-FL) and AR variant 7 (AR-V7) vs. AR PC-3 cells and the AR-KO clones using an N-terminal AR antibody and an AR-V7–specific antibody. (D) In vitro growth of the parental LN-95 cells vs. total AR-KO clones in 10% CS-FBS media, with asterisks denoting a significant difference at the P < 0.05 level. (E) RNA-Seq–based comparison of the expression of NE-specific and basal-specific genes in total AR-KO clones compared with parental LN-95 cells. (F) RNA-Seq–based comparison of the expression of AR-independent and AR-dependent luminal-specific genes in total AR-KO clones compared with parental LN-95 cells (note the significant difference in the magnitude of the y axis between panels). (G) In vivo growth of the total AR-KO clones vs. the parental LN-95 in castrated hosts. LN-95, LNCaP-95.
Figure 10
Figure 10. Clustering of lethal mCRPC PDXs and analysis of AR promoter methylation.
(A) Clustering of PDX models based on multidimensional scaling. (B) Analysis of methylation levels at the single CpG level using Illumina EPIC arrays reveals hypermethylation of a region encompassing the transcriptional start site and the first exon of AR in LuCaP 93 and DU145 cells. (C) Schematic of the AR locus showing CpG islands, the putative differentially methylated region, and the region interrogated in this COMPARE-MS study. (D) Heat map of methylation indices in the first exon of AR in PDX lines as assessed by COMPARE-MS. mCRPC, metastatic castration-resistant prostate cancer; PDXs, patient-derived xenografts.

Similar articles

Cited by

References

    1. Isaacs JT, Coffey DS. Etiology and disease process of benign prostatic hyperplasia. Prostate Suppl. 1989;2:33–50. - PubMed
    1. Moad M, et al. Multipotent basal stem cells, maintained in localized proximal niches, support directed long-ranging epithelial flows in human prostates. Cell Rep. 2017;20(7):1609–1622. doi: 10.1016/j.celrep.2017.07.061. - DOI - PMC - PubMed
    1. Berges RR, et al. Implication of cell kinetic changes during the progression of human prostatic cancer. Clin Cancer Res. 1995;1(5):473–480. - PMC - PubMed
    1. Litvinov, et al. Is the Achilles’ heel for prostate cancer therapy a gain of function in androgen receptor signaling? J Clin Endocrinol Metab. 2003;88(7):2972–2982. doi: 10.1210/jc.2002-022038. - DOI - PubMed
    1. Kurita T, et al. Paracrine regulation of apoptosis by steroid hormones in the male and female reproductive system. Cell Death Differ. 2001;8(2):192–200. doi: 10.1038/sj.cdd.4400797. - DOI - PubMed

Publication types

MeSH terms

Substances