. 2021 Oct 22;144(9):2771-2783.
doi: 10.1093/brain/awab114.

Early stages of tau pathology and its associations with functional connectivity, atrophy and memory

Affiliations

Early stages of tau pathology and its associations with functional connectivity, atrophy and memory

David Berron et al. Brain. .

Abstract

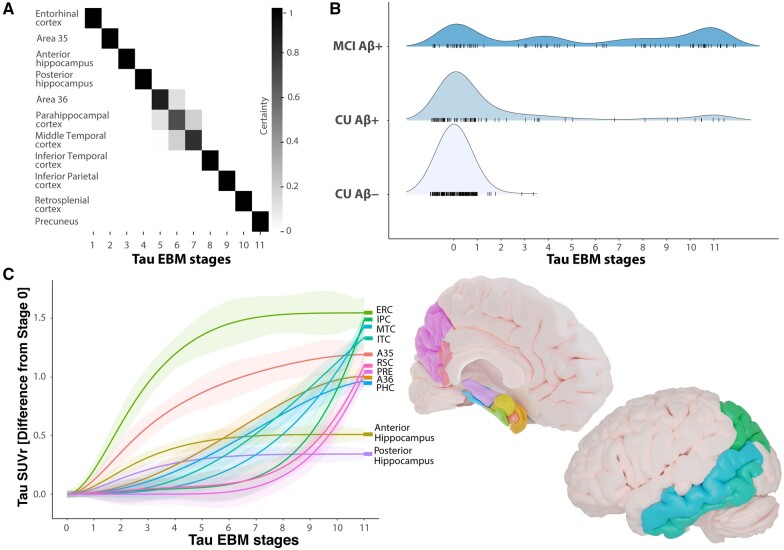
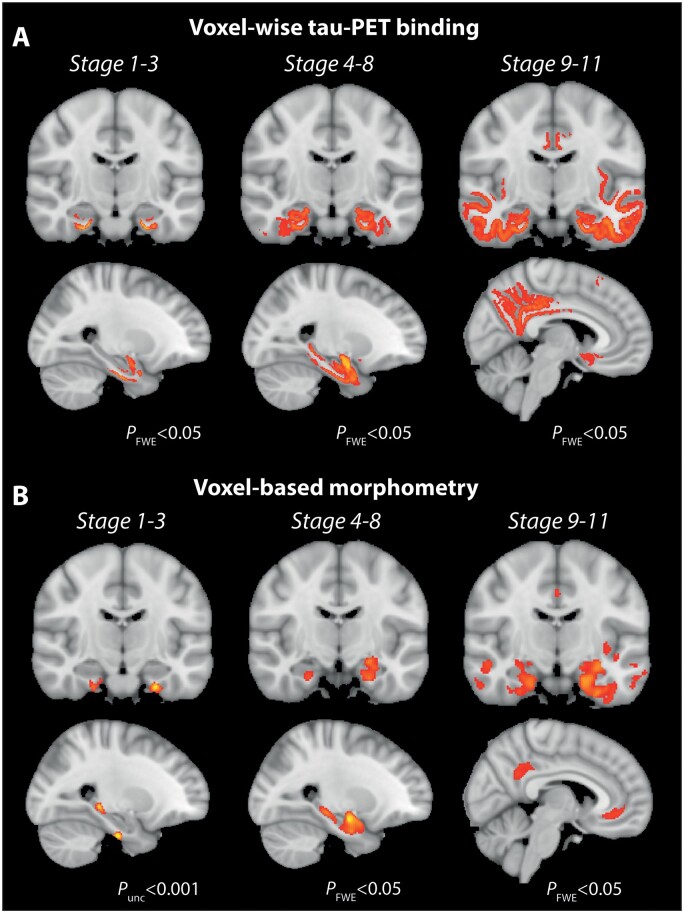
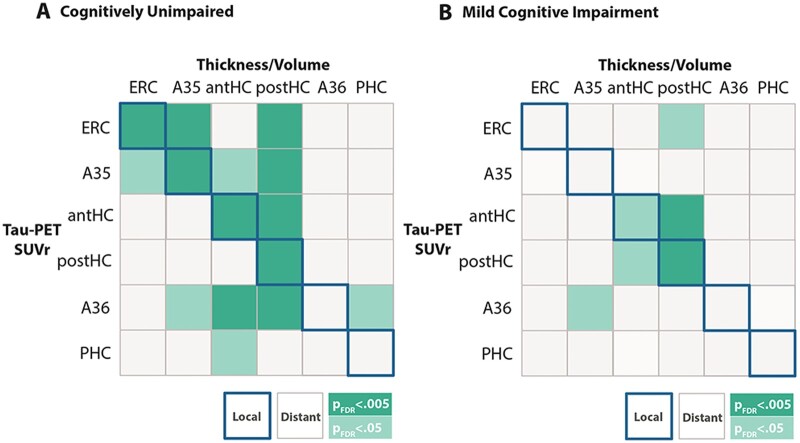
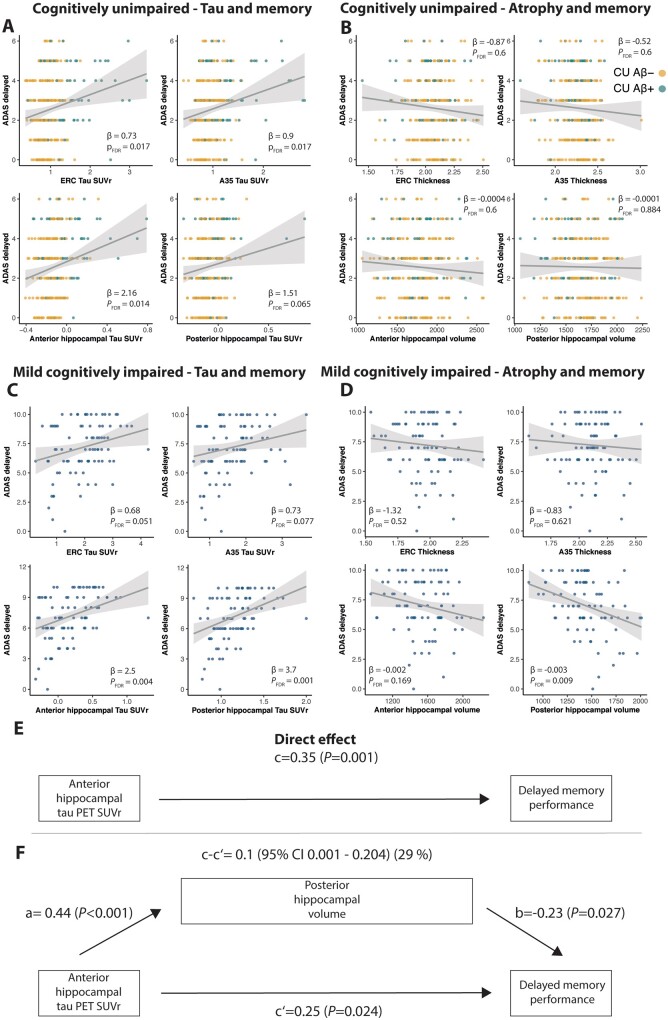
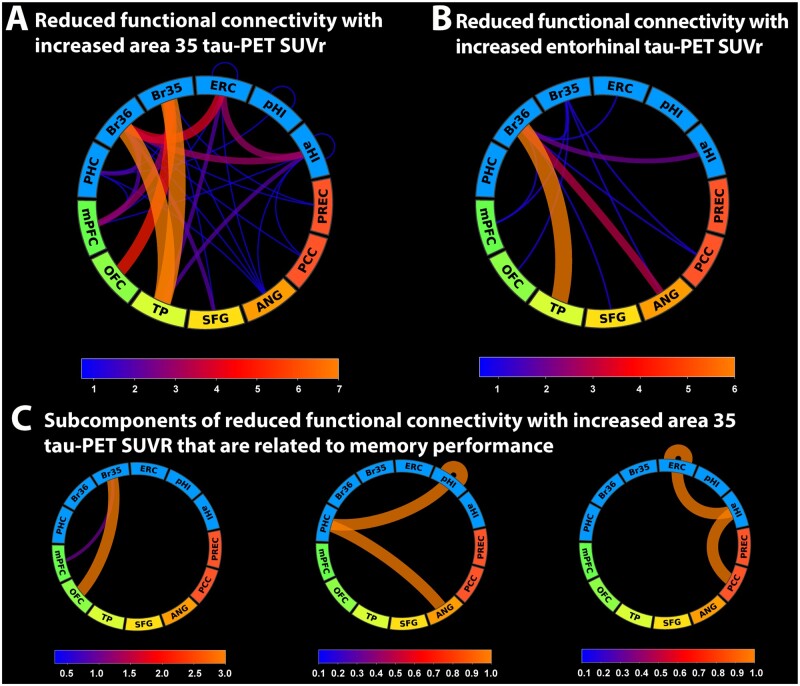
In Alzheimer's disease, post-mortem studies have shown that the first cortical site where neurofibrillary tangles appear is the transentorhinal region, a subregion within the medial temporal lobe that largely overlaps with Brodmann area 35, and the entorhinal cortex. Here we used tau-PET imaging to investigate the sequence of tau pathology progression within the human medial temporal lobe and across regions in the posterior-medial system. Our objective was to study how medial temporal tau is related to functional connectivity, regional atrophy, and memory performance. We included 215 amyloid-β- cognitively unimpaired, 81 amyloid-β+ cognitively unimpaired and 87 amyloid-β+ individuals with mild cognitive impairment, who each underwent 18F-RO948 tau and 18F-flutemetamol amyloid PET imaging, structural T1-MRI and memory assessments as part of the Swedish BioFINDER-2 study. First, event-based modelling revealed that the entorhinal cortex and Brodmann area 35 show the earliest signs of tau accumulation followed by the anterior and posterior hippocampus, Brodmann area 36 and the parahippocampal cortex. In later stages, tau accumulation became abnormal in neocortical temporal and finally parietal brain regions. Second, in cognitively unimpaired individuals, increased tau load was related to local atrophy in the entorhinal cortex, Brodmann area 35 and the anterior hippocampus and tau load in several anterior medial temporal lobe subregions was associated with distant atrophy of the posterior hippocampus. Tau load, but not atrophy, in these regions was associated with lower memory performance. Further, tau-related reductions in functional connectivity in critical networks between the medial temporal lobe and regions in the posterior-medial system were associated with this early memory impairment. Finally, in patients with mild cognitive impairment, the association of tau load in the hippocampus with memory performance was partially mediated by posterior hippocampal atrophy. In summary, our findings highlight the progression of tau pathology across medial temporal lobe subregions and its disease stage-specific association with memory performance. While tau pathology might affect memory performance in cognitively unimpaired individuals via reduced functional connectivity in critical medial temporal lobe-cortical networks, memory impairment in mild cognitively impaired patients is associated with posterior hippocampal atrophy.

Keywords: Alzheimer’s disease; MRI; medial temporal lobe subregions; memory; tau-PET imaging.


Figures

Figure 1
Figure 1
Sequence of biomarker abnormality in non-demented older adults. (A) Positional variance plot for the EBM including tau-PET regions of interest in the MTL and posterior-medial system showing the distribution of event sequences. The positional variance diagram shows the uncertainty in the maximum likelihood event ordering estimated by taking MCMC (Markov chain Monte Carlo) samples using the EBM and each entry represents the proportion of MCMC samples in which events appear at a particular position in the sequence (x-axis). The proportion ranges from 0 in white to 1 in black. (B) Distributions of study participants in diagnostic groups across tau-EBM stages. (C) Non-linear splines visualizing differences in tau-PET SUVR across tau-EBM stages for individual regions of interest. Mean tau-PET SUVR from individuals in stage 0 was subtracted from tau PET SUVR in individual regions of interest. A35 = Brodmann area 35; A36 = Brodmann area 36; Aβ = amyloid-β; CU = cognitively unimpaired; ERC = entorhinal cortex; IPC = inferior parietal cortex; ITC = inferior temporal cortex; MTC = middle temporal cortex; PHC = parahippocampal cortex; PRE = precuneus; RSC = retrosplenial cortex.
Figure 2
Figure 2
Voxel-wise tau-PET binding and voxel-based morphometry across tau-EBM stages. (A) Voxel-wise group differences in tau-PET SUVR images resulting from two-sample t-tests between a group corresponding to tau-EBM stage 0 (n = 281) and groups corresponding to stage 1–3 (n = 35), stage 4–8 (n = 29) and stage 9–11 (n = 38), respectively. (B) Group differences derived from voxel-based morphometry between identical groups. Voxel-wise results in all analyses were corrected using family-wise error (FWE) correction at a threshold of P < 0.05 and a cluster size of 50 mm3. The voxel-based morphometry group comparison between individuals in stage 1–3 and individuals in stage 0 (B, left) did not yield significant results using that statistical threshold and is thus reported at an uncorrected threshold of P < 0.001.
Figure 3
Figure 3
Relationship between MTL subregional tau SUVR and atrophy. (A) Relationships in cognitively unimpaired individuals and (B) in patients with MCI. Correlation matrices show the relationship between subregional measures of tau SUVR (rows) and atrophy measures (columns). Relationships lying on the diagonal (highlighted in blue) indicate local relationships between a given subregions tau SUVR and local thickness or volume. Relationships off the diagonal indicate distant effects, where tau SUVR in one region was associated with atrophy in another region. Dark green represents multiple regression models that are significant at PFDR < 0.005, while light green indicate significance at PFDR < 0.05. All regression models were corrected for age, sex and continuous amyloid-β PET SUVR in the cortical composite region. Regression models including volumetric measures (anterior and posterior hippocampus) were additionally corrected for intracranial volume. A35 = Brodmann area 35; A36 = Brodmann area 36; Aβ = amyloid-β; CU = cognitively unimpaired; ERC = entorhinal cortex; IPC = inferior parietal cortex; ITC = inferior temporal cortex; MTC = middle temporal cortex; PHC = parahippocampal cortex; PRE = precuneus; RSC = retrosplenial cortex.
Figure 4
Figure 4
Relationships between MTL tau SUVR, memory performance and atrophy in cognitively unimpaired individuals and patients with MCI. Relationships between MTL tau SUVR and memory in (A) cognitively unimpaired and (C) MCI as well as between MTL atrophy and memory in (B) cognitively unimpaired and (D) MCI. A mediation analysis revealed that posterior hippocampal volume partially mediates the relationship between anterior hippocampal tau SUVR and memory. (E) The direct effect (c) of anterior hippocampal tau SUVR on delayed memory performance. (F) The mediated effect of posterior hippocampal volume is designated c-c′. The remaining effect of anterior hippocampal tau SUVR on delayed memory performance after adjusting for posterior hippocampal volume is designated ‘c′’. The direct effect of anterior hippocampal tau-PET SUVR on posterior hippocampal volume is ‘a’, the effect of posterior hippocampal volume on delayed memory performance is ‘b’. All regression models were corrected for age, sex, years of education and continuous amyloid-β PET SUVR in a cortical composite region. Regression models including volumetric measures (anterior and posterior hippocampus) were additionally corrected for intracranial volume. Note that ADAS delayed recall performance is reported in number of errors. A35 = Brodmann area 35; ERC = entorhinal cortex.
Figure 5
Figure 5
Changes in functional connectivity between the MTL and regions in the anterior-temporal and posterior-medial system in cognitively unimpaired individuals. (A) Network component of reduced functional connectivity with increasing tau-PET signal in Brodmann area 35 and (B) the entorhinal cortex. (C) Subcomponents of A that are significantly associated to delayed recall memory performance. Line width and colour in the connectograms are proportional to the number of links between regions of interest as indicated in the corresponding scale. A35 = Brodmann area 35; A36 = Brodmann area 36; Aβ = amyloid-β; CU = cognitively unimpaired; ERC = entorhinal cortex; IPC = inferior parietal cortex; ITC = inferior temporal cortex; MTC = middle temporal cortex; PHC = parahippocampal cortex; PRE = precuneus; RSC = retrosplenial cortex.

References

    1. Nelson PT, Alafuzoff I, Bigio EH, et al.Correlation of Alzheimer disease neuropathologic changes with cognitive status: A review of the literature. J Neuropathol Exper Neurol. 2012;71(5):362–381. - PMC - PubMed
    1. Maass A, Lockhart SN, Harrison TM, et al.Entorhinal tau pathology, episodic memory decline, and neurodegeneration in aging. J Neurosci. 2018;38(3):530–543. - PMC - PubMed
    1. Ritchey M, Libby LA, Ranganath C.. Progress in brain research. Progr Brain Res. 2015;219:45–64. - PubMed
    1. Ranganath C, Ritchey M.. Two cortical systems for memory-guided behaviour. Nat Rev Neurosci. 2012;13(10):713–726. - PubMed
    1. Palmqvist S, Schöll M, Strandberg O, et al.Earliest accumulation of amyloid-β occurs within the default-mode network and concurrently affects brain connectivity. Nat Commun. 2017;8(1):1214. - PMC - PubMed

Publication types