. 2021 May;95(5):1595-1619.
doi: 10.1007/s00204-021-03011-5. Epub 2021 Mar 16.

Transcriptional profiling of the response to the trichloroethylene metabolite S-(1,2-dichlorovinyl)-L-cysteine revealed activation of the eIF2α/ATF4 integrated stress response in two in vitro placental models

Affiliations

Transcriptional profiling of the response to the trichloroethylene metabolite S-(1,2-dichlorovinyl)-L-cysteine revealed activation of the eIF2α/ATF4 integrated stress response in two in vitro placental models

Elana R Elkin et al. Arch Toxicol. 2021 May.

Abstract

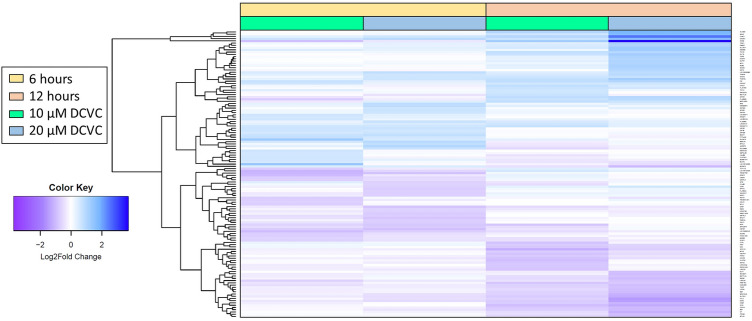
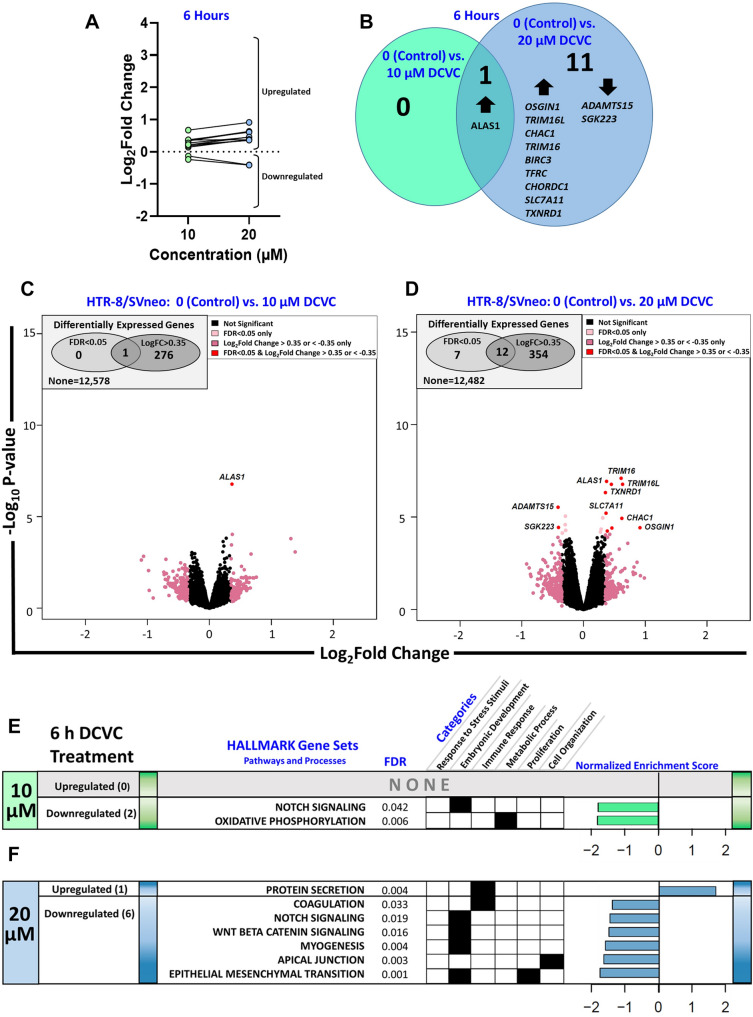
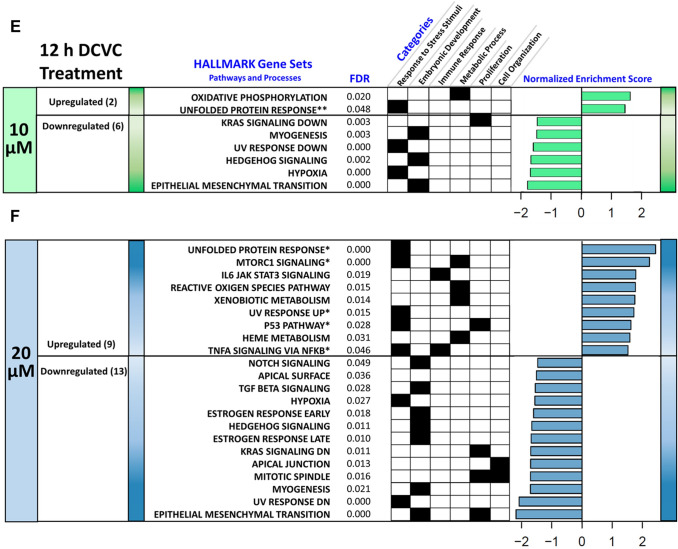
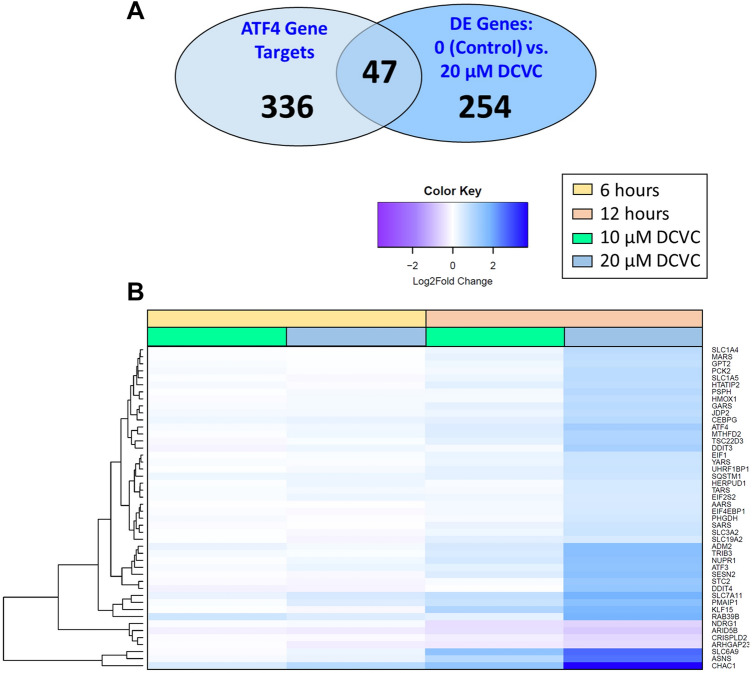
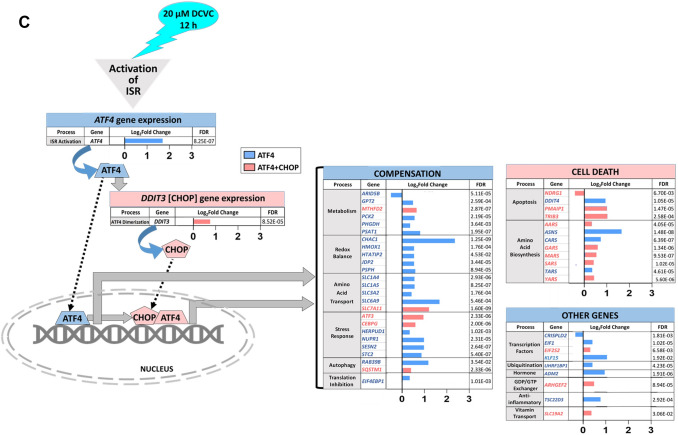
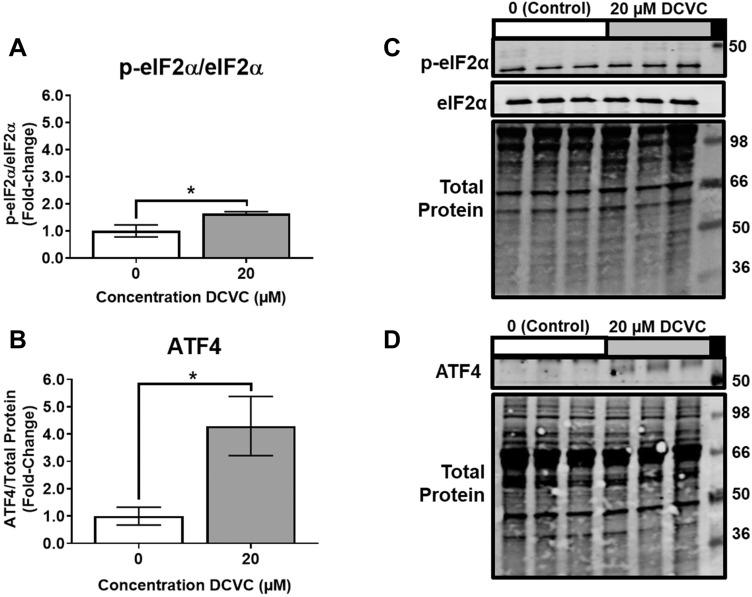
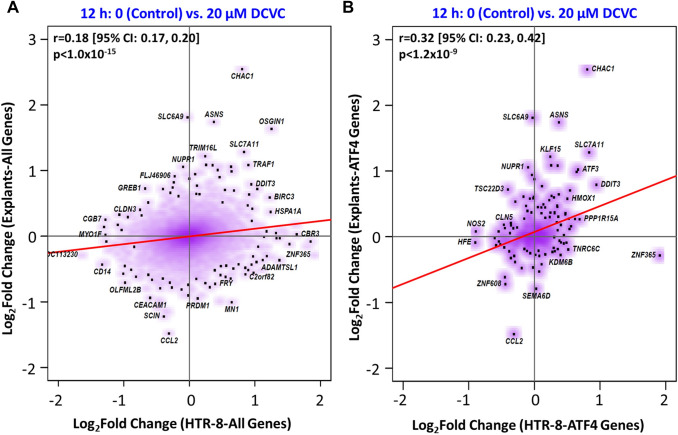
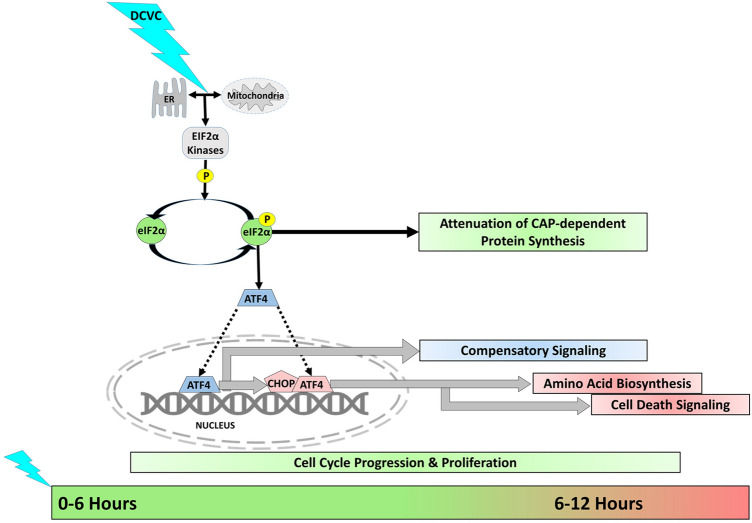
Trichloroethylene (TCE) is an industrial solvent and widespread environmental contaminant. Although TCE exposure is prevalent, epidemiological studies of TCE exposure associations with adverse birth outcomes are inconclusive. Prior studies show that the TCE metabolite S-(1,2-dichlorovinyl)-L-cysteine (DCVC) exhibits toxicity in a placental cell line. In the current study, genome-wide gene expression and gene set enrichment analyses were used to identify novel genes and pathway alterations in the HTR-8/SVneo human trophoblast cell line and human placental villous explants treated with DCVC at concentrations relevant to human exposures. In the cells, concentration- and time-dependent effects were observed, as evidenced by the magnitude of altered gene expression after treatment with 20 µM DCVC versus 10 µM, and 12-h versus 6-h of treatment. Comparing the two models for the transcriptional response to 12-h 20 µM DCVC treatment, no differentially expressed genes reached significance in villous explants, whereas 301 differentially expressed genes were detected in HTR-8/SVneo cells compared with non-treated controls (FDR < 0.05 + LogFC > 0.35 [FC > 1.3]). GSEA revealed five upregulated enriched pathways in common between explants and cells (FDR < 0.05). Moreover, all 12-h DCVC treatment groups from both models contained upregulated pathways enriched for genes regulated by the ATF4 transcription factor. The overrepresentation of ATF4 regulation of differentially expressed genes indicated activation of the integrated stress response (ISR), a condition triggered by multiple stress stimuli, including the unfolded protein response. DCVC-induced ISR activation was confirmed by elevated eIF2α phosphorylation, ATF4 protein concentrations, and decreased global protein synthesis in HTR-8/SVneo cells. This study identifies a mechanism of DCVC-induced cytotoxicity by revealing the involvement of a specific stress signaling pathway.

Keywords: ATF4; Integrated stress response; Placenta; S-(1,2-dichlorovinyl)-l-cysteine (DCVC); Trichloroethylene.


Conflict of interest statement

The authors declare no conflicts of interest.

Figures

Fig. 1
Fig. 1
Overall experimental design. HTR-8/SVneo cells and villous explant tissues were exposed to 0, 10 or 20 µM DCVC for 6 or 12 h. RNA sequencing and gene set enrichment analysis were performed to identify novel genes and pathways affected by DCVC treatment. Follow-up experiments were conducted to verify the affected genes and pathways in HTR-8/SVneo cells
Fig. 2
Fig. 2
Top logFC expression levels for comparisons between treated versus control samples. HTR-8/SVneo cells were treated with 0 (control), 10 or 20 µM DCVC for 6 or 12 h. Heatmap depicts expression levels for the 40 genes with the largest magnitude logFC (up and downregulated) from each of the following comparisons: control vs. 10 µM DCVC (6 h), control vs. 20 µM DCVC (6 h), control vs. 10 µM DCVC (12 h) and control vs. 20 µM DCVC (12 h)
Fig. 3
Fig. 3
Effects of 6-h DCVC treatment on HTR-8/SVneo gene expression. HTR-8/SVneo cells were treated with 0 (control), 10 or 20 µM DCVC for 6 h. Differential gene expression was analyzed with the edgeR package for R using quasi-likelihood general linear modeling. N = 4 independent experiments. a Spaghetti plot depicting concentration-dependent expression levels for genes meeting FDR and logFC criteria. Blue dots represent individual genes differentially expressed (FDR < 0.05 + logFC > 0.35 [FC > 1.3]) with 20 µM DCVC. Lines connecting blue dots to green dots represent the same respective genes with 10 µM expression levels. b Venn diagram depicting overlap in differentially expressed genes (FDR < 0.05 + logFC > 0.35 [FC > 1.3]) at 6 h, between 0 (control) vs.10 µM and 0 vs. 20 µM DCVC. Volcano plots comparing differential gene expression between non-treated (controls) cells and 6-h DCVC-treated cells are depicted for: c 10 µM DCVC and d 20 µM DCVC. Genes were considered differentially expressed with FDR < 0.05. Genes fulfilling the following criteria are denoted by color: FDR < 0.05 only (light pink), logFC magnitude > 0.35 [FC > 1.3] only (dark pink), and FDR < 0.05 + logFC magnitude > 0.35 [FC > 1.3] (red). Upregulated and downregulated gene sets from the MSigDB hallmark collection were identified through GSEA as enriched after treatment with e 10 µM DCVC or f 20 µM DCVC. Relevant characteristics of enriched gene sets are reported as: FDR, biological pathway categories and normalized enrichment score (NES). Gene sets are ordered according to magnitude of NES and were considered enriched with an FDR < 0.05
Fig. 4
Fig. 4
Effects of 12-h DCVC treatment on HTR-8/SVneo gene expression. HTR-8/SVneo cells were treated with 0 (control), 10 or 20 µM DCVC for 12 h. Differential gene expression was analyzed with the edgeR package for R using quasi-likelihood general linear modeling. N = 4 independent experiments. a Spaghetti plot depicting concentration-dependent expression levels for genes meeting FDR and logFC criteria. Blue dots represent individual genes differentially expressed (FDR < 0.05 + logFC > 0.35 [FC > 1.3]) with 20 µM treatment. Lines connecting blue dots to green dots represent the same respective genes with 10 µM expression levels. b Venn diagram depicting overlap in differentially expressed genes (FDR < 0.05 + logFC > 0.35 [FC > 1.3]) at 12 h, between 0 (control) vs.10 µM and 0 vs. 20 µM DCVC. Volcano plots comparing differential gene expression between non-treated (controls) cells and 12-h DCVC-treated cells are depicted for: c 10 µM DCVC and d 20 µM DCVC. Genes were considered differentially expressed with FDR < 0.05. Genes fulfilling the following criteria are denoted by color: FDR < 0.05 only (light pink), logFC magnitude > 0.35 [FC > 1.3] only (dark pink), and FDR < 0.05 + logFC magnitude > 0.35 [FC > 1.3] (red). Upregulated and downregulated gene sets from the MSigDB hallmark collection were identified through GSEA as enriched after treatment with e 10 µM DCVC or f 20 µM DCVC. Relevant characteristics of enriched gene sets are reported as FDR, pathway categories and normalized enrichment score (NES). Gene sets are ordered according to magnitude of NES and were considered enriched with an FDR < 0.05. Gene sets with an asterisk indicate they that the pathways contained ISR/ATF4-regulated enriched genes (detailed information found in suppl. table 6)
Fig. 4
Fig. 4
Effects of 12-h DCVC treatment on HTR-8/SVneo gene expression. HTR-8/SVneo cells were treated with 0 (control), 10 or 20 µM DCVC for 12 h. Differential gene expression was analyzed with the edgeR package for R using quasi-likelihood general linear modeling. N = 4 independent experiments. a Spaghetti plot depicting concentration-dependent expression levels for genes meeting FDR and logFC criteria. Blue dots represent individual genes differentially expressed (FDR < 0.05 + logFC > 0.35 [FC > 1.3]) with 20 µM treatment. Lines connecting blue dots to green dots represent the same respective genes with 10 µM expression levels. b Venn diagram depicting overlap in differentially expressed genes (FDR < 0.05 + logFC > 0.35 [FC > 1.3]) at 12 h, between 0 (control) vs.10 µM and 0 vs. 20 µM DCVC. Volcano plots comparing differential gene expression between non-treated (controls) cells and 12-h DCVC-treated cells are depicted for: c 10 µM DCVC and d 20 µM DCVC. Genes were considered differentially expressed with FDR < 0.05. Genes fulfilling the following criteria are denoted by color: FDR < 0.05 only (light pink), logFC magnitude > 0.35 [FC > 1.3] only (dark pink), and FDR < 0.05 + logFC magnitude > 0.35 [FC > 1.3] (red). Upregulated and downregulated gene sets from the MSigDB hallmark collection were identified through GSEA as enriched after treatment with e 10 µM DCVC or f 20 µM DCVC. Relevant characteristics of enriched gene sets are reported as FDR, pathway categories and normalized enrichment score (NES). Gene sets are ordered according to magnitude of NES and were considered enriched with an FDR < 0.05. Gene sets with an asterisk indicate they that the pathways contained ISR/ATF4-regulated enriched genes (detailed information found in suppl. table 6)
Fig. 5
Fig. 5
Time-dependent differential gene expression after DCVC treatment in HTR-8 SVneo cells. Comparison of differential gene expression across DCVC treatment durations (6 versus 12 h) was evaluating by calculating pairwise correlation coefficients of logFC estimates (P < 1.0 × 10–15). Spaghetti plot depicting time-dependent expression levels for differential expressed genes meeting FDR and logFC criteria (FDR < 0.05 + logFC > 0.35 [FC > 1.3]) for a 10 µM DCVC and C) 20 µM DCVC treatment. Tan dots represent individual genes differentially expressed (FDR < 0.05 + logFC > 0.35 [FC > 1.3]) with 12-h treatment. Lines connecting yellow dots to tan dots represent the same respective genes with 6-h expression levels. Venn diagrams depicting overlap in differentially expressed genes (FDR < 0.05 + logFC > 0.35[FC > 1.3]) between 6 and 12 h DCVC treatment for: b 0 (control) vs.10 µM DCVC and d 0 (control) vs. 20 µM DCVC
Fig. 6
Fig. 6
Temporal patterns in regulation of gene expression in HTR-8/SVneo cells. Differentially expressed genes with logFC magnitude > 0.35 [FC > 1.3], regardless of FDR, were grouped together by treatment based on chronological expression patterns (upregulation, downregulated or no change) for the two treatment durations (6 and 12 h). There were a total of 8 groups for: a 10 µM DCVC and b 20 µM DCVC consistent responders (up → up and down → down), temporary responders (up → down, and down → up), early responders (down → no change and up → no change), and late responders (no change → up and no change → down). Groups that contained > 100 genes were tested for enrichment on the Enrichr platform for transcription factors (TF) and histone modifications (HM). The enrichment odds ratio is abbreviated EOR. TF and HM were considered to be significantly enriched with an FDR < 0.05
Fig. 7
Fig. 7
DCVC effect on ISR-associated ATF4 regulation of gene expression in HTR-8/SVneo cells. Because ATF4 transcriptional regulation is a key regulator of the ISR, ATF4 gene targets were tested for overrepresentation among DCVC-induced differentially expressed genes using a statistical enrichment test. a Venn diagram depicting overlap between the number of ATF4 gene targets and genes differentially expressed (FDR < 0.05 + logFC > 0.35[FC > 1.3]) after a 12-h exposure to 20 µM DCVC compared with control (P = 5.52 × 10–22). b Heatmap visualizing hierarchical clustering and logFC expression of 47 genes differentially expressed (FDR < 0.05 + logFC > 0.35[FC > 1.3]), after exposure to 20 µM DCVC for 12 h. Expression levels of other comparisons were included for reference purposes. c Visualization of ATF4 expression, along with the same 47 significantly expressed ATF4 and ATF4 + CHOP gene targets grouped by function and cell fate, with single gene-level logFC displayed. Genes displayed in blue are regulated by ATF4 alone, whereas genes displayed in salmon are co-regulated by ATF4 and CHOP
Fig. 7
Fig. 7
DCVC effect on ISR-associated ATF4 regulation of gene expression in HTR-8/SVneo cells. Because ATF4 transcriptional regulation is a key regulator of the ISR, ATF4 gene targets were tested for overrepresentation among DCVC-induced differentially expressed genes using a statistical enrichment test. a Venn diagram depicting overlap between the number of ATF4 gene targets and genes differentially expressed (FDR < 0.05 + logFC > 0.35[FC > 1.3]) after a 12-h exposure to 20 µM DCVC compared with control (P = 5.52 × 10–22). b Heatmap visualizing hierarchical clustering and logFC expression of 47 genes differentially expressed (FDR < 0.05 + logFC > 0.35[FC > 1.3]), after exposure to 20 µM DCVC for 12 h. Expression levels of other comparisons were included for reference purposes. c Visualization of ATF4 expression, along with the same 47 significantly expressed ATF4 and ATF4 + CHOP gene targets grouped by function and cell fate, with single gene-level logFC displayed. Genes displayed in blue are regulated by ATF4 alone, whereas genes displayed in salmon are co-regulated by ATF4 and CHOP
Fig. 8
Fig. 8
DCVC effect on principle proteins involved in ISR activation. HTR-8/SVneo cells were treated with 0 (control) or 20 μM DCVC for 12 h. Western blotting was used to measure eIF2α phosphorylation and ATF4 protein levels by a blot scanning system as described in the methods section. Graphical representation of: a relative eIF2α phosphorylation and b relative ATF4 protein concentrations normalized to total protein. Bars represent means ± SEM. Data were analyzed with student t-test. Asterisks indicate significant difference compared to control: *P < 0.05. N = 4 independent experiment, with 3 replicates per treatment in each experiment. Representative western blot images for c eIF2α/eIF2α and d ATF4 (All western blots are included in Suppl Fig. 7)
Fig. 9
Fig. 9
DCVC effects on global protein synthesis. HTR-8/SVneo cells were treated with 0 (control) or DCVC (10 or 20 μM) for 6 or 12 h. Protein synthesis was measured with O-propargyl-puromycin (OPP) and 5 FAM-azide fluorescent staining quantified by plate reader. Bars represent means ± SEM. Data were analyzed by two-way ANOVA (interaction between time and treatment, P = 0.019) with posthoc Tukey multiple comparisons. Plus sign indicates significant difference compared to control and 10 μM DCVC within same time point: +P < 0.05. N = 3 independent experiments for each time point, with 4 replicates per treatment in each experiment
Fig. 10
Fig. 10
Effects of DCVC on placental villous explant gene expression. First-trimester placental villous explants were treated in vitro with 0 (control) or 20 µM DCVC for 12 h. Differential gene expression was measured with edgeR using quasi-likelihood general linear modeling. N = 5 independent experiments, each performed with tissue obtained from a different placental donor. a Volcano plot comparing differential gene expression between non-treated and DCVC-treated villous explants. No genes were differentially expressed (FDR < 0.05). Genes fulfilling the following criteria are denoted by dark pink color: logFC magnitude > 0.35 [FC > 1.3]. b Upregulated and downregulated gene sets from the MSigDB hallmark collection identified through GSEA as enriched after DCVC treatment. Gene sets are ordered according to the magnitude of normalized enrichment score (NES) and were considered significantly enriched with an FDR < 0.05. Gene sets with an asterisk indicate that the pathways contained ISR/ATF4-regulated enriched genes (detailed information found in suppl. Table 6). Columns within grid denote biological categories to which gene sets belong (indicated by black square)
Fig. 11
Fig. 11
Relationship between placental villous explants and HTR-8/SVneo differential gene expression. In order to characterize the relationship between differential gene expression in first trimester villous explants and HTR-8/SVneo cells exposed to 20 µM DCVC for 12 h, respectively, Pearson’s correlation coefficients (r) were calculated for the pairwise comparison of logFC values, either for all dually expressed genes (11,913), or ATF4 gene targets only (383). Displayed are correlation plots of logFC in gene expression between tissue and cells for 0 (control) vs. 20 µM DCVC for: A) All genes (P < 1.0 × 10–15), or B) ATF4 gene targets only (P < 1.2 × 10–9). Pearson’s correlation coefficient values are shown on each respective correlation plot and trend lines are displayed in red
Fig. 12
Fig. 12
Summary of proposed DCVC-induced activation of the Integrated Stress Response. DCVC-induced mitochondrial dysfunction activates one or more of the eIF2α kinases. Kinase(s) phosphorylate eIF2α. Phosphorylated eIF2α activates transcription and translation of ATF4 and causes global protein attenuation. ATF4 transcription factor up-regulates many genes involved in biological processes necessary to restore homeostasis. ATF4 also up-regulates transcription factor CHOP, which then interacts with ATF4 to activate transcription of genes involved in cell death signaling

Similar articles

Cited by

References

    1. Andrews S (2010) FastQC: a quality control tool for high throughput sequence data. In: Bahraham Bioinformaticz. http://www.bioinformatics.babraham.ac.uk/projects/fastqc. Accessed 27 Feb 2019
    1. ATSDR (2016) Public Health Statement on Trichloroethylene. In: Agency for Toxic Substances and Disease Registry. https://www.atsdr.cdc.gov/ToxProfiles/tp19-c1.pdf Accessed 4 Nov 2019
    1. ATCC (2015) American Type Culture Collection Product Sheet: HTR8/SVneo (ATCC® CRL3271™). American Type Culture Collection
    1. Bao XR, Ong SE, Goldberger O, et al. Mitochondrial dysfunction remodels one-carbon metabolism in human cells. Elife. 2016 doi: 10.7554/eLife.10575. - DOI - PMC - PubMed
    1. Benjamini Y, Hochberg Y. Controlling the false discovery rate: A practical and powerful approach to multiple testing. J R Stat Soc: Ser B (Methodol) 1995;57:289–300.

Publication types