. 2021 Jun;143(22):2169-2187.
doi: 10.1161/CIRCULATIONAHA.120.052928. Epub 2021 Mar 17.

Single-Cell RNA Sequencing Uncovers Paracrine Functions of the Epicardial-Derived Cells in Arrhythmogenic Cardiomyopathy

Affiliations

Single-Cell RNA Sequencing Uncovers Paracrine Functions of the Epicardial-Derived Cells in Arrhythmogenic Cardiomyopathy

Ping Yuan et al. Circulation. 2021 Jun.

Abstract

Background: Arrhythmogenic cardiomyopathy (ACM) manifests with sudden death, arrhythmias, heart failure, apoptosis, and myocardial fibro-adipogenesis. The phenotype typically starts at the epicardium and advances transmurally. Mutations in genes encoding desmosome proteins, including DSP (desmoplakin), are major causes of ACM.

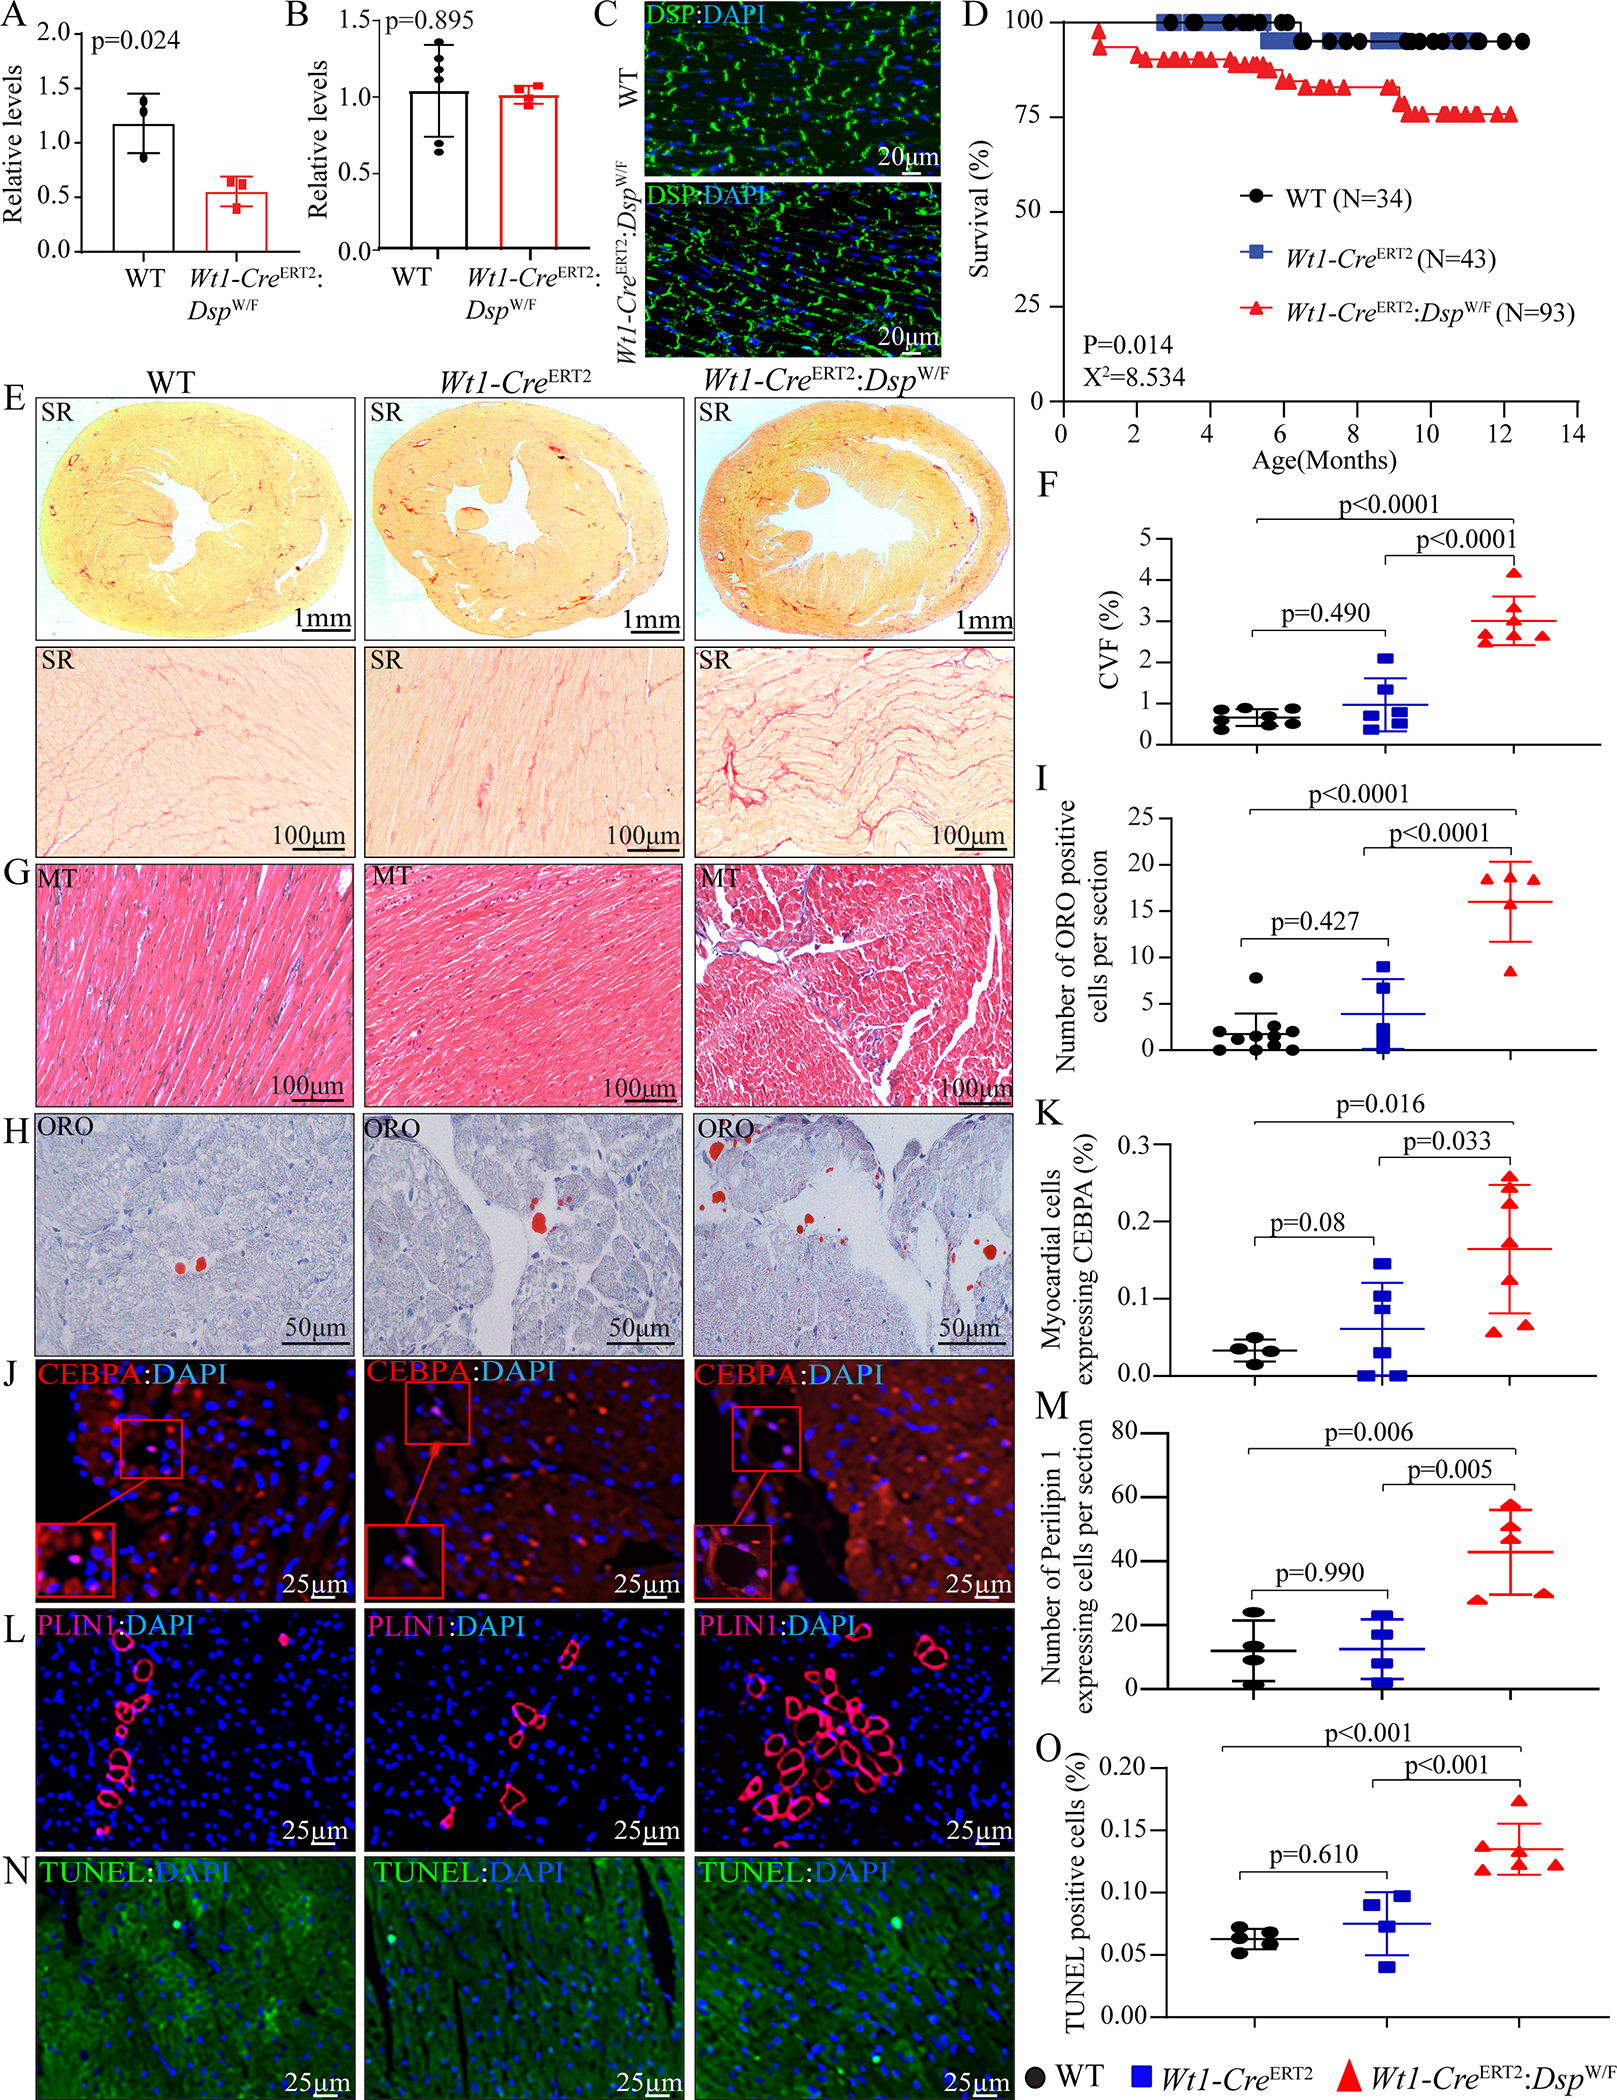
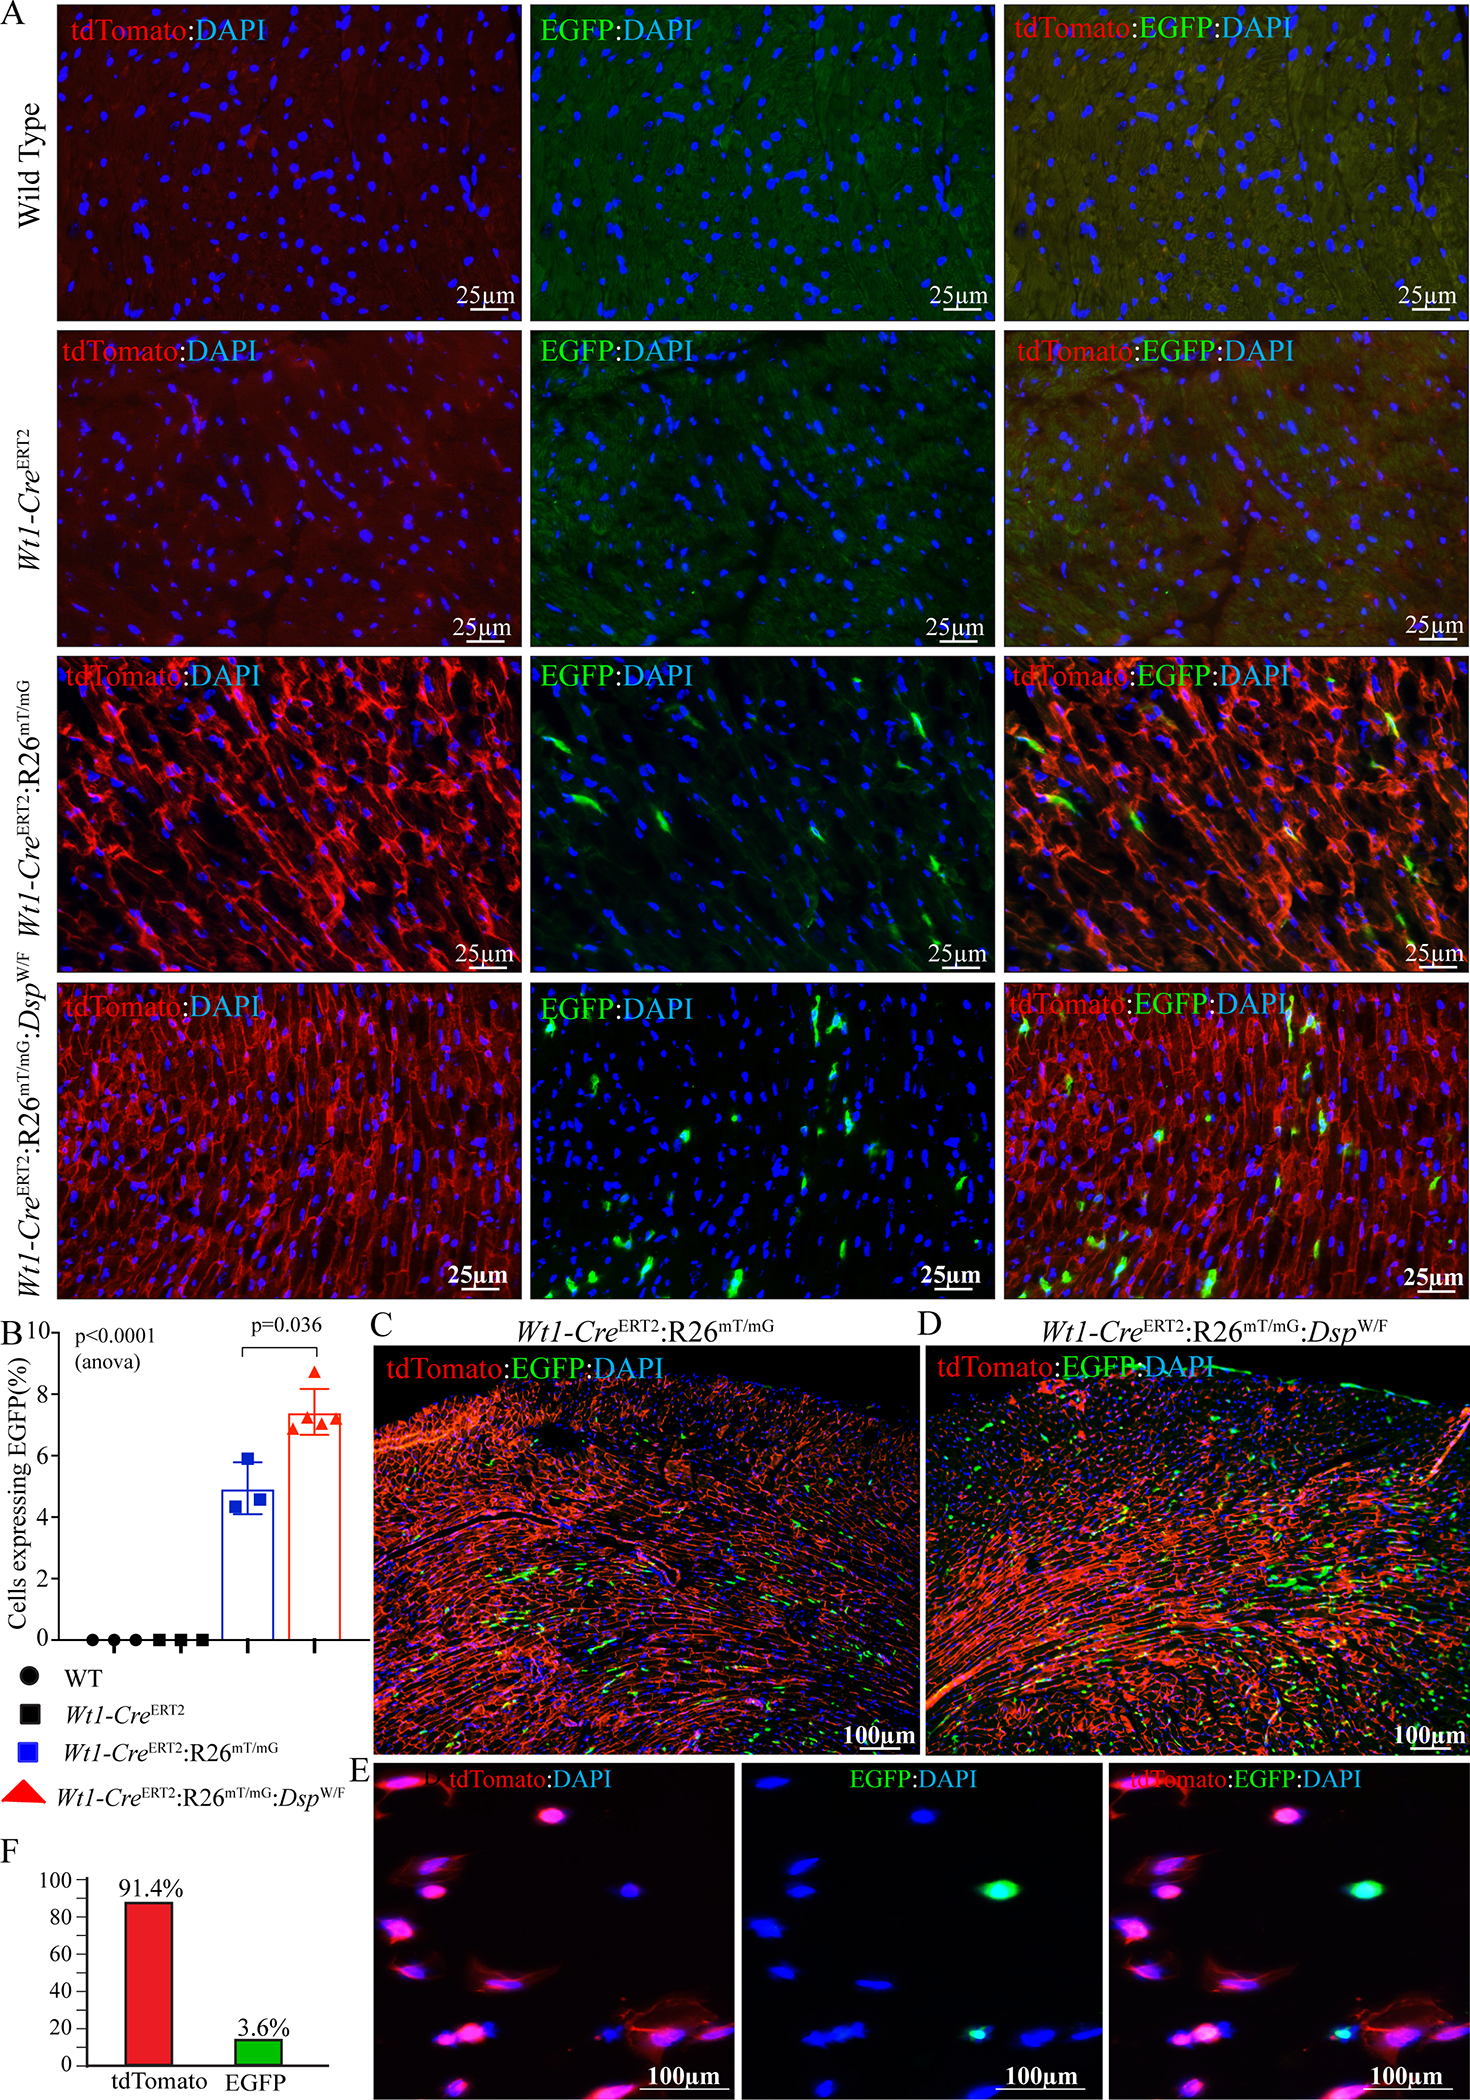
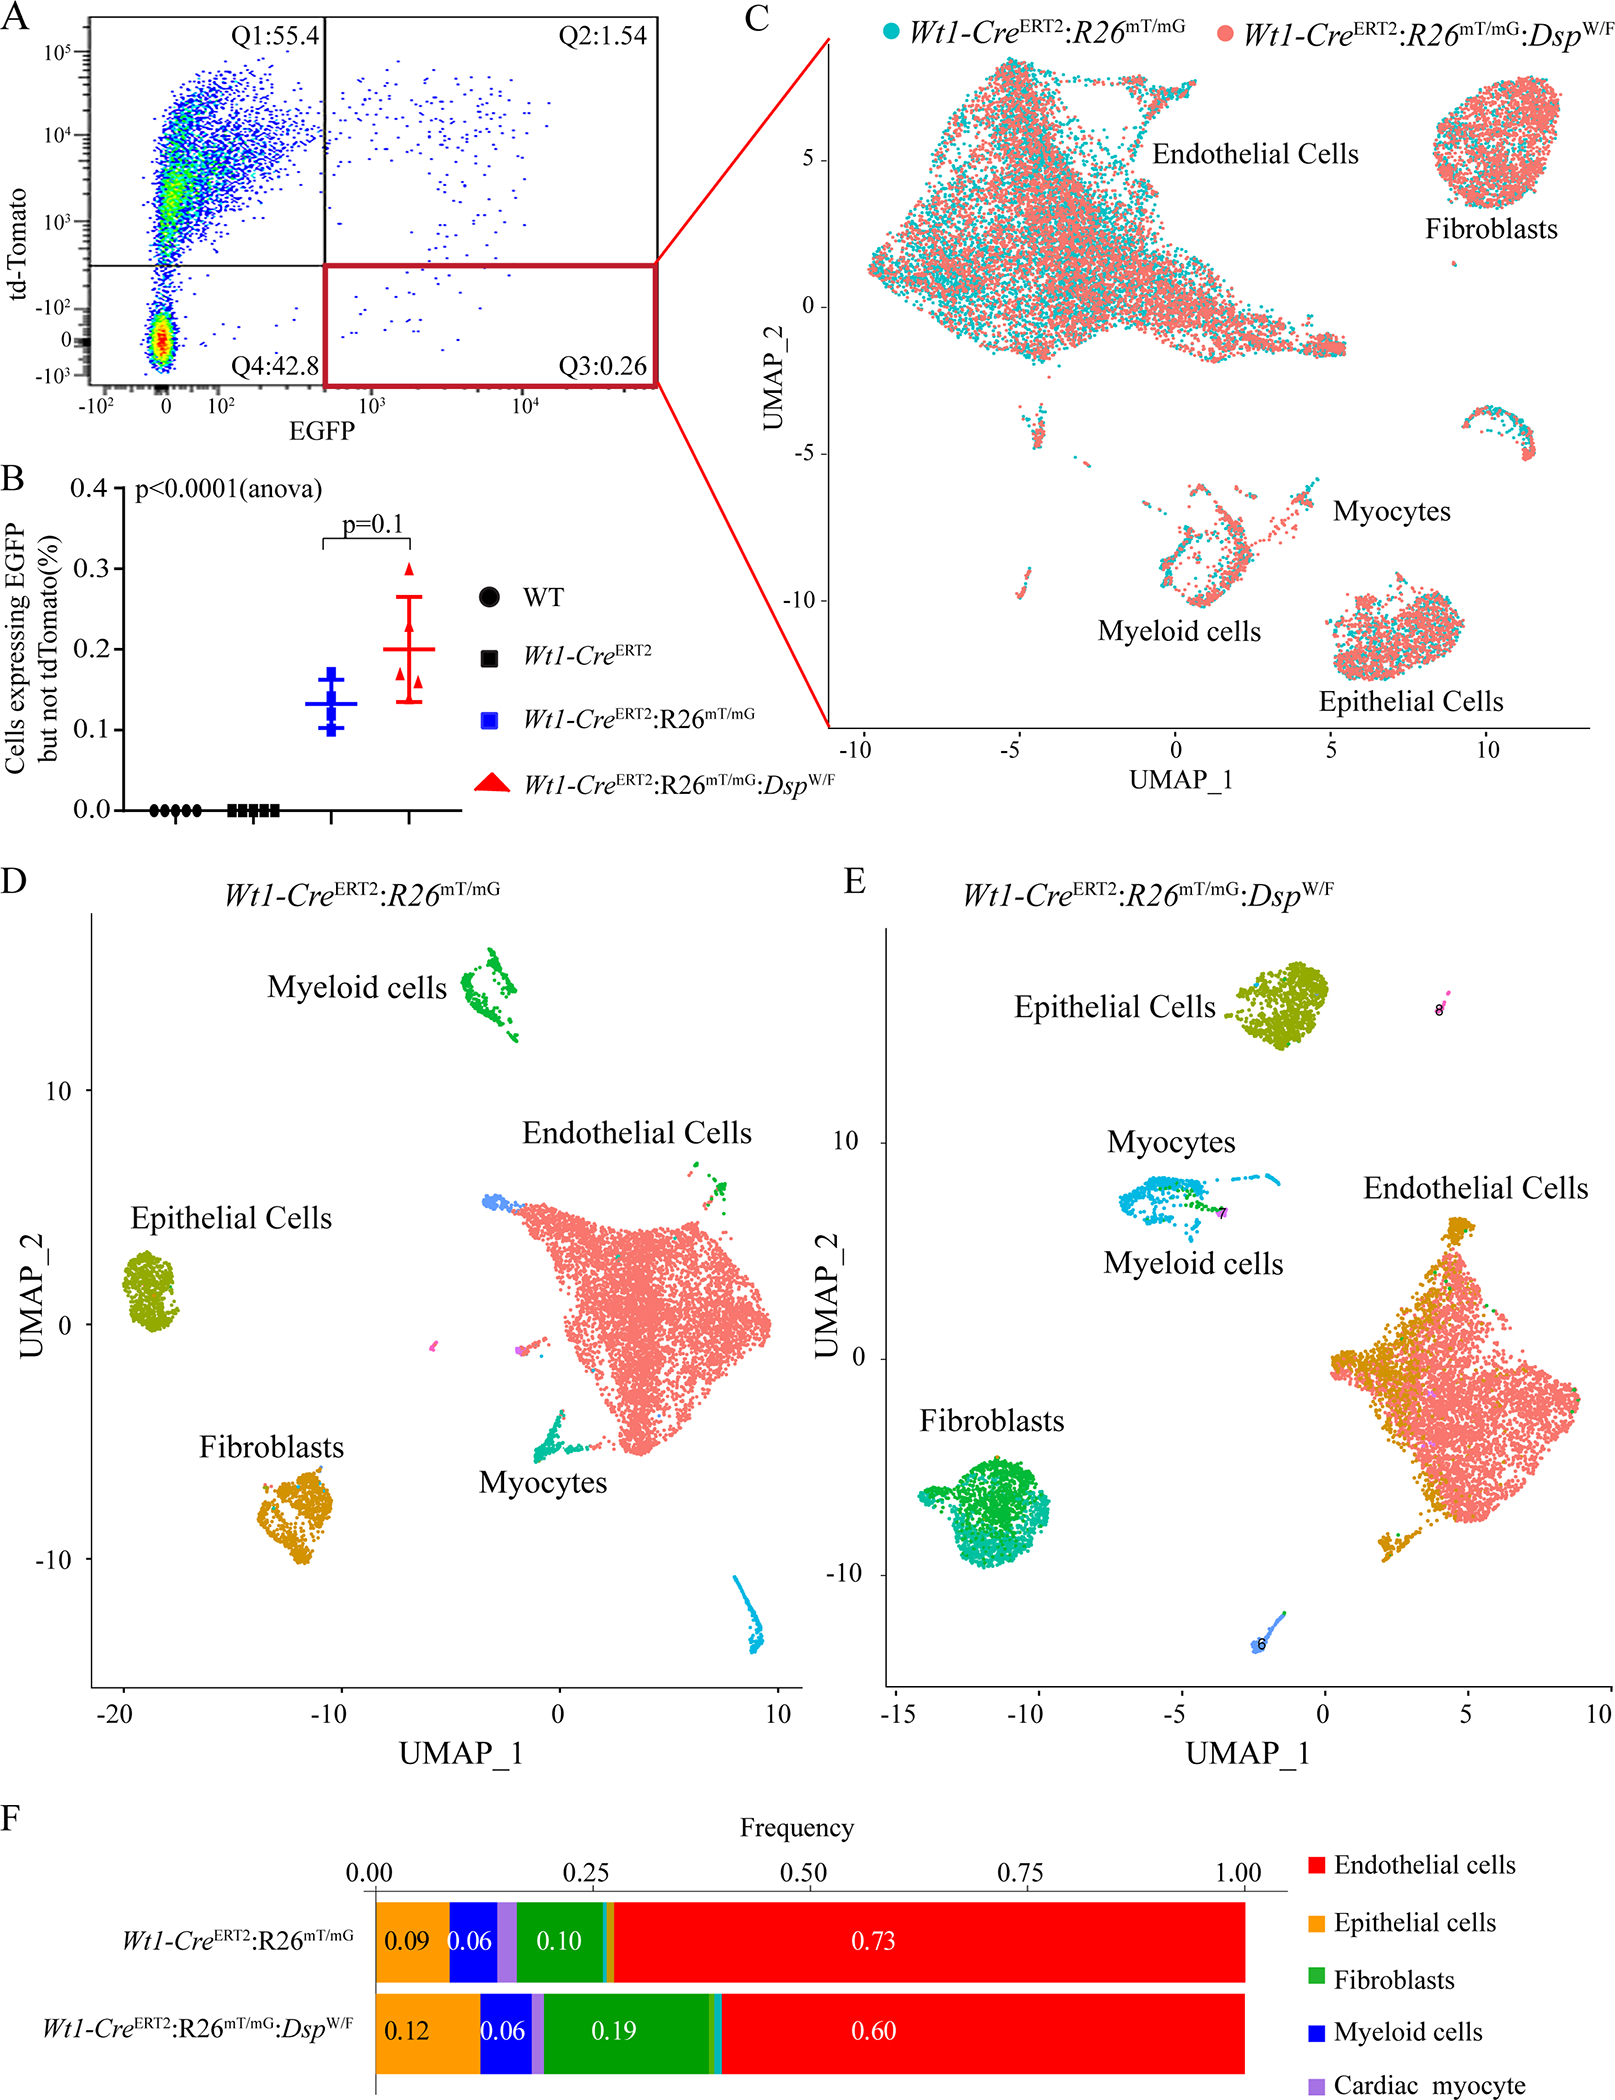
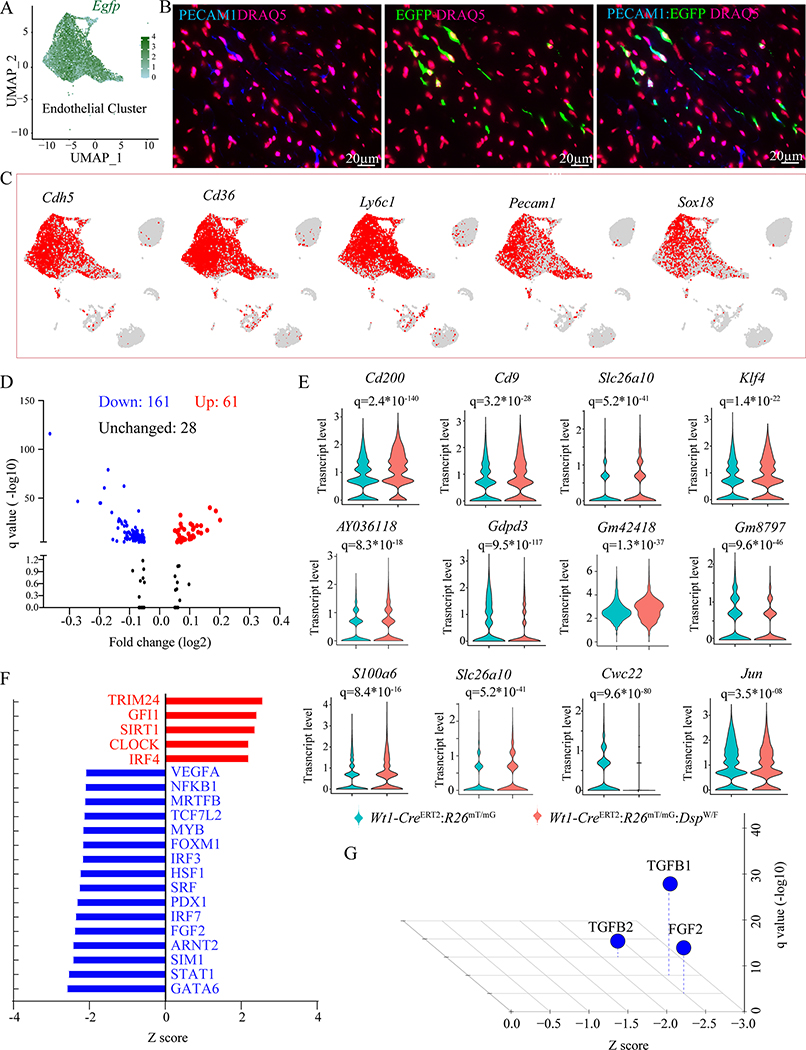
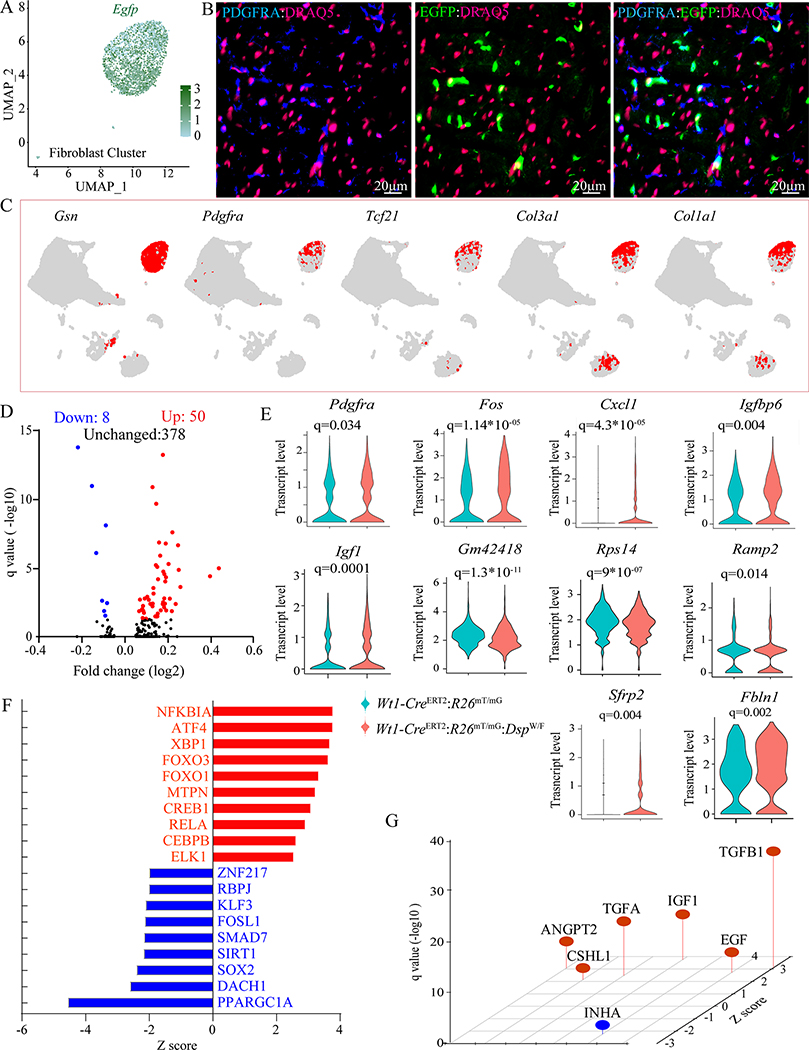
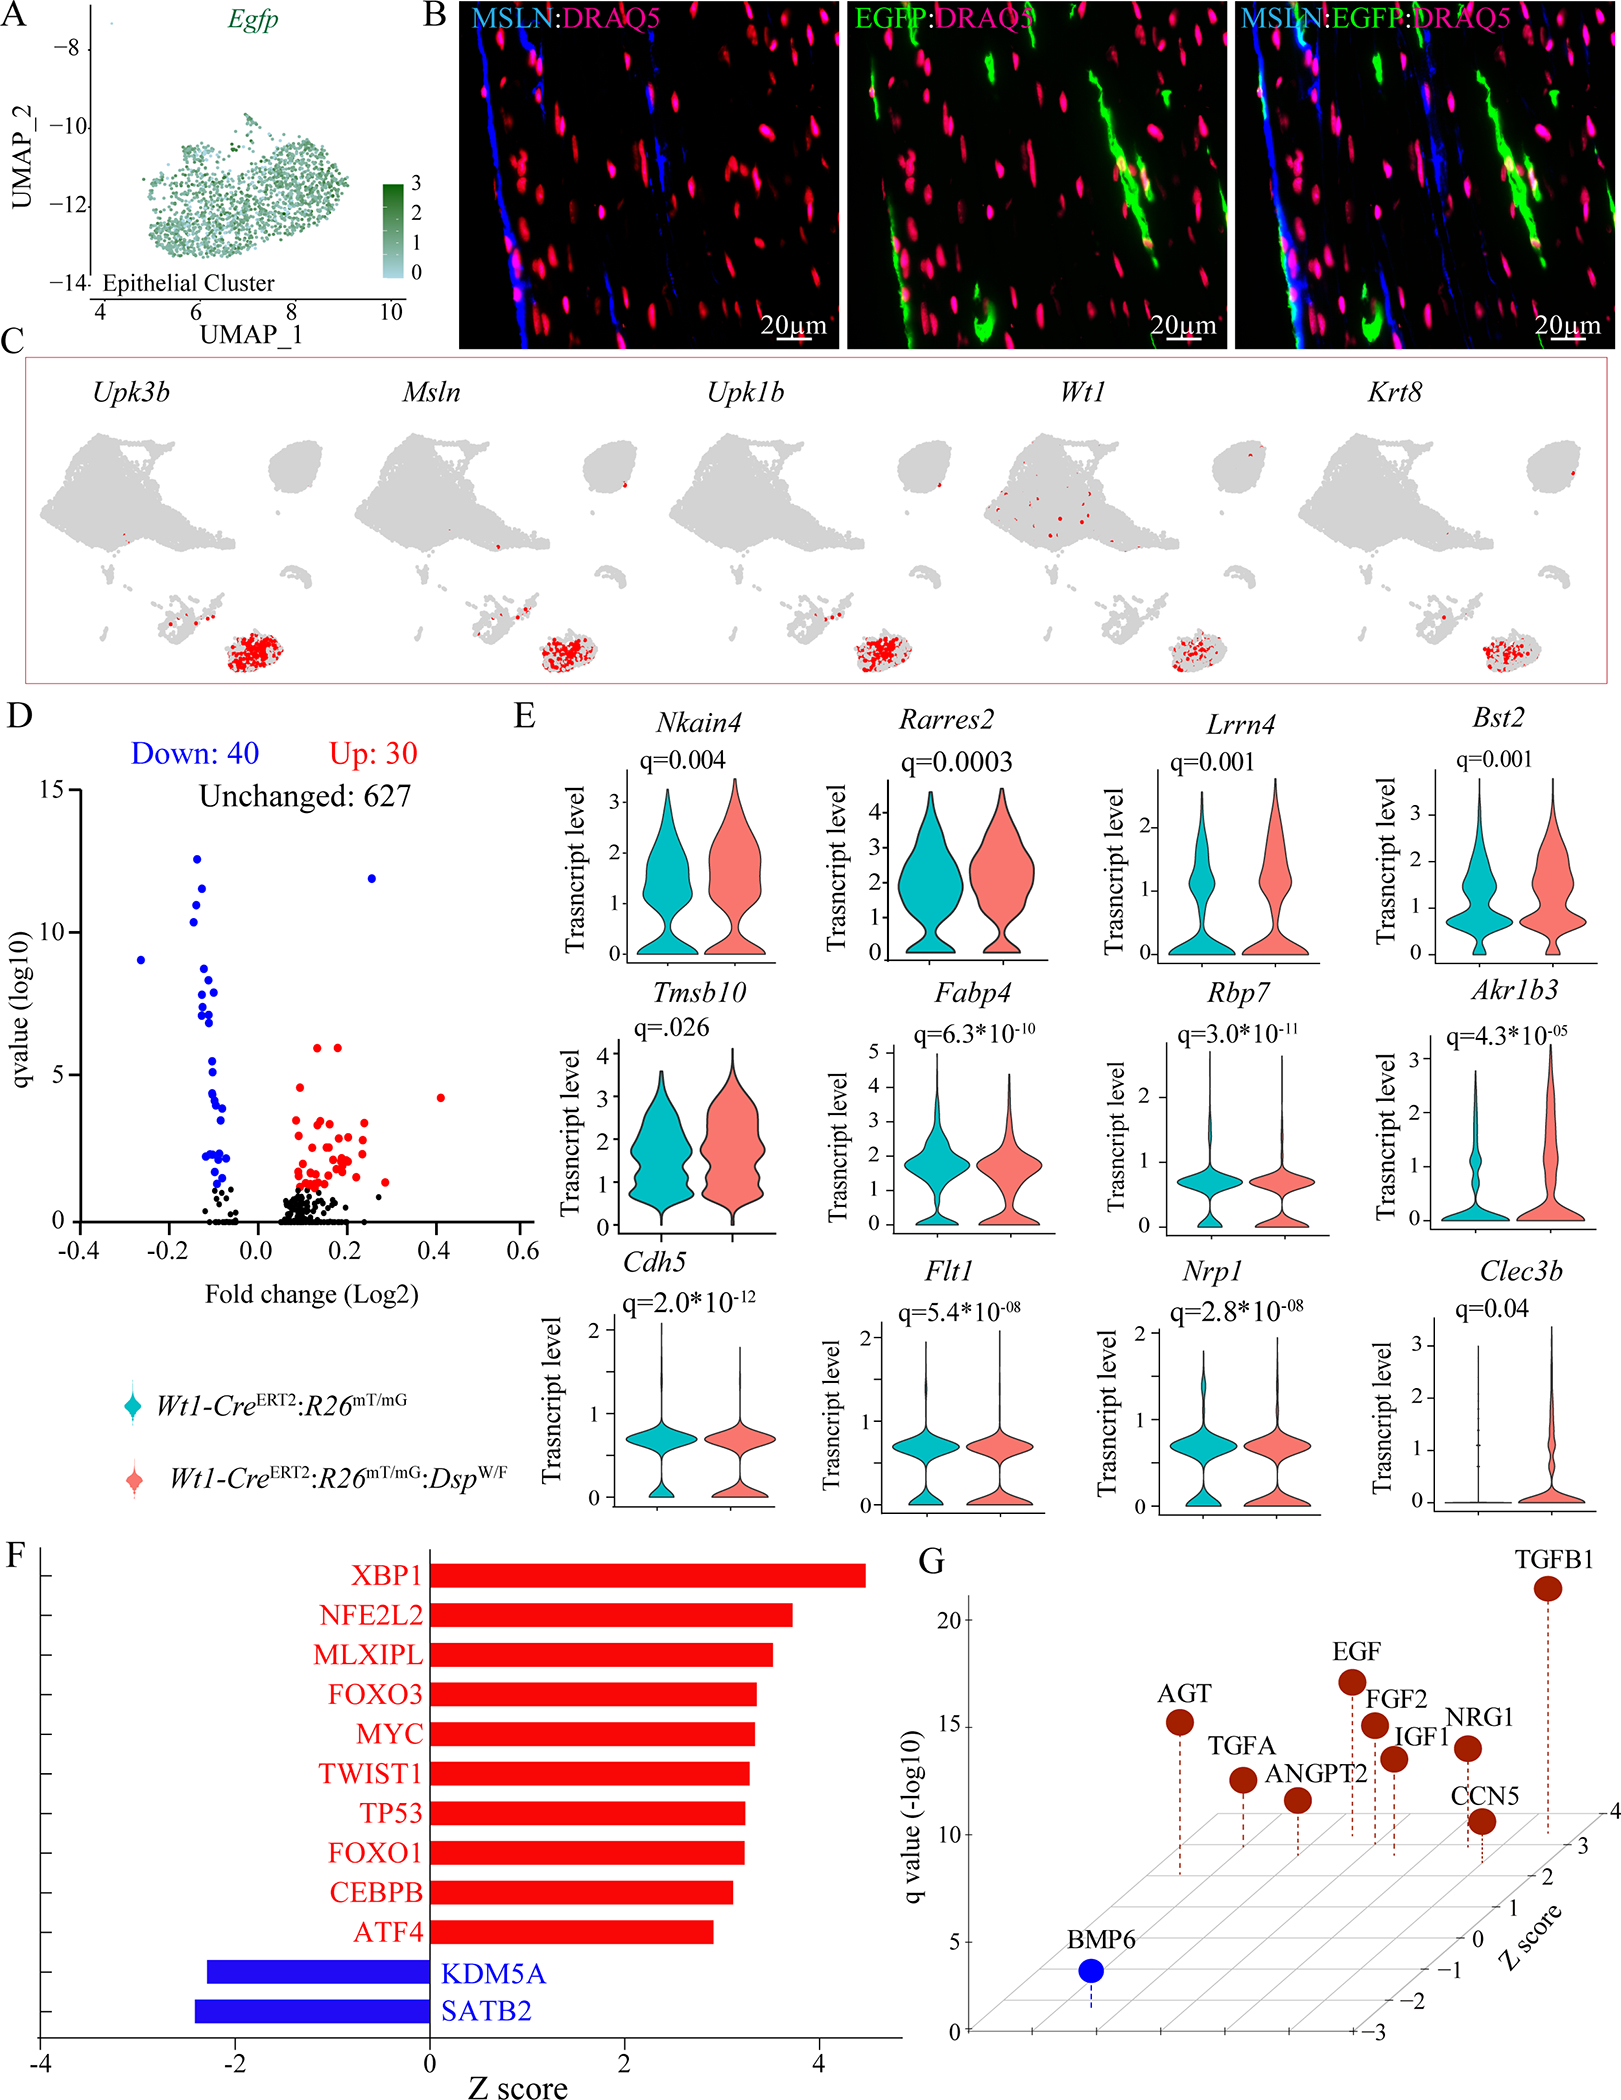
Methods: To delineate contributions of the epicardium to the pathogenesis of ACM, the Dsp allele was conditionally deleted in the epicardial cells in mice upon expression of tamoxifen-inducible Cre from the Wt1 locus. Wild type (WT) and Wt1-CreERT2:DspW/F were crossed to Rosa26mT/mG (R26mT/mG) dual reporter mice to tag the epicardial-derived cells with the EGFP (enhanced green fluorescent protein) reporter protein. Tagged epicardial-derived cells from adult Wt1-CreERT2:R26mT/mG and Wt1-CreERT2: R26mT/mG:DspW/F mouse hearts were isolated by fluorescence-activated cell staining and sequenced by single-cell RNA sequencing.

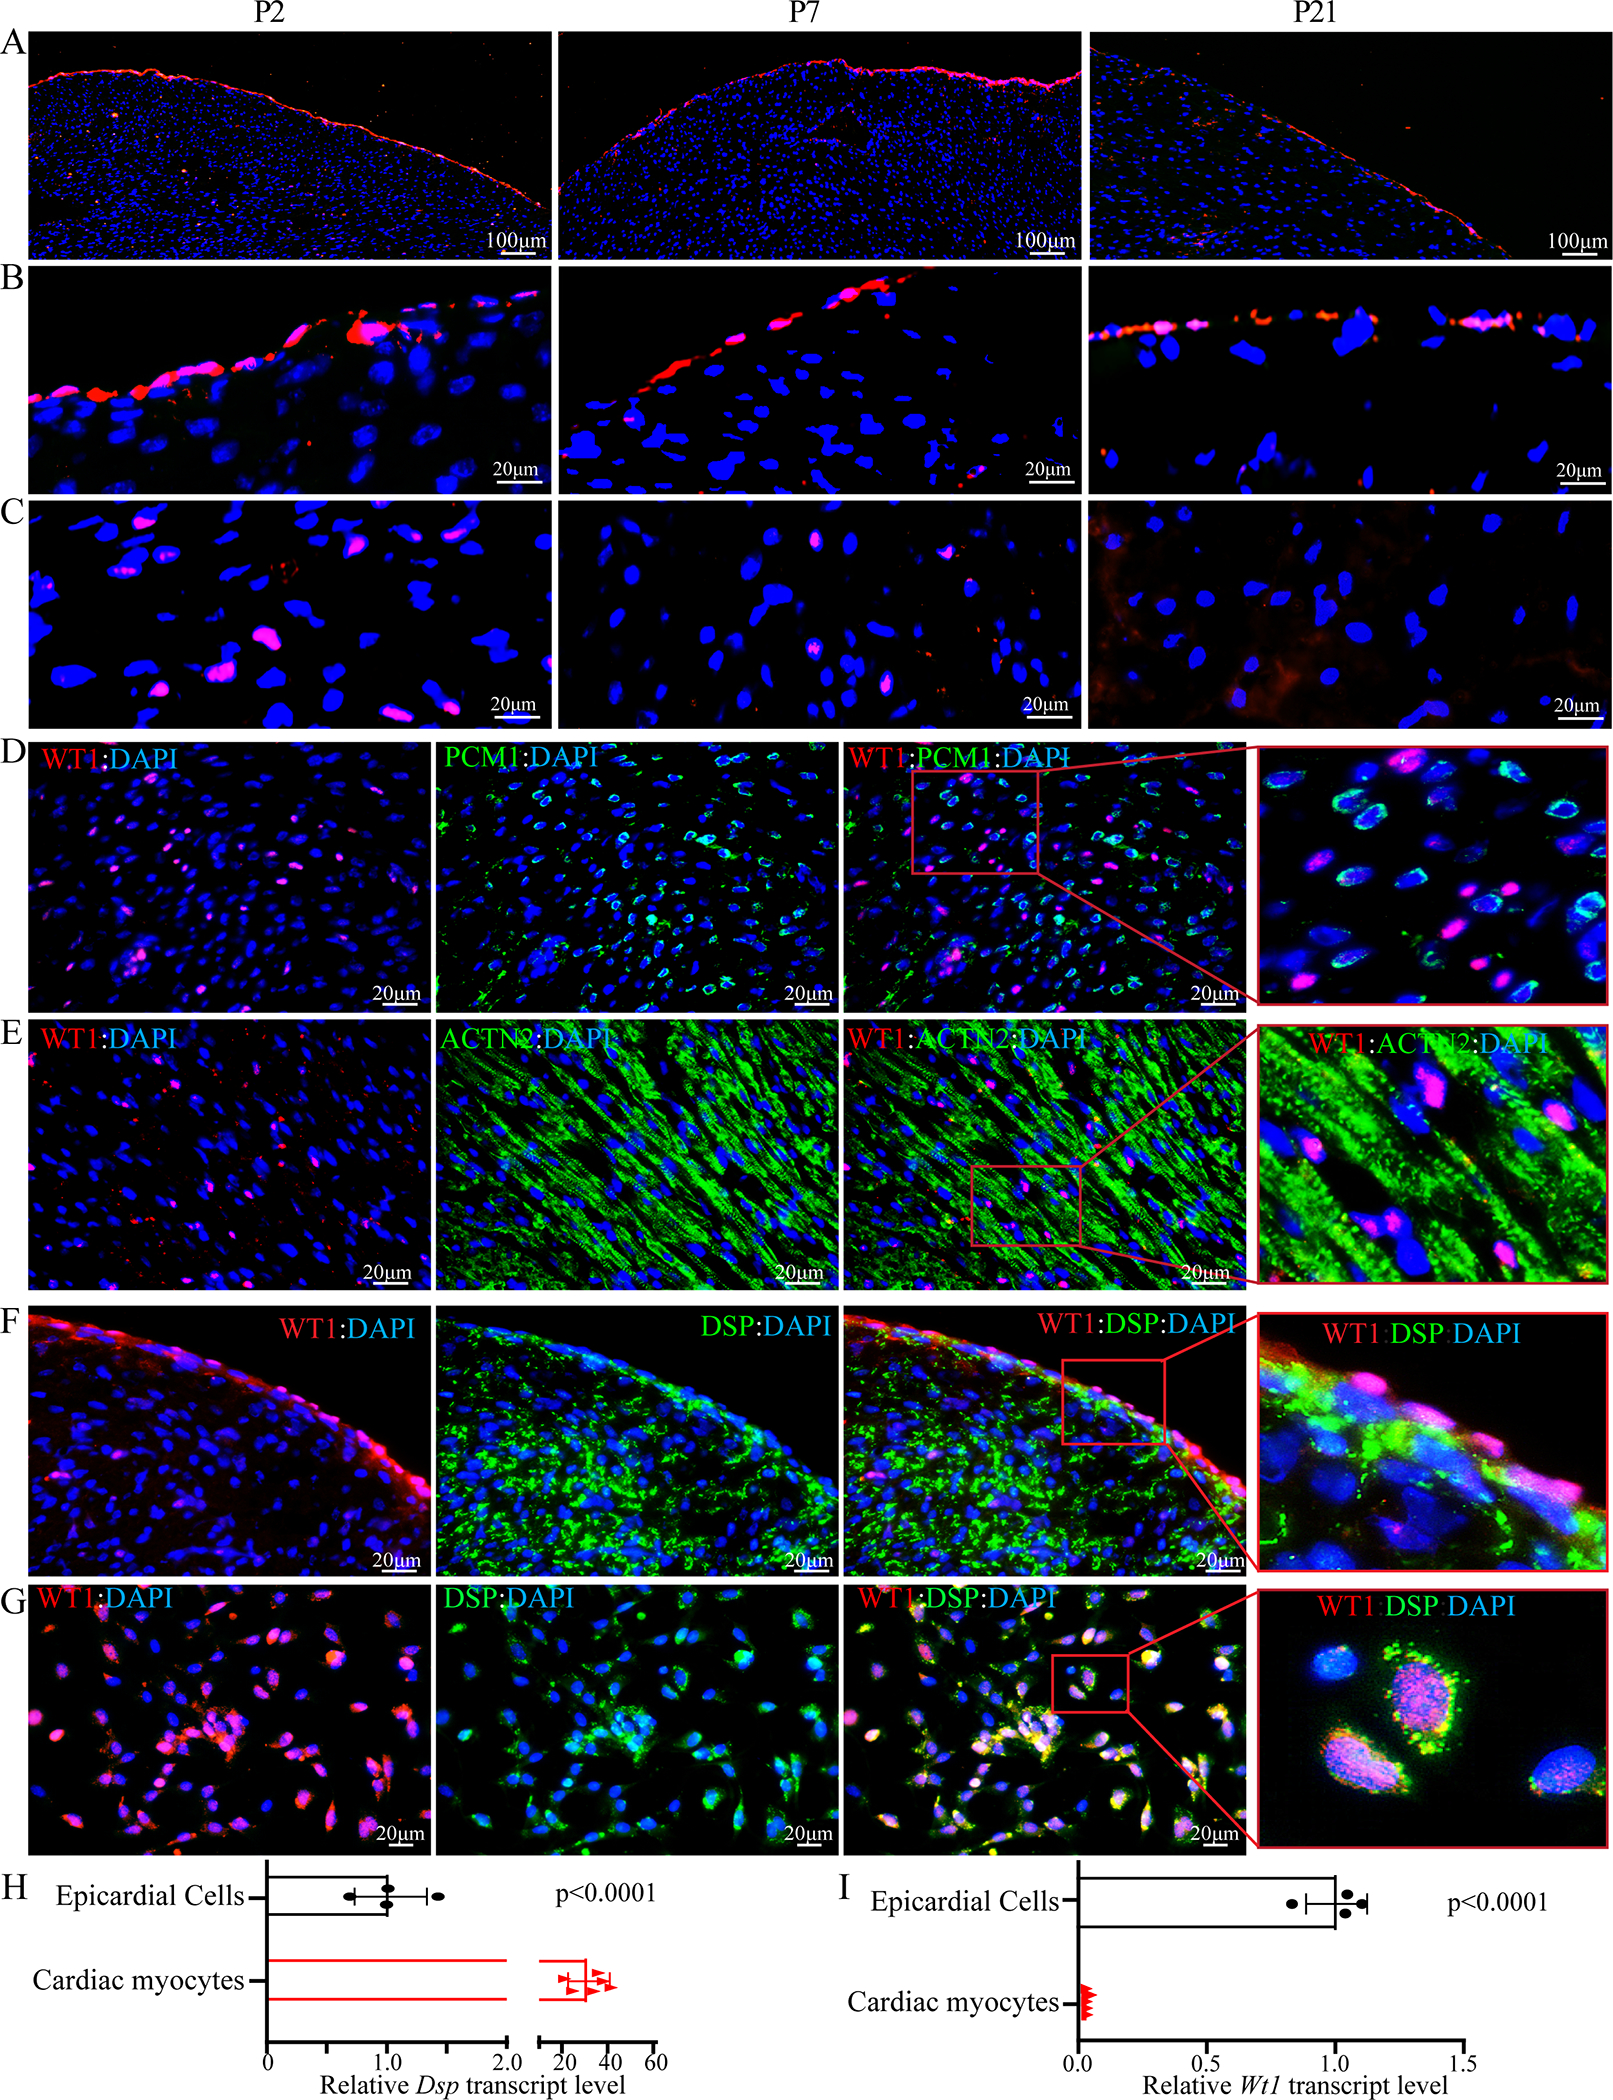
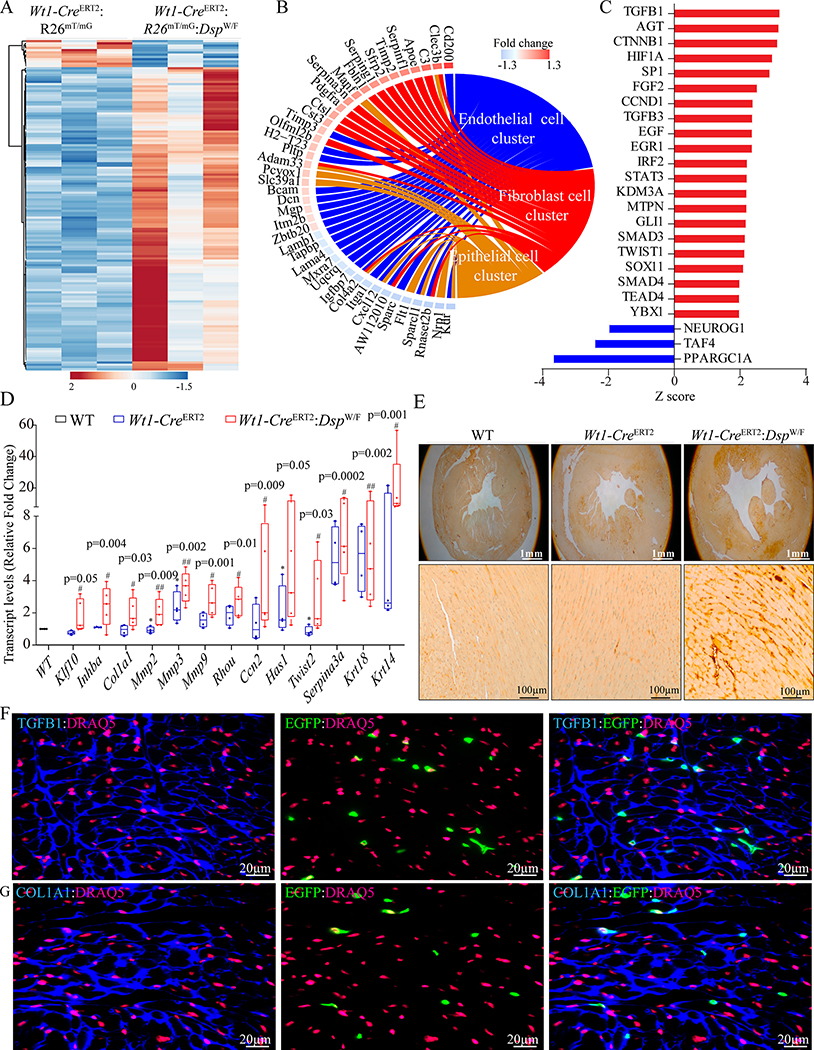
Results: WT1 (Wilms tumor 1) expression was progressively restricted postnatally and was exclusive to the epicardium by postnatal day 21. Expression of Dsp was reduced in the epicardial cells but not in cardiac myocytes in the Wt1-CreERT2:DspW/F mice. The Wt1-CreERT2:DspW/F mice exhibited premature death, cardiac dysfunction, arrhythmias, myocardial fibro-adipogenesis, and apoptosis. Single-cell RNA sequencing of ≈18 000 EGFP-tagged epicardial-derived cells identified genotype-independent clusters of endothelial cells, fibroblasts, epithelial cells, and a very small cluster of cardiac myocytes, which were confirmed on coimmunofluorescence staining of the myocardial sections. Differentially expressed genes between the paired clusters in the 2 genotypes predicted activation of the inflammatory and mitotic pathways-including the TGFβ1 (transforming growth factor β1) and fibroblast growth factors-in the epicardial-derived fibroblast and epithelial clusters, but predicted their suppression in the endothelial cell cluster. The findings were corroborated by analysis of gene expression in the pooled RNA-sequencing data, which identified predominant dysregulation of genes involved in epithelial-mesenchymal transition, and dysregulation of 146 genes encoding the secreted proteins (secretome), including genes in the TGFβ1 pathway. Activation of the TGFβ1 and its colocalization with fibrosis in the Wt1-CreERT2:R26mT/mG:DspW/F mouse heart was validated by complementary methods.

Conclusions: Epicardial-derived cardiac fibroblasts and epithelial cells express paracrine factors, including TGFβ1 and fibroblast growth factors, which mediate epithelial-mesenchymal transition, and contribute to the pathogenesis of myocardial fibrosis, apoptosis, arrhythmias, and cardiac dysfunction in a mouse model of ACM. The findings uncover contributions of the epicardial-derived cells to the pathogenesis of ACM.

Keywords: arrhythmias, cardiac; paracrine communication; pericardium; sequence analysis, RNA.


Conflict of interest statement

Disclosure

The authors declare that there is no actual or perceived potential conflict of interest and there has been none during the last two years.

Figures

Figure 1.
Figure 1.. Expression of WT1 and DSP in a subset of cardiac cells;
A. Low magnification immunofluorescence images depicting expression of WT1 (red), a marker of epicardial cells, in the postnatal day 2 (P2), day 7 (P7) and day 21 (P21) in the wild type (WT) mouse hearts. WT1 expression is progressively restricted with age, showing highest expression at P2 both in epicardium and myocardium. At P7, WT1 is predominantly expressed in the epicardium with few cells showing expression in the myocardium. However, at P21, WT1 expression is confined to few cells in the epicardium. Nuclei were counter stained with DAPI (blue). B. High magnification immunofluorescence images depicting the expression of WT1 (red) protein in the epicardial region of thin myocardial sections obtained from P2, P7 and P21 mice (N=3 per group). Nuclei were stained with DAPI (blue). C. High magnification immunofluorescence panels showing expression of WT1 in the intra myocardial cells (shown in red) at P2, P7 and P21. Nuclei were counterstained with DAPI (blue). D. Co-staining of WT1 (red) and PCM1 (green), a marker of cardiac myocytes, in the myocardial sections obtained from P2 mouse hearts. An enlarged panel on the right side showing exclusive expression of PCM1 and WT1. E. Immunofluorescence staining of myocardial sections from P2 mouse hearts with an antibody against WT1 (red) and ACTN2 (green), the latter also a marker of cardiac myocytes. Nuclei were stained with DAPI (blue). An enlarged panel shown on the right depicting absence of expression of WT1 in the cardiac myocytes. F. Co-expression of WT1 (red) and DSP (green) in the epicardium and subepicardial regions of P2 mouse hearts. An enlarged panel is shown to the right, which illustrates expression of both proteins in the epicardial region. Nuclei were counterstained with DAPI (blue). G. Co-Expression of WT1 (red) and DSP (green) proteins in the isolated epicardial cells, as detected by immunostaining with antibodies against WT1 and DSP proteins. Nuclei were counter stained with DAPI (blue). An enlarged panel is shown on the right side, which illustrates expression of DSP in the isolated epicardial cells, marked by the expression of WT1. H. RT-PCR data depicting relative transcript levels of Dsp in the epicardial cells and cardiac myocytes (N=4 to 6 per group). I. RT-PCR data depicting relative transcript levels of Wt1 in the epicardial cells and cardiac myocytes (N=4 to 6 per group).
Figure 2.
Figure 2.. Conditional deletion of Dsp in epicardial cells phenocopies ACM.
A. Relative mRNA expression levels of Dsp in epicardial cells isolated from wild type (WT) and Wt1-CreERT2: DspW/F mice at 3 months of age (N=3). B. RT-PCR analysis of the Dsp transcripts in isolated cardiac myocytes of Wt1-CreERT2: DspW/F mice compared to the WT group at 3 months of age (N=4–6). C. Immunofluorescence (IF) staining of thin myocardial sections showing intact DSP protein expression and localization at the intercalated discs in WT and Wt1-CreERT2: DspW/F groups. D. Kaplan–Meier survival plot of WT (N=34), Wt1-CreERT2 (N=43), and Wt1-CreERT2:DspW/F (N=93) mice, the latter two groups treated with tamoxifen (30 mg/Kg/d) from P2 to P7. E. Representative Picrosirius Red (SR) stained myocardial sections from 6-month-old WT, Wt1-CreERT2, and Wt1-CreERT2: DspW/F mice, the upper panel represents low magnification and the lower panel represents higher magnification. F. Quantification of SR stained sections represented as collagen volume fraction (CVF) in WT (N=8), Wt1-CreERT2 (N=6), and Wt1-CreERT2:DspW/F(N=7) mice. G. Representative Masson’s trichrome (MT)-stained myocardial sections from 6-month-old WT, Wt1-CreERT2, and Wt1-CreERT2: DspW/F mice. H. Representative Oil Red O (ORO)-stained thin myocardial sections from 6-month-old WT, Wt1-CreERT2, and Wt1-CreERT2: DspW/F mice. I. Quantitative data showing the number of Oil Red-O positive cells per section in WT (N=11), Wt1-CreERT2 (N=5), and Wt1-CreERT2: DspW/F (N=5) mice. J. IF staining of thin myocardial sections for CEBPA (in red) in 6-month-old WT, Wt1-CreERT2, and Wt1-CreERT2: DspW/F mice. Nuclei were counterstained with DAPI (blue). K. Quantitation of CEBPA positive myocardial cells in WT (N=4), Wt1-CreERT2(N=6), and Wt1-CreERT2:DspW/F(N=7) mice. L. Representative IF staining of thin myocardial sections showing PLIN1 (far red color) in 6-month-old WT, Wt1-CreERT2, and Wt1-CreERT2: DspW/F. Nuclei were counterstained with DAPI (blue). M. Quantitation of PLIN1 expressing cells in the myocardial section of WT (N=4), Wt1-CreERT2(N=4), and Wt1-CreERT2:DspW/F(N=5) mice. N. IF staining of thin myocardial sections showing TUNEL positive cells (in green) in 6-month-old WT, Wt1-CreERT2, and Wt1-CreERT2: Dsp W/F mice. Nuclei were counterstained with DAPI (blue). O. TUNEL positive cells in the myocardium of WT (N=5), Wt1-CreERT2 (N=4), and Wt1-CreERT2:DspW/F (N=6) mice. Statistical significance was determined by unpaired student t-test in two-group comparisons and One- way ANOVA followed by Bonferroni pairwise comparison test in multiple groups. All ANOVA p values were < 0.001.
Figure 3.
Figure 3.. Detection of membrane-bound EGFP positive epicardial derived cells (EDCs) under the control of Wt1 locus
A. IF staining of thin myocardial sections showing membrane-bound td-Tomato (in red) and EGFP (in green) positive cells in 3–6 months old WT, Wt1-CreERT2, Wt1-CreERT2:R26mTmG, and Wt1-CreERT2:R26mTmG:DspW/F mice. Nuclei were counterstained with DAPI (blue). Mice were matched for the mean age and sex in all experiments. B. EGFP positive cells quantified in the myocardium of WT (n=3), Wt1-CreERT2 (N=3), Wt1-CreERT2:R26mTmG (n=3), and Wt1-CreERT2:R26mTmG:DspW/F (N=5) mice. C. Low magnification immunofluorescence panel showing distribution of the EGFP expressing cells within the Wt1-CreERT2:R26mTmG mouse heart. D. Low magnification immunofluorescence panel showing distribution of the EGFP expressing cells within the Wt1-CreERT2:R26mTmG:DspW/F mouse heart. E. IF staining of td-Tomato (in red) and EGFP (in green) positive cells in the non-myocyte fraction of 3–6 months old Wt1-CreERT2:R26mTmG:DspW/F hearts. Nuclei were counterstained with DAPI (blue). F. Bar graph depicting percentage of the isolated epicardial cells from the Wt1-CreERT2:R26mTmG:DspW/F mouse hearts expressing only EGFP and tdTomato. P values were determined by One-way ANOVA (shown) followed by Bonferroni pairwise comparison test (only those p<0.05 are shown).
Figure 4.
Figure 4.. Isolation of tagged EDCs and single cell RNA-sequencing (scRNA-Seq)
A. Fluorescent activated cell sorting (FACS) analysis of EGFP positive cells from the non-myocytes fraction of 3–6 months old Wt1-CreERT2:R26mTmG:DspW/F mice. Q1: td-Tomato positive cells; Q2: both td-Tomato and EGFP positive cells, which reflects the overlap of the fluorescence signals of EGFP and tdTomato; Q3: EGFP positive cells; Q4: td-Tomato and EGFP negative cells. Only cells in the Q3, which likely reflects a fraction of all recombined cells, were used for single cell RNA-Seq. B. Quantitation of FACS data showing % EGFP positive cells sorted from WT (n=5), Wt1-CreERT2 (n=5), Wt1-CreERT2:R26mTmG (n=4), and Wt1-CreERT2:R26mTmG:DspW/F(n=5) mice. C. Aggregated UMAP plot showing cell clusters from FACS sorted EGFP positive EDCs generated from Wt1-CreERT2: R26mTmG (n=3, shown in blue), and Wt1-CreERT2:R26mTmG:DspW/F (n=3, shown in red) mice. Three major clusters were identified after removal of the mitochondrial enriched cluster, includes endothelial cells, fibroblast, and epithelial cells. A very small cluster of cardiac myocytes in combination with various myeloid cells was also detected. D. and E: UMAP plots of genotype-dependent cell clusters generated from Wt1-CreERT2:R26mTmG (N=3) and Wt1-CreERT2:R26mTmG:DspW/F (N=3) mice. F. Column graph representing the frequency of cells in different cell clusters obtained from scRNA seq in EDCs derived from Wt1-CreERT2:R26mT/mG and Wt1-CreERT2:R26mT/mG:DspW/F mice.
Figure 5.
Figure 5.. Differentially expressed genes (DEGs) in the EC cluster
A. UMAP depicting Egfp transcript levels in cells mapped to the EC cluster, showing Egfp transcripts in the vast majority of the ECs. B. Immunofluorescence panels showing co-expression of PECAM1 (blue), an EC marker, and EGFP (green), which identified the EDCs, showing co-expression of PECAM1 and EGFP in the myocardial section of Wt1-CreERT2:R26mT/mG:DspW/F mice. Nuclei were counterstained with DRAQ5 (far red) C. Feature plot showing expression of selected endothelial cell-specific genes visualized on the UMAP plots, depicting their expression in the largest cluster. D. Volcano plot showing upregulated and down-regulated transcript levels of DEGs in the endothelial cell clusters between Wt1-CreERT2:R26mT/mG and Wt1-CreERT2:R26mT/mG:DspW/F genotypes. Plots were constructed for DEGs that showed a log(2) fold change of 0.05 or greater in their transcript levels. E. Violin plots of a dozen DEGs between the two genotypes depicting transcript levels as well as distribution of gene transcripts. F. Dysregulated TRs as predicted by IPA in the endothelial cell cluster in the Wt1-CreERT2:R26mT/mG:DspW/F genotype. G. Dysregulated trophic and mitotic factors in the endothelial cell cluster in the Wt1-CreERT2:R26mT/mG:DspW/F showing suppression of TGFβ1, FGF2 and TGFβ2.
Figure 6.
Figure 6.. DEGs in the fibroblast cluster
A. UMAP depicting Egfp transcript levels in cells mapped to the fibroblast cluster, showing Egfp transcripts in the vast majority of the fibroblasts. B. Immunofluorescence panels showing co-expression of PDGFRA (blue), a fibroblast marker, and EGFP (green), which identifies the EDCs, showing co-expression of PDGFRA and EGFP in the myocardial sections of Wt1-CreERT2:R26mT/mG:DspW/F mice. Nuclei were counterstained with DRAQ5 (far red). C. Feature plot showing expression of selected fibroblast-specific genes visualized on the UMAP plots, depicting their expression in the epithelial cluster. D. Volcano plot showing upregulated and down-regulated transcript levels of DEGs in the fibroblast clusters between Wt1-CreERT2:R26mT/mG and Wt1-CreERT2:R26mT/mG:DspW/F genotypes. Plots were constructed for DEGs that showed a log(2) fold change of 0.05 or greater in their transcript levels. E. Violin plots of a dozen DEGs between the two genotypes depicting transcript levels as well as distribution. F. Dysregulated TRs as predicted by IPA in the fibroblast cluster in the Wt1-CreERT2:R26mT/mG:DspW/F genotype. G. Dysregulated trophic and mitotic factors in the fibroblast cluster in the Wt1-CreERT2:R26mT/mG:DspW/F showing activation of the TGFβ1 pathway.
Figure 7.
Figure 7.. DEGs in the epithelial cell clusters
A. UMAP depicting Egfp transcript levels in cells mapped to the epithelial cell cluster, showing Egfp transcripts in the vast majority of the epithelial cells. B. Immunofluorescence panels showing co-expression of MSLN (blue) tagging epithelial cells and EGFP (green), which identified EDCs in the epicardium of Wt1-CreERT2:R26mT/mG:DspW/F mice. C. Feature plot showing expression of selected epithelial cell specific genes visualized on the UMAP plots depicting their expression in the epithelial cell cluster. D. Volcano plot showing DEGs in the epithelial cell clusters between Wt1-CreERT2:R26mT/mG and Wt1-CreERT2:R26mT/mG:DspW/F genotypes. E. Violin plots of a dozen DEGs between the two genotypes depicting transcript levels as well as the number of cells expressing the transcripts. F. Dysregulated TRs as predicted by IPA from the DEGs (p<0.05) in the epithelial cell cluster in the Wt1-CreERT2:R26mT/mG:DspW/F genotype. G. Dysregulated trophic and mitotic factors in the epithelial cell cluster in the Wt1-CreERT2:R26mT/mG:DspW/F predicting activation of the TGFβ1 pathway.
Figure 8.
Figure 8.. Identification and validation of secretome related DEGs in the EDCs
A. Heat map of DEGs encoding secreted proteins (secretome) from EDCs of Wt1-CreERT2: R26mT/mG and Wt1-CreERT2: R26mT/mG: DspW/F mice obtained from analysis of pooled scRNA-Seq samples. B. Circos map of DEGs encoding secretome in the major clusters showing activation of a subset of the DEGs in the fibroblast and epithelial clusters and their suppression in the endothelial cluster. C. Predicted activation and suppression of the TRs and trophic/mitotic factors based on the DEGs encoding secretome D. RT-PCR validation of TGFβ1 target genes in the whole heart tissue of 6 month old WT (n=4), Wt1-CreERT2 (n=4), and Wt1-CreERT2:DspW/F (n=4) mice. p-values were determined by One-way ANOVA followed by Bonferroni pairwise comparison test. E. Representative Immunohistochemistry panels showing the expression of TGFβ proteins in the myocardium of 6 month old WT, Wt1-CreERT2, and Wt1-CreERT2:DspW/F mice. F. Immunofluorescence panels showing thin myocardial sections stained for the co-expression of TGFβ (blue) and EGFP (green), showing expression of the TGFβ1 in cells expressing EGFP in the myocardial sections from the Wt1-CreERT2:R26mT/mG:DspW/F mice. Nuclei were counterstained with DRAQ5 (far red) G. Thin myocardial sections immune-stained for the expression of COL1A1 (blue), a maker for fibroblasts/fibrosis and EGFP (green), showing partial co-expression in the myocardial sections from the Wt1-CreERT2:Rosa26mT/mG:DspW/F mice. Nuclei were counterstained with DRAQ5 (far red).

Similar articles

Cited by

References

    1. Corrado D, Basso C and Judge DP. Arrhythmogenic Cardiomyopathy. Circ Res. 2017;121:784–802. - PubMed
    1. Gandjbakhch E, Redheuil A, Pousset F, Charron P and Frank R. Clinical Diagnosis, Imaging, and Genetics of Arrhythmogenic Right Ventricular Cardiomyopathy/Dysplasia: JACC State-of-the-Art Review. J Am Coll Cardiol. 2018;72:784–804. - PubMed
    1. Finocchiaro G, Papadakis M, Robertus JL, Dhutia H, Steriotis AK, Tome M, Mellor G, Merghani A, Malhotra A, Behr E, et al. Etiology of Sudden Death in Sports: Insights From a United Kingdom Regional Registry. J Am Coll Cardiol. 2016;67:2108–2115. - PubMed
    1. Thiene G, Nava A, Corrado D, Rossi L and Pennelli N. Right ventricular cardiomyopathy and sudden death in young people. N Engl J Med. 1988;318:129–133. - PubMed
    1. Corrado D, Basso C, Thiene G, McKenna WJ, Davies MJ, Fontaliran F, Nava A, Silvestri F, Blomstrom-Lundqvist C, Wlodarska EK, et al. Spectrum of clinicopathologic manifestations of arrhythmogenic right ventricular cardiomyopathy/dysplasia: a multicenter study. J Am Coll Cardiol. 1997;30:1512–1520. - PubMed

Publication types