. 2021 Mar 16;20(1):65.
doi: 10.1186/s12933-021-01252-3.

Angiotensin II-induced upregulation of SGLT1 and 2 contributes to human microparticle-stimulated endothelial senescence and dysfunction: protective effect of gliflozins

Affiliations

Angiotensin II-induced upregulation of SGLT1 and 2 contributes to human microparticle-stimulated endothelial senescence and dysfunction: protective effect of gliflozins

Sin-Hee Park et al. Cardiovasc Diabetol. .

Abstract

Background: Sodium-glucose cotransporter 2 (SGLT2) inhibitors reduced cardiovascular risk in type 2 diabetes patients independently of glycemic control. Although angiotensin II (Ang II) and blood-derived microparticles are major mediators of cardiovascular disease, their impact on SGLT1 and 2 expression and function in endothelial cells (ECs) and isolated arteries remains unclear.

Methods: ECs were isolated from porcine coronary arteries, and arterial segments from rats. The protein expression level was assessed by Western blot analysis and immunofluorescence staining, mRNA levels by RT-PCR, oxidative stress using dihydroethidium, nitric oxide using DAF-FM diacetate, senescence by senescence-associated beta-galactosidase activity, and platelet aggregation by aggregometer. Microparticles were collected from blood of patients with coronary artery disease (CAD-MPs).

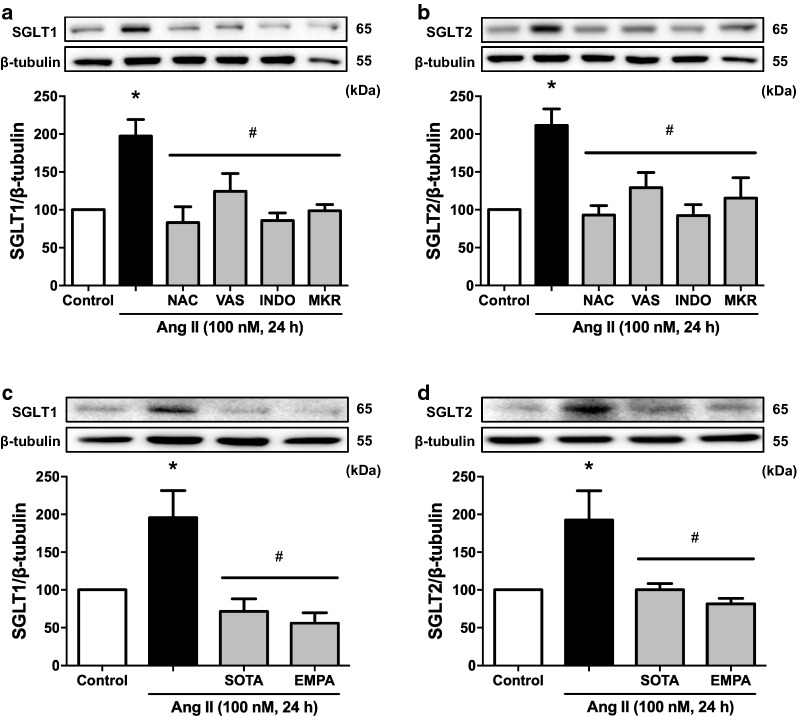
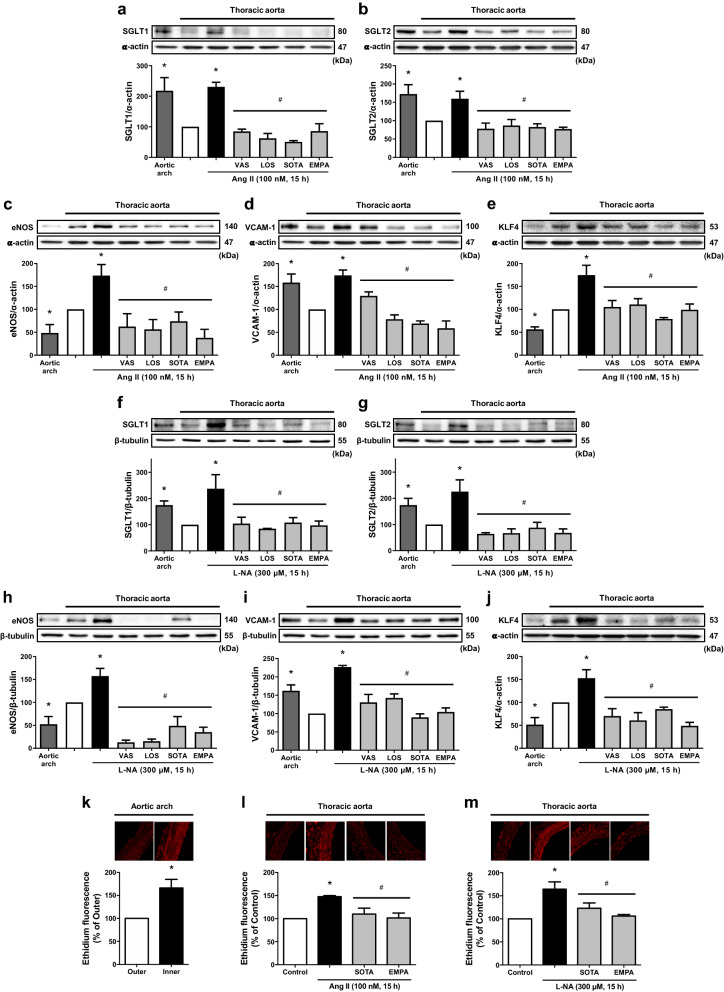
Results: Ang II up-regulated SGLT1 and 2 protein levels in ECs, and caused a sustained extracellular glucose- and Na+-dependent pro-oxidant response that was inhibited by the NADPH oxidase inhibitor VAS-2780, the AT1R antagonist losartan, sotagliflozin (Sota, SGLT1 and SGLT2 inhibitor), and empagliflozin (Empa, SGLT2 inhibitor). Ang II increased senescence-associated beta-galactosidase activity and markers, VCAM-1, MCP-1, tissue factor, ACE, and AT1R, and down-regulated eNOS and NO formation, which were inhibited by Sota and Empa. Increased SGLT1 and SGLT2 protein levels were observed in the rat aortic arch, and Ang II- and eNOS inhibitor-treated thoracic aorta segments, and were associated with enhanced levels of oxidative stress and prevented by VAS-2780, losartan, Sota and Empa. CAD-MPs promoted increased levels of SGLT1, SGLT2 and VCAM-1, and decreased eNOS and NO formation in ECs, which were inhibited by VAS-2780, losartan, Sota and Empa.

Conclusions: Ang II up-regulates SGLT1 and 2 protein expression in ECs and arterial segments to promote sustained oxidative stress, senescence and dysfunction. Such a sequence contributes to CAD-MPs-induced endothelial dysfunction. Since AT1R/NADPH oxidase/SGLT1 and 2 pathways promote endothelial dysfunction, inhibition of SGLT1 and/or 2 appears as an attractive strategy to enhance the protective endothelial function.

Keywords: Angiotensin II; Circulating microparticles; Empagliflozin; Endothelial senescence and dysfunction; SGLT1; SGLT2.


Conflict of interest statement

This work was supported by an unrestricted research grant from Boehringer Ingelheim Pharma GmbH & Co. KG, Biberach, Germany.

Figures

Fig. 1
Fig. 1
Ang II up-regulates in a time- and concentration-dependent manner the protein level of SGLT1 and SGLT2 in ECs as assessed by Western blot (a, b) and immunofluorescence staining (c). SGLT1 and SGLT2 protein staining appears in red and nuclei are stained with DAPI (blue). Exposure of ECs to SGLT2 siRNA (40 nM) for 6 h prevented the stimulatory effect of Ang II on SGLT2 (d). Results are shown as representative immunoblots and micrography of immunofluorescence staining (upper and left panels) and corresponding cumulative data (lower and right panels). Data are expressed as mean ± SEM of n = 3. *P < 0.05 vs. control and #P < 0.05 vs. Ang II
Fig. 2
Fig. 2
The sustained Ang II-induced formation of ROS in ECs is sensitive to a dual SGLT1 and SGLT2 inhibitor, sotagliflozin, and a selective SGLT2 inhibitor, empagliflozin. ECs are incubated with either (a, b) sotagliflozin (SOTA, 100 nM) or empagliflozin (EMPA, 100 nM) for 30 min before the addition of Ang II for either 30 min (a) or 24 h (b). For characterization of the role of SGLT1 and 2 in the pro-oxidant response to Ang II, ECs are incubated with Ang II for 24 h before being exposed to (c) the indicated glucose concentrations for 1 h in the presence or absence of sodium, (d) the indicated glucose concentrations, methyl α-D-glucopyranoside (AMG, a non-metabolizable glucose analogue), or mannitol, and (e) cariporide (a NHE-1 inhibitor, 10 µM), KB-R7943 (a NCX inhibitor, 10 µM), or ouabain (a NKA inhibitor, 10 nM) for 1 h, and the subsequent determination of dihydroethidium staining by confocal microscope. Results are shown as representative micrography of dihydroethidium staining (upper panels) and corresponding cumulative data (lower panels). Data are expressed as mean ± SEM of n = 3. *P < 0.05 vs. control and #P < 0.05 vs. Ang II
Fig. 3
Fig. 3
Ang II causes a redox-sensitive up-regulation of SGLT1 and 2 promoting their own expression in ECs. ECs are incubated with either (a, b) N-acetyl cysteine (NAC, an antioxidant, 1 mM) for 2 h, VAS-2870 (VAS, a NADPH oxidase inhibitor, 1 µM), indomethacin (INDO, a cyclooxygenase inhibitor, 30 µM) or myxothiazol (0.5 µM) + KCN (1 µM) + rotenone (1 µM; MKR, mitochondrial respiratory chain inhibitors) for 30 min, and (c, d) sotagliflozin (SOTA, 100 nM) or empagliflozin (EMPA, 100 nM) for 30 min before the addition of Ang II and the subsequent assessment of the expression level of SGLT1 and SGLT2 by Western blot analysis. Results are shown as representative immunoblots (upper panels) and corresponding cumulative data (lower panels). Data are expressed as mean ± SEM of n = 3. *P < 0.05 vs. control and #P < 0.05 vs. Ang II
Fig. 4
Fig. 4
Ang II-induced endothelial senescence is dependent on the AT1R/NADPH oxidase/SGLT1 and 2 pathways. ECs are incubated with either VAS-2870 (VAS, 1 µM), losartan (LOS, an AT1R antagonist, 1 µM), sotagliflozin (SOTA, 100 nM), empagliflozin (EMPA, 100 nM), cariporide (10 µM) or KB-R7943 (10 µM) for 30 min before the addition of Ang II, and the subsequent determination of (a) SA-β-gal activity, (bd) the expression level of p53, p21 and p16 protein after a 24-h incubation period by Western blot analysis, and (e, f) the expression level of p53 and p21 mRNA after a 6-h incubation period by RT-PCR. Results are shown as representative immunoblots (upper panels) and corresponding cumulative data (lower panels). Data are expressed as mean ± SEM of n = 3. *P < 0.05 vs. control and #P < 0.05 vs. Ang II
Fig. 5
Fig. 5
Ang II-induced pro-atherothrombotic responses in ECs are dependent on oxidative stress and SGLT1 and 2. ECs are incubated with either (a, b) NAC (1 mM) for 2 h, VAS (1 µM), INDO (30 µM) or MKR (0.5, 1, 1 µM, respectively), and (ci) SOTA (100 nM) or EMPA (100 nM) for 30 min before the addition of Ang II and the subsequent determination of (ch) the expression level of target proteins by Western blot analysis, (i) the formation of NO in response to bradykinin as assessed by DAF-FM, and (j) the inhibitory effect of bradykinin-stimulated ECs on platelet aggregation induced by U46619 using an aggregometer. Results are shown as representative immunoblots, micrography of DAF-FM staining and platelet aggregation traces (upper and left panels) and corresponding cumulative data (lower and right panels). Data are expressed as mean ± SEM of n = 3. *P < 0.05 vs. control, and #P < 0.05 vs. Ang II (a–h, j) and bradykinin (i), and $P < 0.05 vs. Ang II + bradykinin (i)
Fig. 6
Fig. 6
Up-regulation of SGLT1 and SGLT2 at an arterial site at high risk (aortic arch) and following stimulation of an arterial site at low risk (thoracic aorta) with either Ang II or an eNOS inhibitor. The segments of thoracic aorta are incubated either with VAS (1 µM), LOS (1 µM), SOTA (100 nM) or EMPA (100 nM) for 30 min before the addition of (a-e, l) Ang II (100 nM) or (fj, m) Nω-nitro-L-arginine (L-NA, 300 µM) for 15 h, and the subsequent determination of (aJ) the expression level of target proteins by Western blot analysis, and (km) dihydroethidium staining by confocal microscope. Results are shown as representative immunoblots and micrography of dihydroethidium staining (upper and left panels) and corresponding cumulative data (lower and right panels). Data are expressed as mean ± SEM of n = 3–4. *P < 0.05 vs. control thoracic aorta (aj, l, m) and outer aortic arch (k), and #P < 0.05 vs. Ang II-treated thoracic aorta (ae, l) and L-NA-treated thoracic aorta (fj, m)
Fig. 7
Fig. 7
Circulating MPs from patients with coronary artery diseases (CAD) up-regulate SGLT1 and SGLT2 to promote their own expression and involve the AT1R/NADPH oxidase pathway to induce endothelial dysfunction in ECs. (ad) ECs are exposed to CAD-MPs (10 nM PhtdSer eq) from 5 individual CAD patients. (ei) ECs are incubated with either VAS (1 µM), LOS (1 µM), SOTA (100 nM) or EMPA (100 nM) for 30 min before the addition of CAD-MPs (10 nM PhtdSer eq) pooled from 6 (eh) and 5 (i) patients with CAD for 48 h. Thereafter, (ah) the expression level of target proteins is assessed by Western blot analysis, and i the formation of NO in response to bradykinin by DAF-FM. Results are shown as representative immunoblots and micrography of DAF-FM staining (upper and left panels) and corresponding cumulative data (lower and right panels). Data are expressed as mean ± SEM of n = 3. *P < 0.05 vs. control, and #P < 0.05 vs. CAD-MPs (eh) and bradykinin (i), and $P < 0.05 vs. CAD-MPs + bradykinin (i)
Fig. 8
Fig. 8
Schematic summarizing the present findings, which indicate that angiotensin II and circulating microparticles from coronary artery disease patients (CAD-MPs) via the local angiotensin system upregulate SGLT1 and SGLT2 expression to promote endothelial senescence and dysfunction in coronary endothelial cells. All of these effects are prevented by gliflozins

References

    1. Benjamin EJ, Muntner P, Alonso A, Bittencourt MS, Callaway CW, Carson AP, Chamberlain AM, Chang AR, Cheng S, Das SR, et al. Heart disease and stroke statistics-2019 update: a report from the American Heart Association. Circulation. 2019;139(10):e56–28. doi: 10.1161/CIR.0000000000000659. - DOI - PubMed
    1. Suo J, Ferrara DE, Sorescu D, Guldberg RE, Taylor WR, Giddens DP. Hemodynamic shear stresses in mouse aortas: implications for atherogenesis. Arterioscler Thromb Vasc Biol. 2007;27(2):346–51. doi: 10.1161/01.ATV.0000253492.45717.46. - DOI - PubMed
    1. D’Amario D, Migliaro S, Borovac JA, Restivo A, Vergallo R, Galli M, Leone AM, Montone RA, Niccoli G, Aspromonte N, et al. Microvascular dysfunction in heart failure with preserved ejection fraction. Front Physiol 2019;10:1347. - PMC - PubMed
    1. Heitzer T, Schlinzig T, Krohn K, Meinertz T, Munzel T. Endothelial dysfunction, oxidative stress, and risk of cardiovascular events in patients with coronary artery disease. Circulation. 2001;104(22):2673–8. doi: 10.1161/hc4601.099485. - DOI - PubMed
    1. Schachinger V, Britten MB, Zeiher AM. Prognostic impact of coronary vasodilator dysfunction on adverse long-term outcome of coronary heart disease. Circulation. 2000;101(16):1899–906. doi: 10.1161/01.CIR.101.16.1899. - DOI - PubMed

Publication types

MeSH terms

Substances

LinkOut - more resources