Randomized Controlled Trial
. 2021 Mar 16;18(1):49.
doi: 10.1186/s12984-021-00842-2.

The influence of powered prostheses on user perspectives, metabolics, and activity: a randomized crossover trial

Affiliations
Randomized Controlled Trial

The influence of powered prostheses on user perspectives, metabolics, and activity: a randomized crossover trial

Jay Kim et al. J Neuroeng Rehabil. .

Abstract

Background: Powered prosthetic ankles provide battery-powered mechanical push-off, with the aim of reducing the metabolic demands of walking for people with transtibial amputations. The efficacy of powered ankles has been shown in active, high functioning individuals with transtibial amputation, but is less clear in other populations. Additionally, it is unclear how use of a powered prosthesis influences everyday physical activity and mobility.

Methods: Individuals with unilateral transtibial amputations participated in a randomized clinical trial comparing their prescribed, unpowered prosthesis and the BiOM powered prosthesis. Participants' metabolic costs and self-selected walking speeds were measured in the laboratory and daily step count, daily steps away from home, and walking speed were measured over two weeks of at-home prosthesis use. Participants also rated their perception of mobility and quality of life and provided free-form feedback. Dependent measures were compared between prostheses and the relationships between metabolic cost, perception of mobility, and characteristics of walking in daily life were explored using Pearson's correlations.

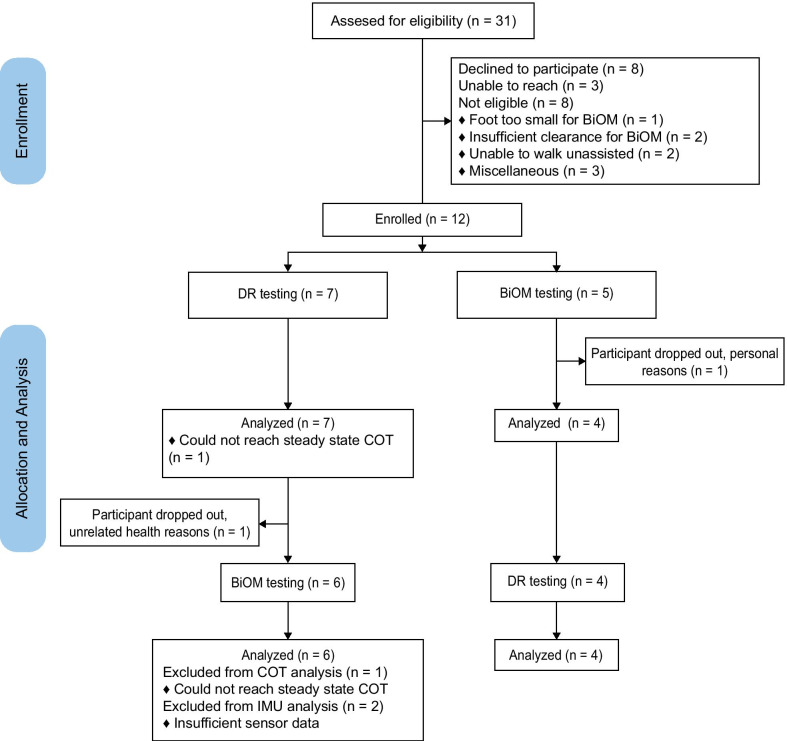
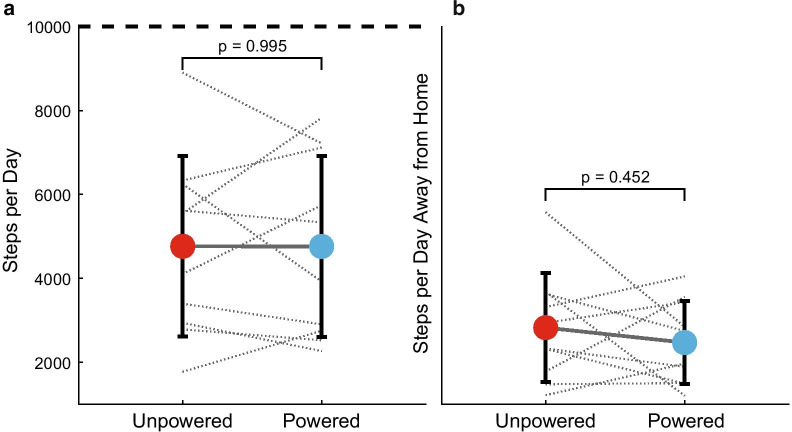
Results: Twelve people were randomly allocated to the powered prosthesis first (n = 7) or unpowered prosthesis first (n = 5) and ten completed the full study. There were no differences in metabolic costs (p = 0.585), daily step count (p = 0.995), walking speed in-lab (p = 0.145) and in daily life (p = 0.226), or perception of mobility between prostheses (p ≥ 0.058). Changes varied across participants, however. There were several medium-sized effects for device comparisons. With the powered prosthesis, participants had increased self-reported ambulation (g = 0.682) and decreased frustration (g = 0.506).

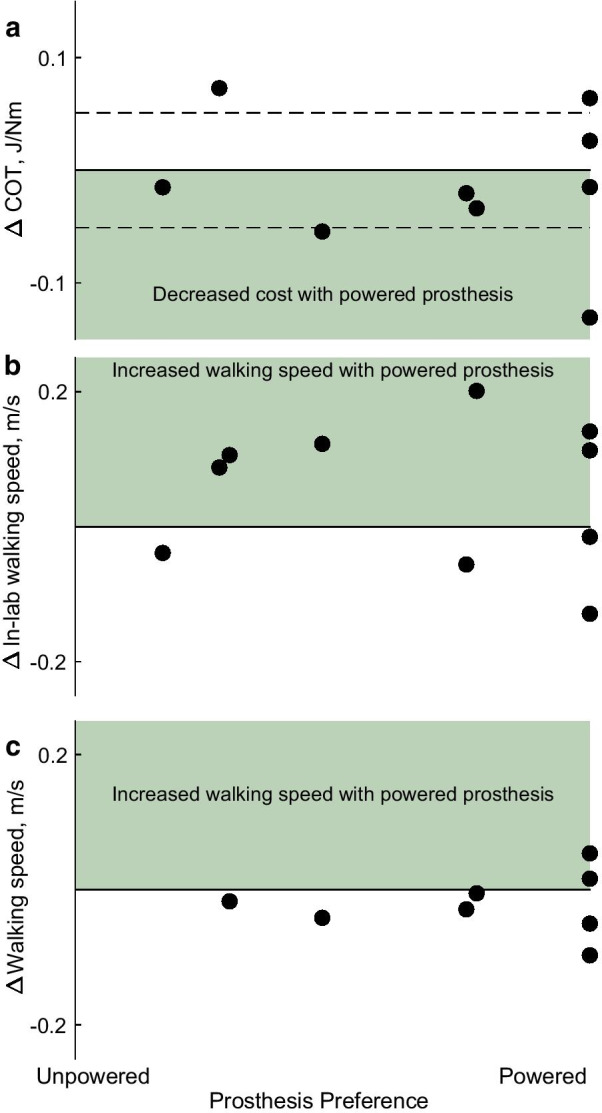
Conclusions: There were no universal benefits of the powered prosthesis on function in the lab or home environment. However, the effects were subject-specific, with some reporting preference for power and improved mobility, and some increasing their activity and decreasing their metabolic effort. Additionally, self-reported preferences did not often correlate with objective measures of function. This highlights the need for future clinical research to include both perception and objective measures to better inform prosthetic prescription.

Trial registration: https://clinicaltrials.gov , #NCT02828982. Registered 12 July 2016, https://clinicaltrials.gov/ct2/show/NCT02828982.

Keywords: Accelerometer; Inertial measurement unit; Metabolic cost; Microprocessor ankle; Preference; Step count; Transtibial amputation; Walking speed.


Conflict of interest statement

The authors declare that they have no competing interests.

Figures

Fig. 1
Fig. 1
Consort flow diagram illustrating recruitment, enrollment, exclusion, and analysis
Fig. 2
Fig. 2
a Daily step count using the unpowered (red) and powered (blue) prostheses. Dashed horizontal line represents the recommended 10,000 steps per day. b Daily step count away from home using the unpowered (red) and powered (blue) prostheses. Gray x’s and lines represent individual participant trends
Fig. 3
Fig. 3
a Self-selected walking speeds measured in the lab for participants using the unpowered (red) and powered (blue) prostheses. Gray x’s and lines represent individual participant trends. b Split violin plot of the probability density functions of walking speed distributions of walking strides taken in daily life. To visualize, raw distributions were smoothed using the ksdensity kernel smoothing function in MATLAB. Shared regions are averaged distributions and solid horizontal lines are the group means
Fig. 4
Fig. 4
Changes in participant responses for the Prosthesis Evaluation Questionnaire, Short Form-36 and Prosthesis Preference, by sub-scale. Significant differences (p < 0.05) between prosthesis are indicated and bolded (*). Changes with a medium or large effect size (g ≥ 0.5) are also indicated and bolded (†)
Fig. 5
Fig. 5
a Relationship between changes in prosthesis preference and changes in metabolic cost (ΔCOT). Dashed lines indicate the minimal detectable change in COT. b Relationship between changes in prosthesis preference and changes in daily step count. c Relationship between changes in prosthesis preference and changes in walking speed in daily life. Linear fits are shown for moderate correlations (r ≥ 0.6)
Fig. 6
Fig. 6
a Relationship between changes in metabolic cost (ΔCOT) and changes in daily step count. Data in the second quadrant (highlighted in green) indicate lower metabolic cost and greater step count with the powered prosthesis. b Relationships between changes in the PEQ ambulation sub-scale (left) and the SF-36 physical functioning sub-scale scores (right) and changes in daily step count.c Relationships between changes in the PEQ social burden sub-scale (left) and the SF-36 social functioning sub-scale scores (right) and changes in daily step count away from home. Data in the first quadrant (highlighted in green) indicate greater scores and greater step count with the powered prosthesis

Similar articles

Cited by

References

    1. Waters RL, Mulroy S. The energy expenditure of normal and pathologic gait. Gait Posture. 1999;9(3):207–31. doi: 10.1016/S0966-6362(99)00009-0. - DOI - PubMed
    1. Lin SJ, Winston KD, Mitchell J, Girlinghouse J, Crochet K. Physical activity, functional capacity, and step variability during walking in people with lower-limb amputation. Gait Posture. 2014;40(1):140–4. doi: 10.1016/j.gaitpost.2014.03.012. - DOI - PubMed
    1. Stepien JM, Cavenett S, Taylor L, Crotty M. Activity levels among lower-limb amputees: self-report versus step activity monitor. Arch Phys Med Rehabil. 2007;88(7):896–900. doi: 10.1016/j.apmr.2007.03.016. - DOI - PubMed
    1. Klute GK, Berge JS, Orendurff MS, Williams RM, Czerniecki JM. Prosthetic intervention effects on activity of lower-extremity amputees. Arch Phys Med Rehabil. 2006;87(5):717–22. doi: 10.1016/j.apmr.2006.02.007. - DOI - PubMed
    1. Orendurff MS, Schoen JA, Bernatz GC, Segal AD, Klute GK. How humans walk: bout duration, steps per bout, and rest duration. J Rehabil Res Dev. 2008;45(7):1077–89. doi: 10.1682/JRRD.2007.11.0197. - DOI - PubMed

Publication types

Associated data