. 2021 Mar 16;4(5):e202000925.
doi: 10.26508/lsa.202000925. Print 2021 May.

Phylo-geo-network and haplogroup analysis of 611 novel coronavirus (SARS-CoV-2) genomes from India

Affiliations

Phylo-geo-network and haplogroup analysis of 611 novel coronavirus (SARS-CoV-2) genomes from India

Rezwanuzzaman Laskar et al. Life Sci Alliance. .

Abstract

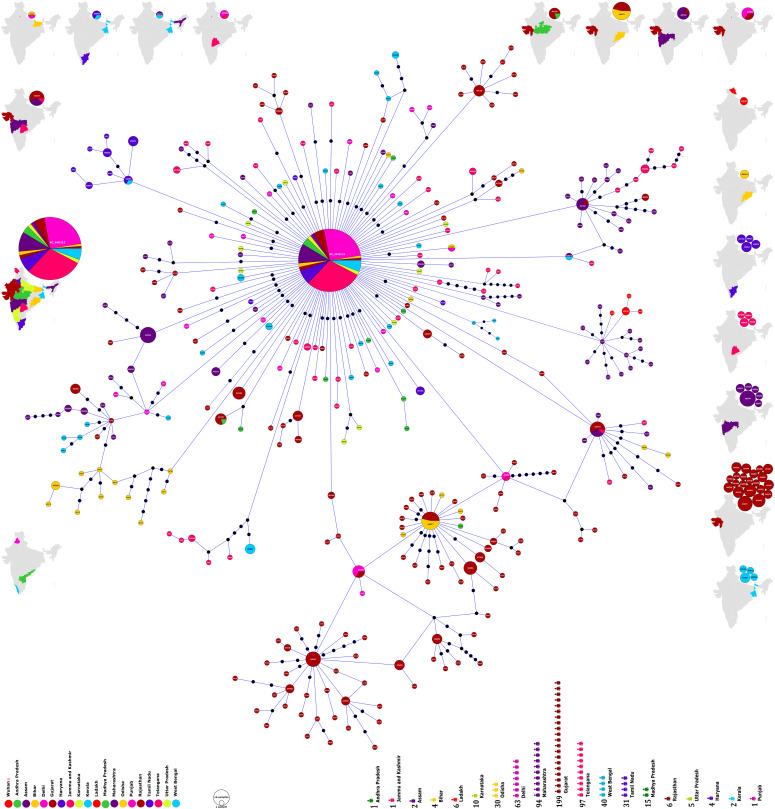
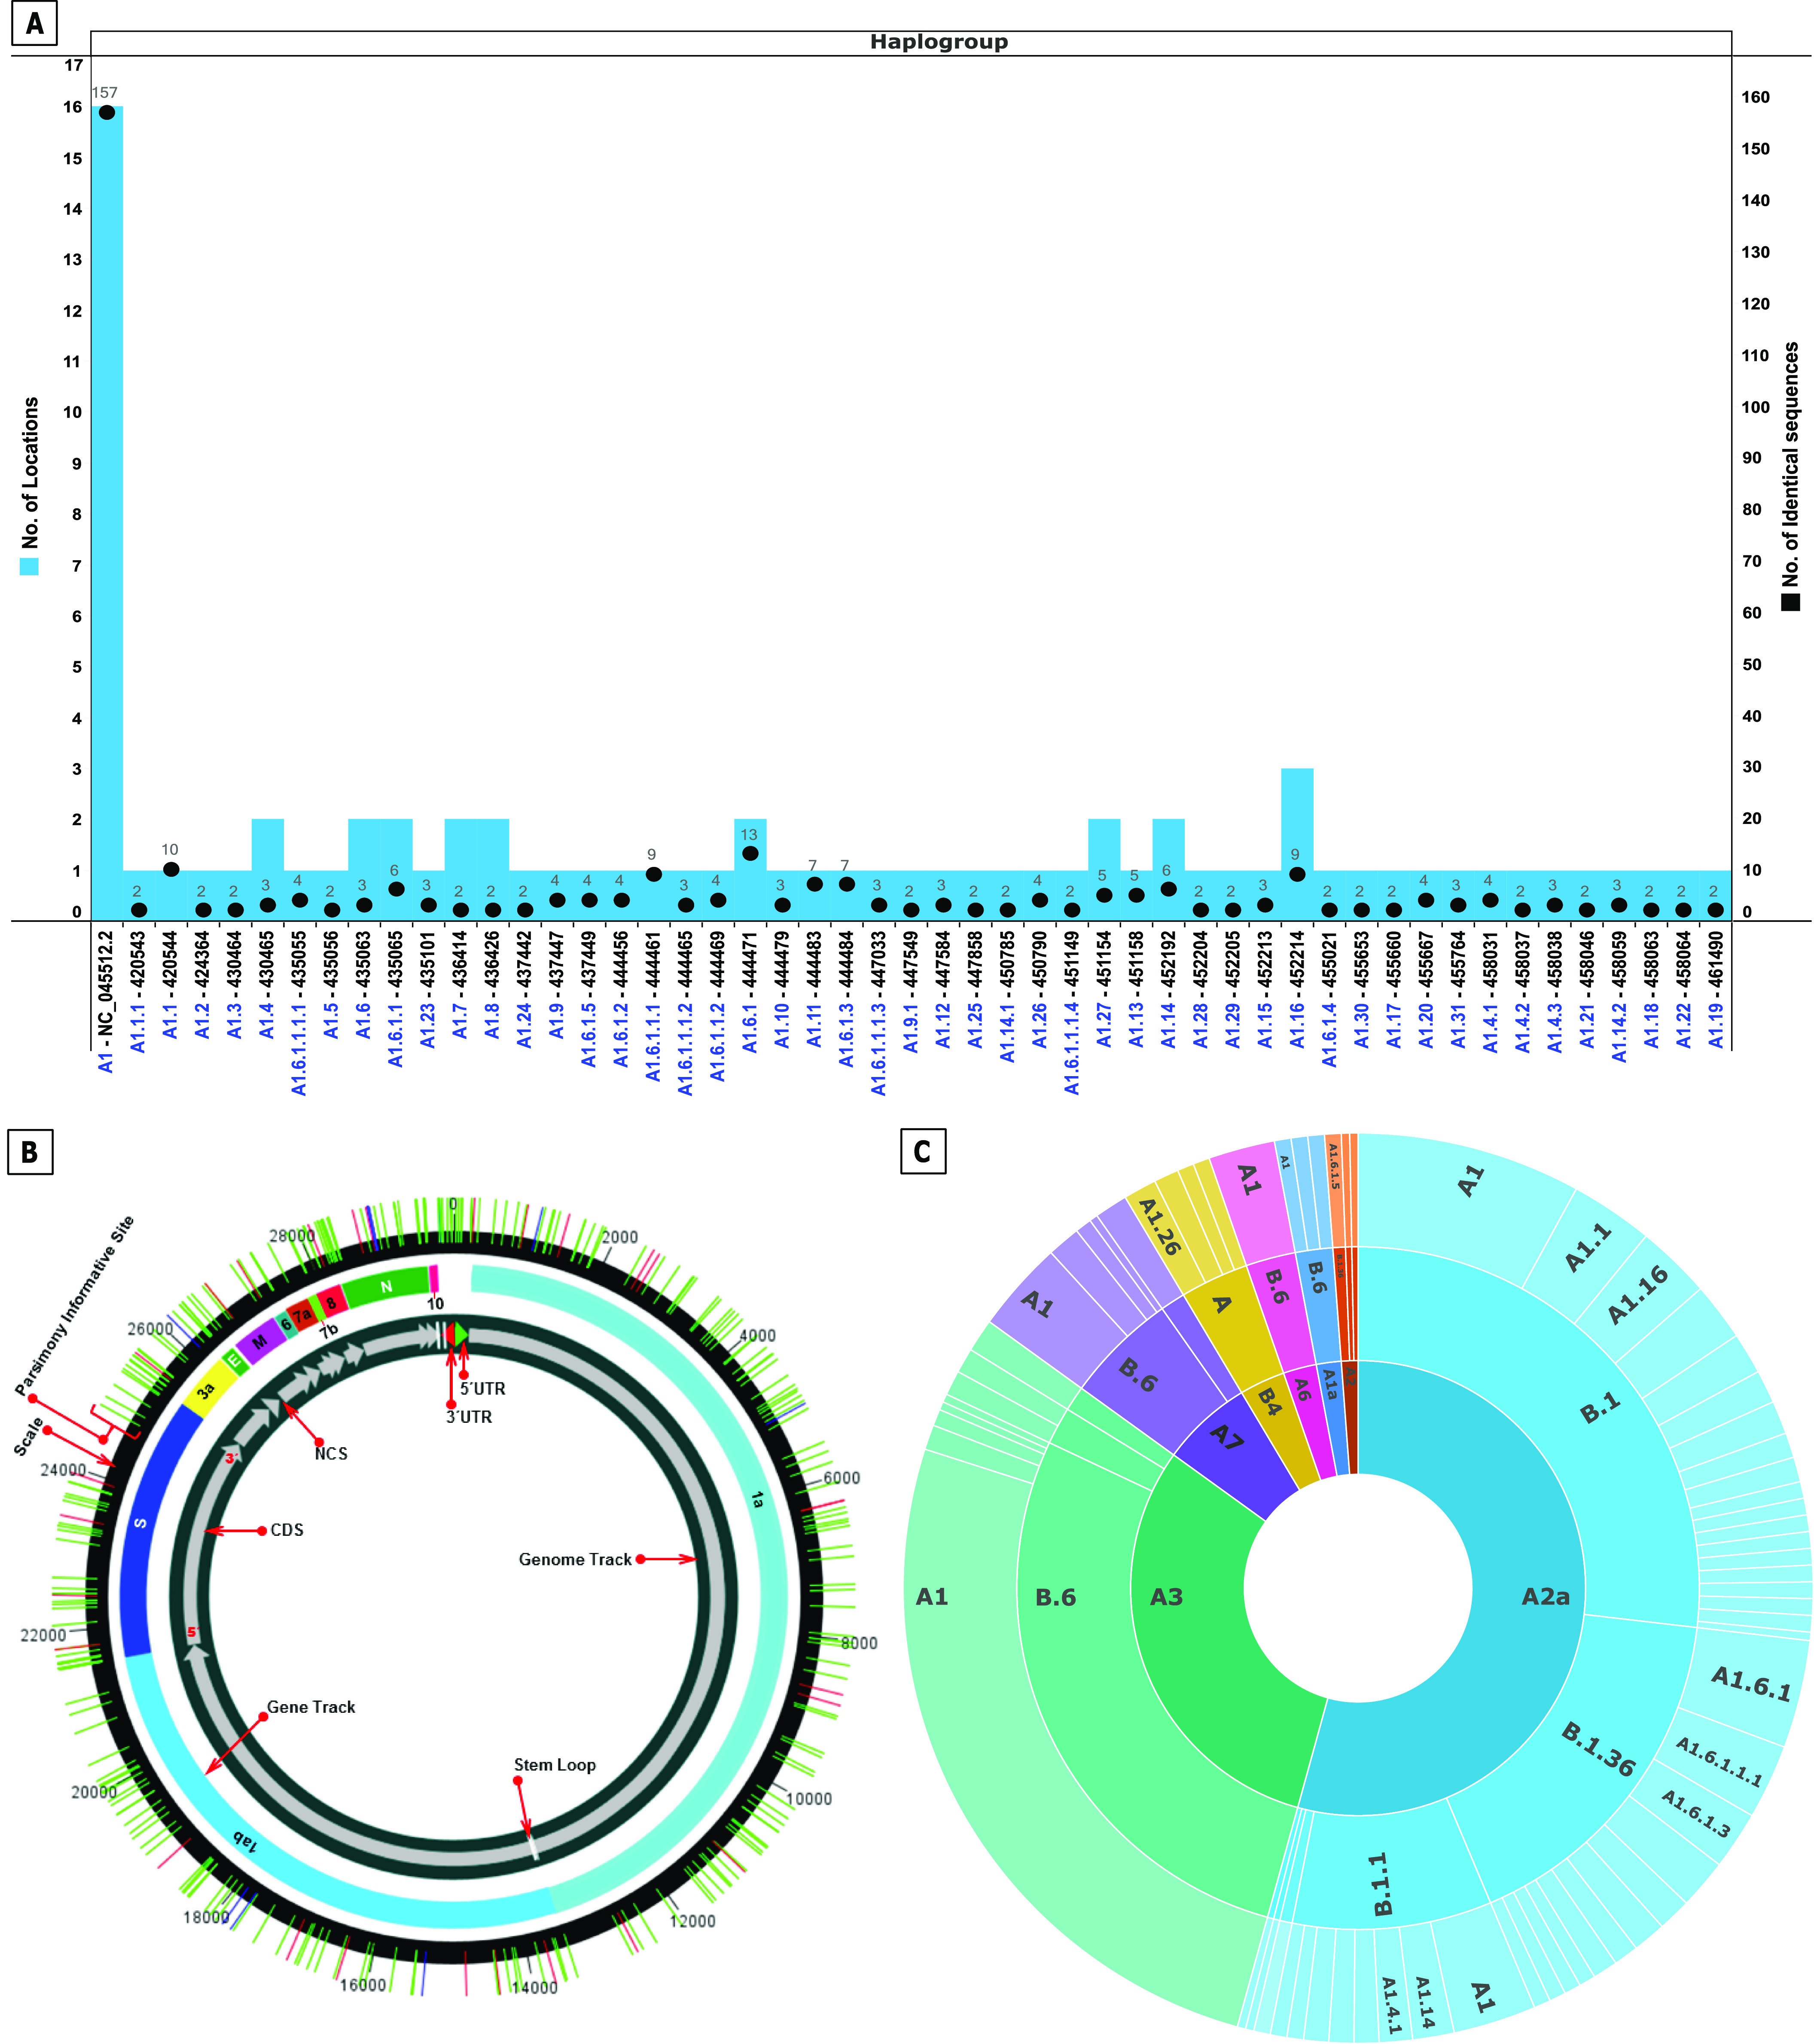
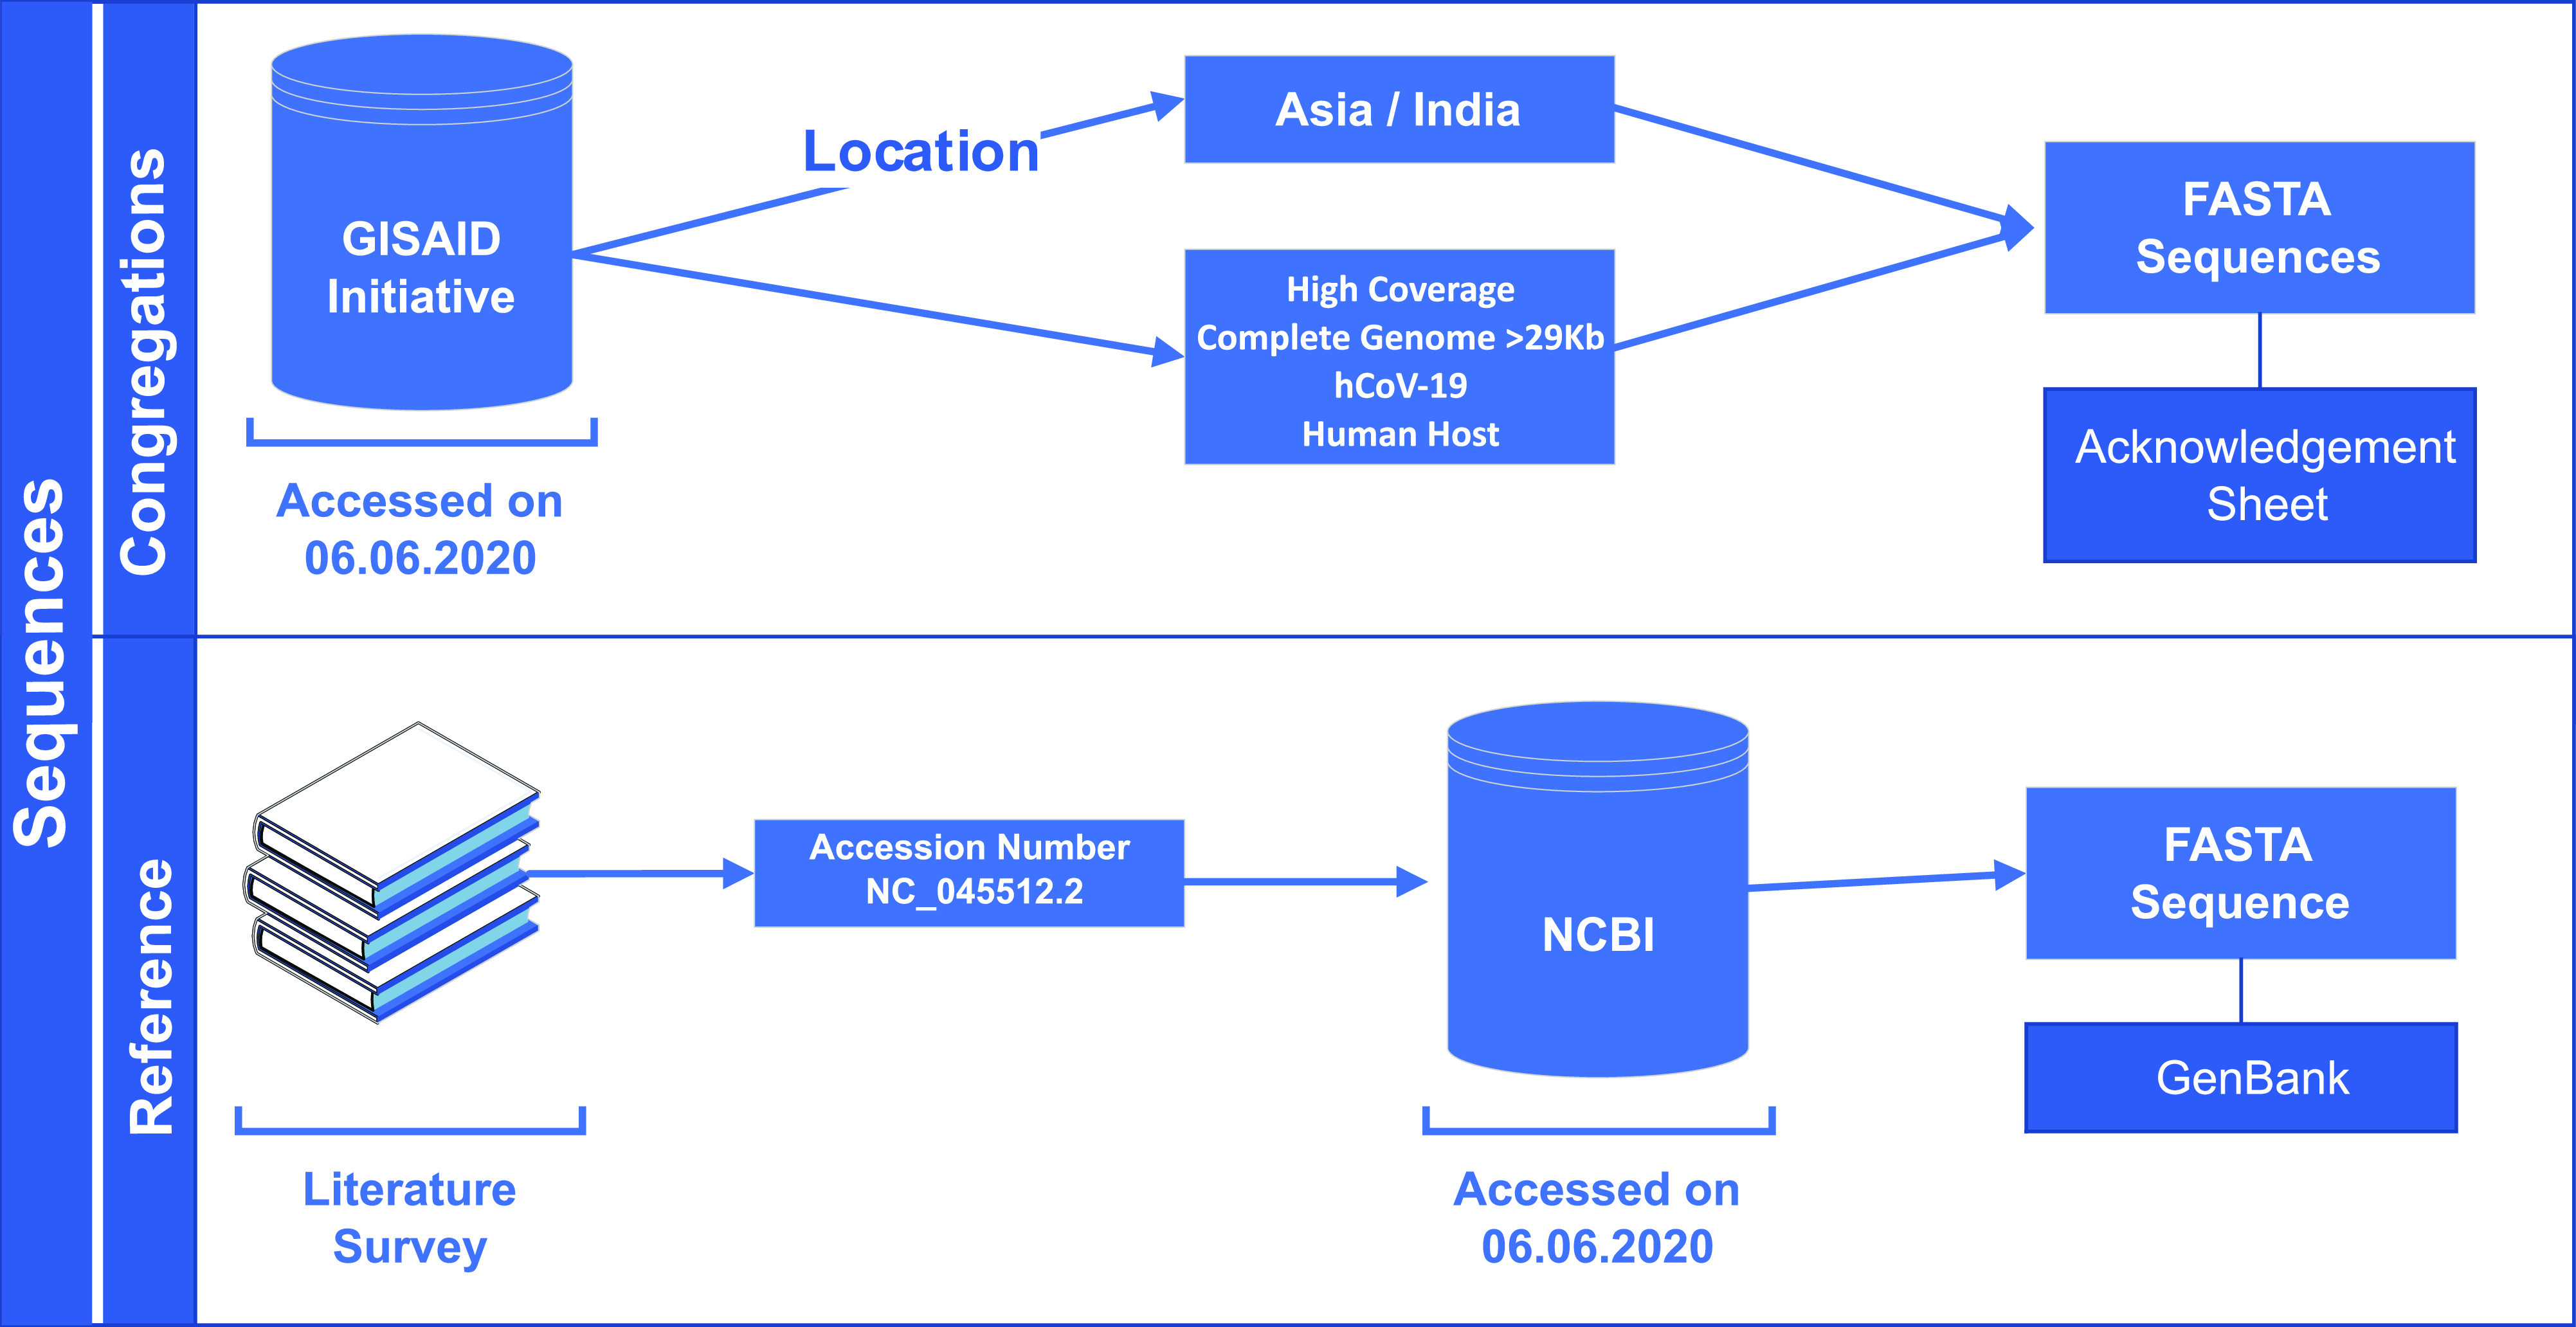
The novel coronavirus (SARS-CoV-2) from Wuhan China discovered in December 2019 has since developed into a global epidemic. Presently, we constructed and analyzed the phylo-geo-network of SARS-CoV-2 genomes from across India to understand the viral evolution in the country. A total of 611 full-length genomes from different states of India were extracted from the EpiCov repository of GISAID initiative on 6 June, 2020. Their alignment with the reference sequence (Wuhan, NCBI accession number NC_045512.2) uncovered 270 parsimony informative sites. Furthermore, 339 genomes were divided into 51 haplogroups. The network revealed the core haplogroup as that of reference sequence NC_045512.2 (Haplogroup A1) with 157 identical sequences present across 16 states. Remaining haplogroups had <10 identical sequences across a maximum of three states. Some states with fewer samples had more haplogroups. Forty-one haplogroups were localized exclusively to any one state. The two most common lineages are B6 and B1 (Pangolin) whereas clade A2a (Covidex) appears to be the most predominant in India. Because the pandemic is still emerging, the observations need to be monitored.


Conflict of interest statement

The authors declare that they have no conflict of interest.

Figures

Figure 1.
Figure 1.. Phylogenomic geographic (phylo-geo) network of SARS-CoV-2 genomes from India.
The nodes represented by circles have been named after the Accession Numbers of the defining sequences representing a particular cluster. The diameter of the circle corresponds to the number of sequences present therein. Thus, a bigger circle will imply more sequences. The different states of India have been represented by color coding and the number of sequences from each state used in the study has been shown in the lower panel of the figure. The distribution of haplogroups across different states is shown in the maps on the periphery such that haplogroups present only in one state are in the maps on the right side. Maps on other sides include haplogroups present in more than one state. Maps have been generated and powered by Bing (Geo Names; Microsoft, TomTom) through MS Excel 2019.
Figure 2.
Figure 2.
Haplogroup distribution and lineage analysis of studied genomes. (A) Prevalence and geographical distribution of 51 haplogroups of SARS-CoV-2 genomes in India. The haplogroups are shown on the x-axis. The number of identical sequences present in a haplogroup is shown as bar whereas number of states, wherein the haplogroup is present is shown as a black dot. Note the maximum prevalence (157 sequences) and widespread distribution (16 states) of NC_045512.2 containing haplogroup (A1). For details of haplogroup IDs, identical sequences, and locations, please refer Table S2. (B) Distribution of parsimony informative sites across the SARS-CoV-2 genomes. The SARS-CoV-2 genome has been represented circularly along with the locations of different genes/ORFs/Non coding regions. Parsimony informative sites are shown as lines traversing the circle. (C) Lineage and Subtype Analysis of SARS-CoV-2 genomes in India. The outermost circle represents haplogroups reported in the study whereas the middle circle depicts lineage prediction by Pangolin Web. The innermost circle is the clade analysis by Covidex Web tool.
Figure 3.
Figure 3.. Outline for selection and extraction of sequences used in the study.

References

    1. Alam CM, Iqbal A, Sharma A, Schulman AH, Ali S (2019) Microsatellite diversity, complexity, and host range of mycobacteriophage genomes of the siphoviridae family. Front Genet 10: 207. 10.3389/fgene.2019.00207. - DOI - PMC - PubMed
    1. Cacciabue M, Aguilera P, Gismondi MI, Taboga O (2020) Covidex: An ultrafast and accurate tool for virus subtyping. BioRxiv 10.1101/2020.08.21.261347(Preprint posted August 21, 2020). - DOI - PMC - PubMed
    1. Carver T, Harris SR, Berriman M, Parkhill J, McQuillan JA (2012) Artemis: An integrated platform for visualization and analysis of high-throughput sequence-based experimental data. Bioinformatics 28: 464–469. 10.1093/bioinformatics/btr703 - DOI - PMC - PubMed
    1. Carver T, Thomson N, Bleasby A, Berriman M, Parkhill J (2009) DNAPlotter: Circular and linear interactive genome visualization. Bioinformatics 25: 119–120. 10.1093/bioinformatics/btn578 - DOI - PMC - PubMed
    1. Cavanagh D (2007) Coronavirus avian infectious bronchitis virus. Vet Res 38: 281–297. 10.1051/vetres:2006055 - DOI - PubMed

Publication types

Associated data