. 2021 Apr 2;372(6537):56-62.
doi: 10.1126/science.abc7717. Epub 2021 Mar 16.

Long-term drying of Mars by sequestration of ocean-scale volumes of water in the crust

Affiliations

Long-term drying of Mars by sequestration of ocean-scale volumes of water in the crust

E L Scheller et al. Science. .

Abstract

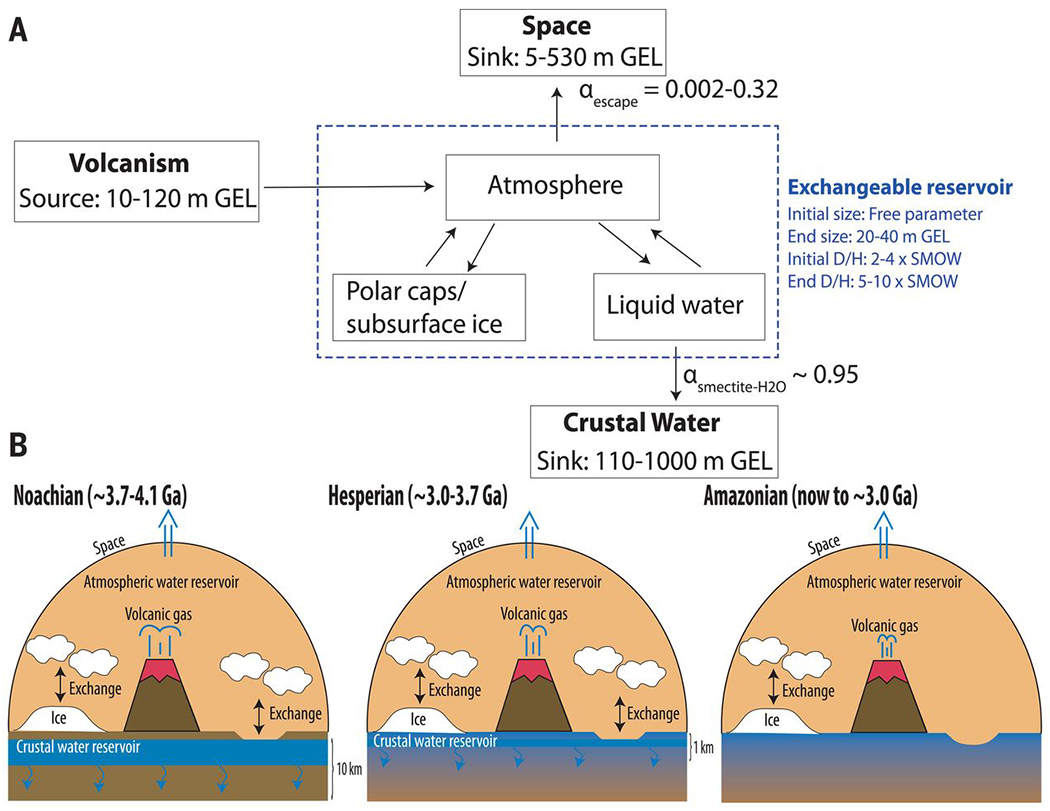
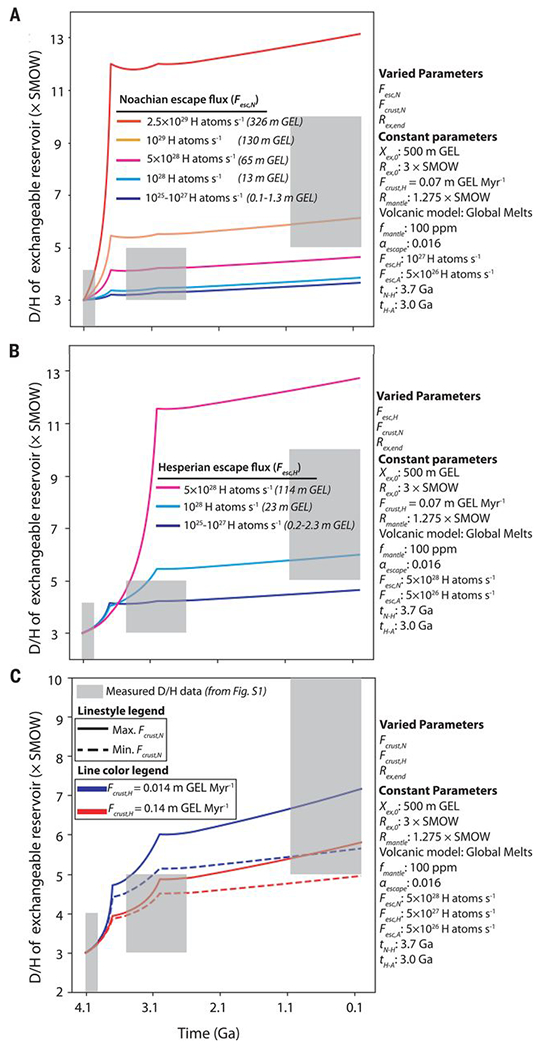
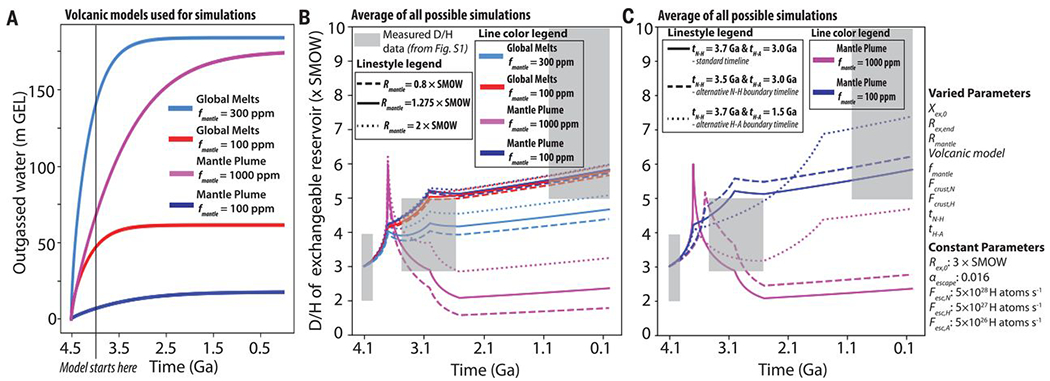
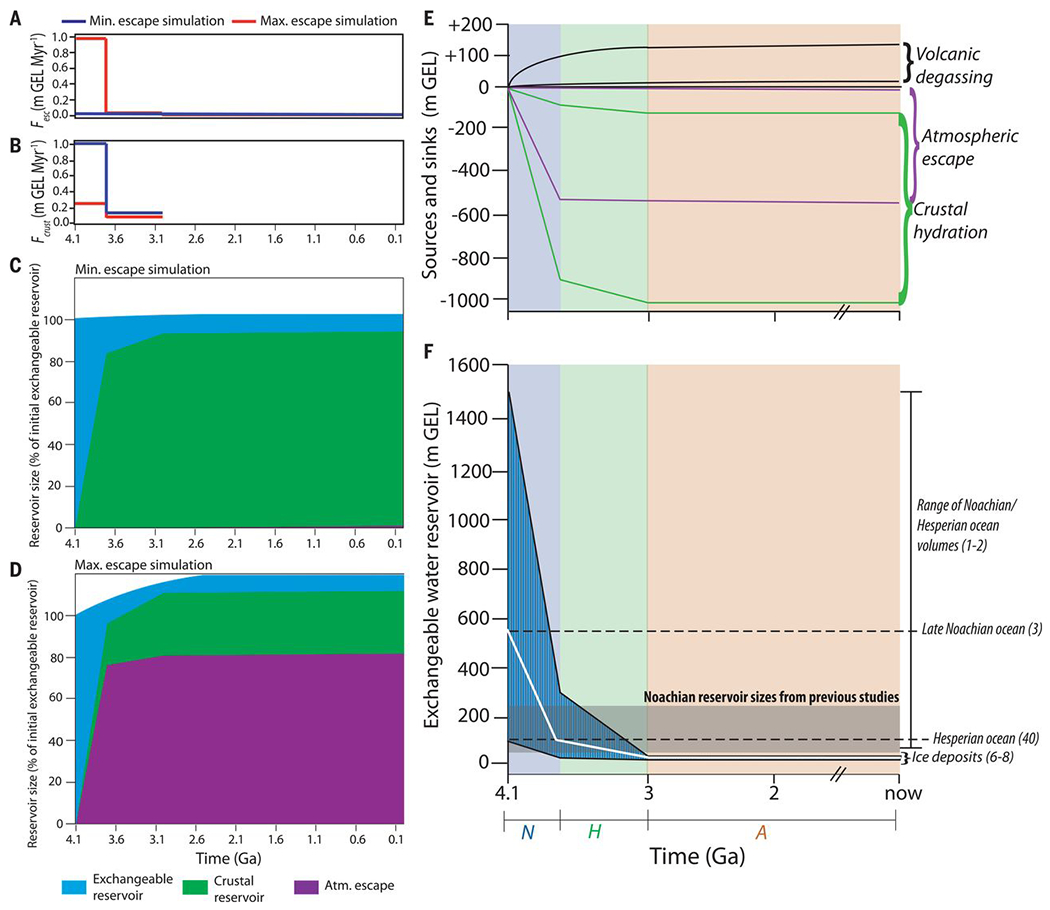
Geological evidence shows that ancient Mars had large volumes of liquid water. Models of past hydrogen escape to space, calibrated with observations of the current escape rate, cannot explain the present-day deuterium-to-hydrogen isotope ratio (D/H). We simulated volcanic degassing, atmospheric escape, and crustal hydration on Mars, incorporating observational constraints from spacecraft, rovers, and meteorites. We found that ancient water volumes equivalent to a 100 to 1500 meter global layer are simultaneously compatible with the geological evidence, loss rate estimates, and D/H measurements. In our model, the volume of water participating in the hydrological cycle decreased by 40 to 95% over the Noachian period (~3.7 billion to 4.1 billion years ago), reaching present-day values by ~3.0 billion years ago. Between 30 and 99% of martian water was sequestered through crustal hydration, demonstrating that irreversible chemical weathering can increase the aridity of terrestrial planets.


Conflict of interest statement

Competing interests: We declare no competing interests.

Figures

Fig. 1.
Fig. 1.. Schematic illustration of water sink and source fluxes considered in our simulations.
(A) Box model representation with ranges of integrated water sinks, sources, reservoir sizes, and fractionation factors adopted in our simulations. The crustal water reservoir is based on rover and remote sensing observations and represents all unexchangeable subsurface ice, liquid water, and structural water in minerals (5). The integrated amount of H escape to space is based on measurements of the current flux and KINETICS calculations of fluxes (figs. S2 and S3). The integrated volcanic degassing is based on thermochemical models (5, 24). The blue box indicates the exchangeable reservoir, with its properties in blue text. (B) Schematic representation of our assumptions for the Noachian, Hesperian, and Amazonian periods. During the Noachian, the fluxes associated with crustal hydration and volcanic degassing are high. These all reduce during the Hesperian. During the Amazonian, volcanic degassing falls further, and there is negligible crustal hydration because the water is predominantly solid ice. Ga, billion years ago.
Fig. 2.
Fig. 2.. Simulated D/H evolution for different assumptions of crustal hydration and atmospheric escape rates.
(A to C) The evolution of the D/H of the exchangeable reservoir in our simulation. Most parameters, including Xex,0, are fixed; Rex,end is a free parameter to visualize the model sensitivity. The colored lines show results for different assumptions of the flux rates. The large range of D/H measurements from meteorite, rover, and telescope observations are indicated with gray rectangles (fig. S1). (A) Effects of increasing the Noachian escape flux (Fesc,N). (B) Effects of increasing the Hesperian escape flux (Fesc,H). (C) Effects of increasing the Noachian (Fcrust,N) and Hesperian (Fcrust,H) crustal hydration fluxes. When Fcrust,N increases, the exchangeable reservoir becomes smaller, inducing larger fractionations during the Noachian. When Fcrust,H increases, the allowed values of Fcrust,N decrease, causing less fractionation during the Noachian.
Fig. 3.
Fig. 3.. Simulated D/H evolution for different assumptions of the volcanic outgassing as a function of time.
(A) Adopted volcanic models (5, 24). The Mantle Plume model (24) assumes an initial mantle water content (fmantle) of 100 ppm (dark blue) or 1000 ppm (purple). The alternative Global Melts model (24) assumes fmantle is 100 ppm (red) or 300 ppm (light blue). (B) The evolution of the D/H ratio in the exchangeable reservoir from an average of simulations with each assumed volcanic model. Line colors are the same as in (A), and gray boxes are the same as in Fig. 2. Line styles refer to assumed D/H composition of volcanic gas [dashed, 0.8 × SMOW (27); solid, 1.275 × SMOW (47); and dotted, 2 × SMOW (19)]. (C) Evolution of the D/H in the exchangeable reservoir for average of simulations with different assumptions of volcanic model and age of the Noachian-Hesperian boundary (tN-H) and the Hesperian-Amazonian boundary (tH-A) (5). These transition ages control when Fesc and Fcrust values change under our assumptions for the Noachian, Hesperian, and Amazonian periods (5). Line colors are the same as in (A). Line styles refer to the assumed timing of tN-H and tH-A (solid, standard boundary ages where tN-H is 3.7 Ga and tH-A is 3.0 Ga; dashed, tN-H is moved to 3.5 Ga; dotted, tH-A is moved to 1.5 Ga). In these simulations, Rex,end is allowed to vary.
Fig. 4.
Fig. 4.. Compilation of relative reservoir sizes through time from all our simulations.
(A to D) Model simulations with minimum and maximum possible atmospheric escape fluxes (Fesc) and crustal hydration fluxes (Fcrust) within allowed parameter space and simulation constraints, where the exchangeable reservoir D/H of 5 to 10 × SMOW must be reproduced. (A) Evolution of minimum (blue line) and maximum (red line) Fesc within the constrained simulation space through geological time. (B) Evolution of minimum (red line) and maximum (blue line) Fcrust within the constrained simulation space through geological time. [(C) and (D)] Size evolution of three simulated reservoirs through geological time shown as a cumulative percentage. Colored areas indicate the time evolution within the exchangeable reservoir (blue), crustal reservoir (green), and water escaped to the atmosphere (purple). (C) The scenario in which Fesc is minimized and Fcrust is maximized. (D) The scenario in which Fesc is maximized and Fcrust is minimized. (E) Upper and lower bounds on sources and sinks from Fig. 1 through time derived from our simulations (black, volcanic degassing source; green, crustal hydration sink; purple, atmospheric escape sink) (5). (F) The range of exchangeable reservoir sizes (teal) permitted by our simulations. For comparison, we show the reservoirs derived by previous studies (gray rectangle) (4, 11, 14, 15) and ocean sizes based on geomorphological evidence (dashed lines) (–3, 40). Our preferred simulation scenario is shown as a solid white line. Noachian (N), Hesperian (H), and Amazonian (A) time intervals used in model are shaded in blue, green, and red, respectively.

Comment in

References

    1. Carr MH, Head JW, J. Geophys. Res. Planets 108, 5042 (2003).
    1. Clifford SM, Parker TJ, Icarus 154, 40–79 (2001).
    1. Di Achille G, Hynek BM, Nat. Geosci 3, 459–463 (2010).
    1. Kurokawa H et al., Earth Planet. Sci. Lett 394, 179–185 (2014).
    1. Materials and methods are available as supplementary materials.

Publication types