. 2021 Aug;11(8):2014-2031.
doi: 10.1158/2159-8290.CD-20-0841. Epub 2021 Mar 16.

Leukocyte Heterogeneity in Pancreatic Ductal Adenocarcinoma: Phenotypic and Spatial Features Associated with Clinical Outcome

Affiliations

Leukocyte Heterogeneity in Pancreatic Ductal Adenocarcinoma: Phenotypic and Spatial Features Associated with Clinical Outcome

Shannon M Liudahl et al. Cancer Discov. 2021 Aug.

Abstract

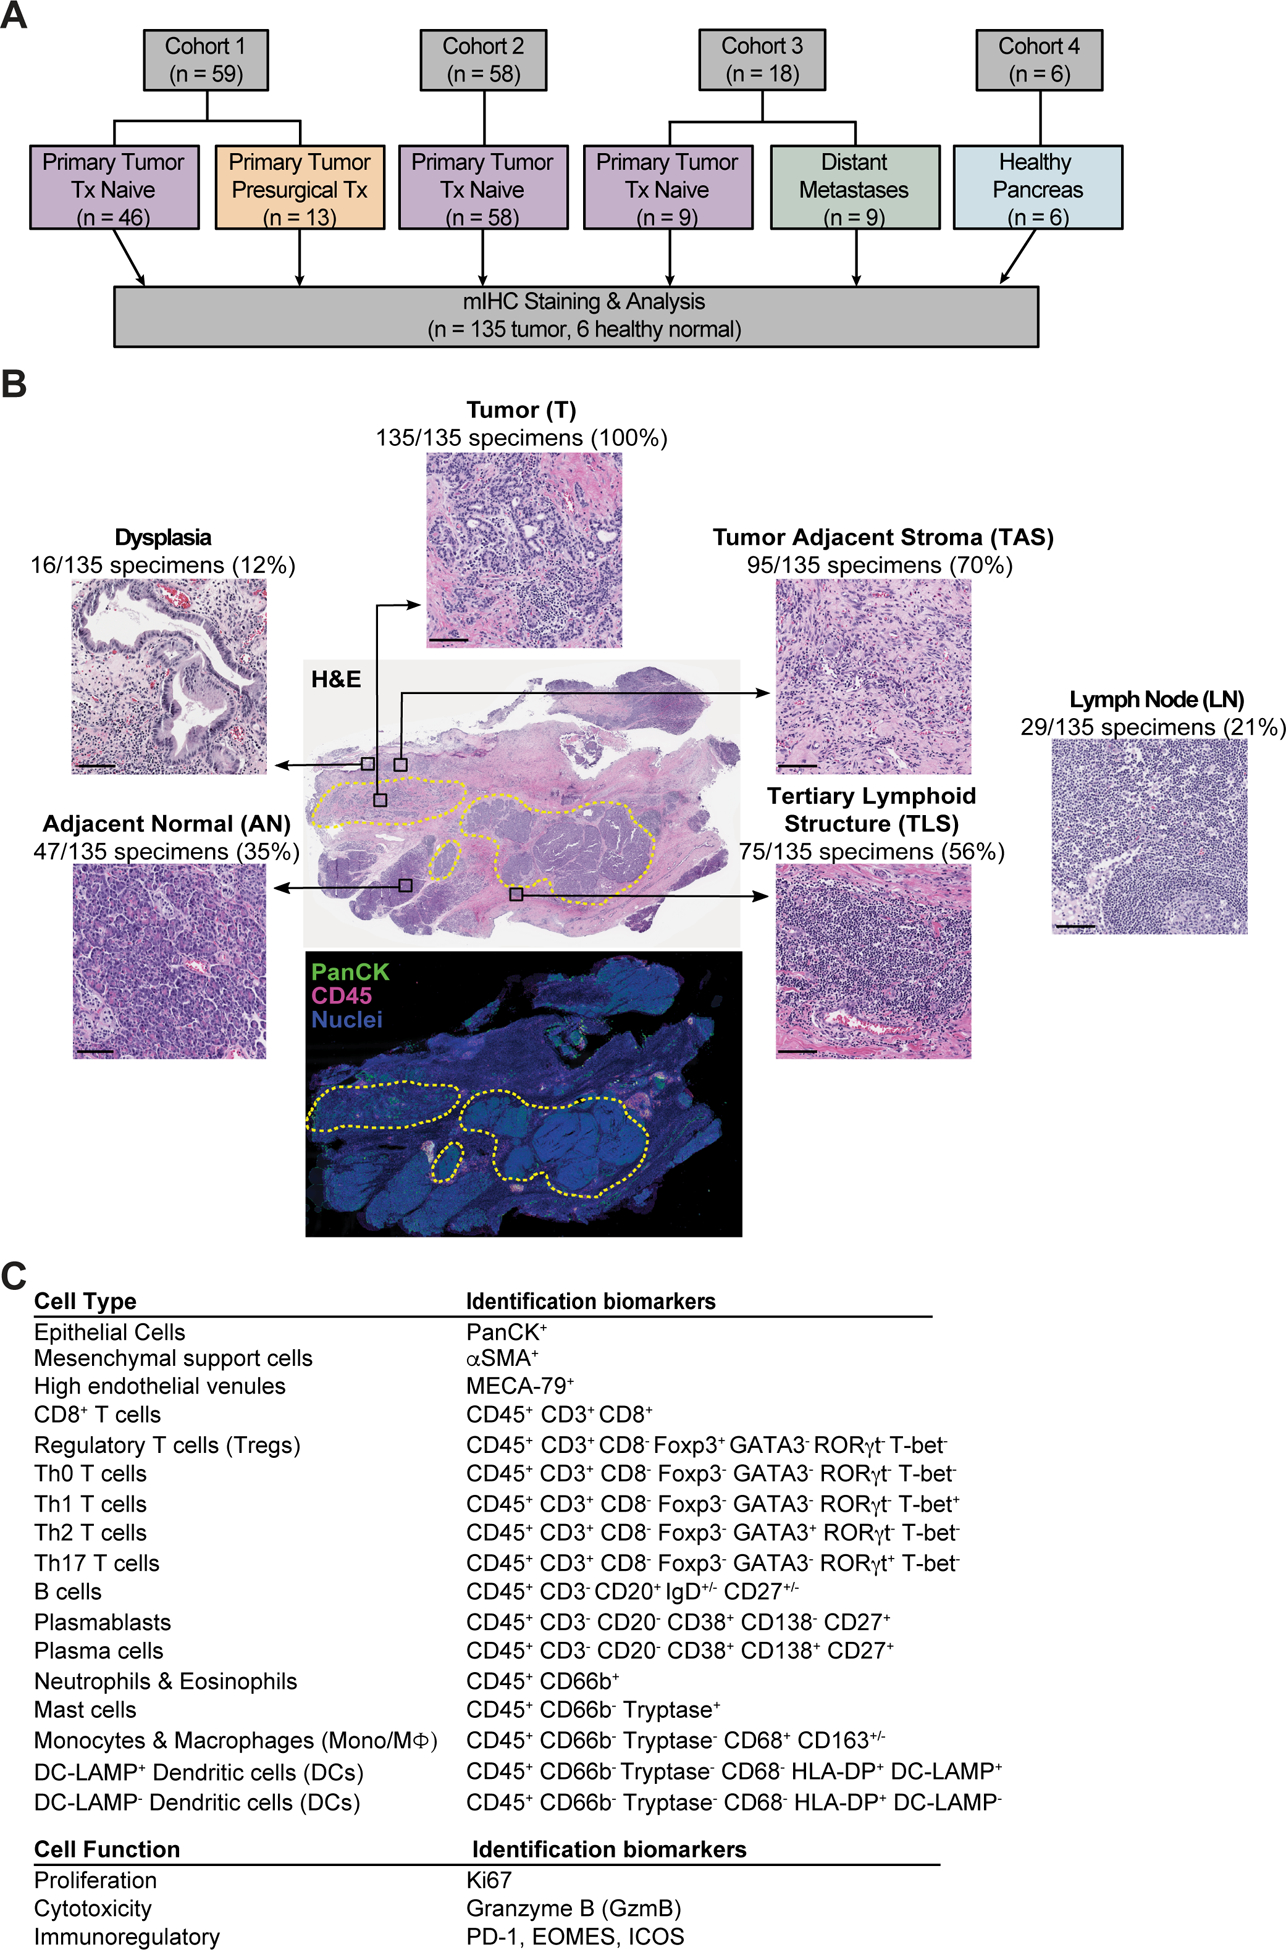
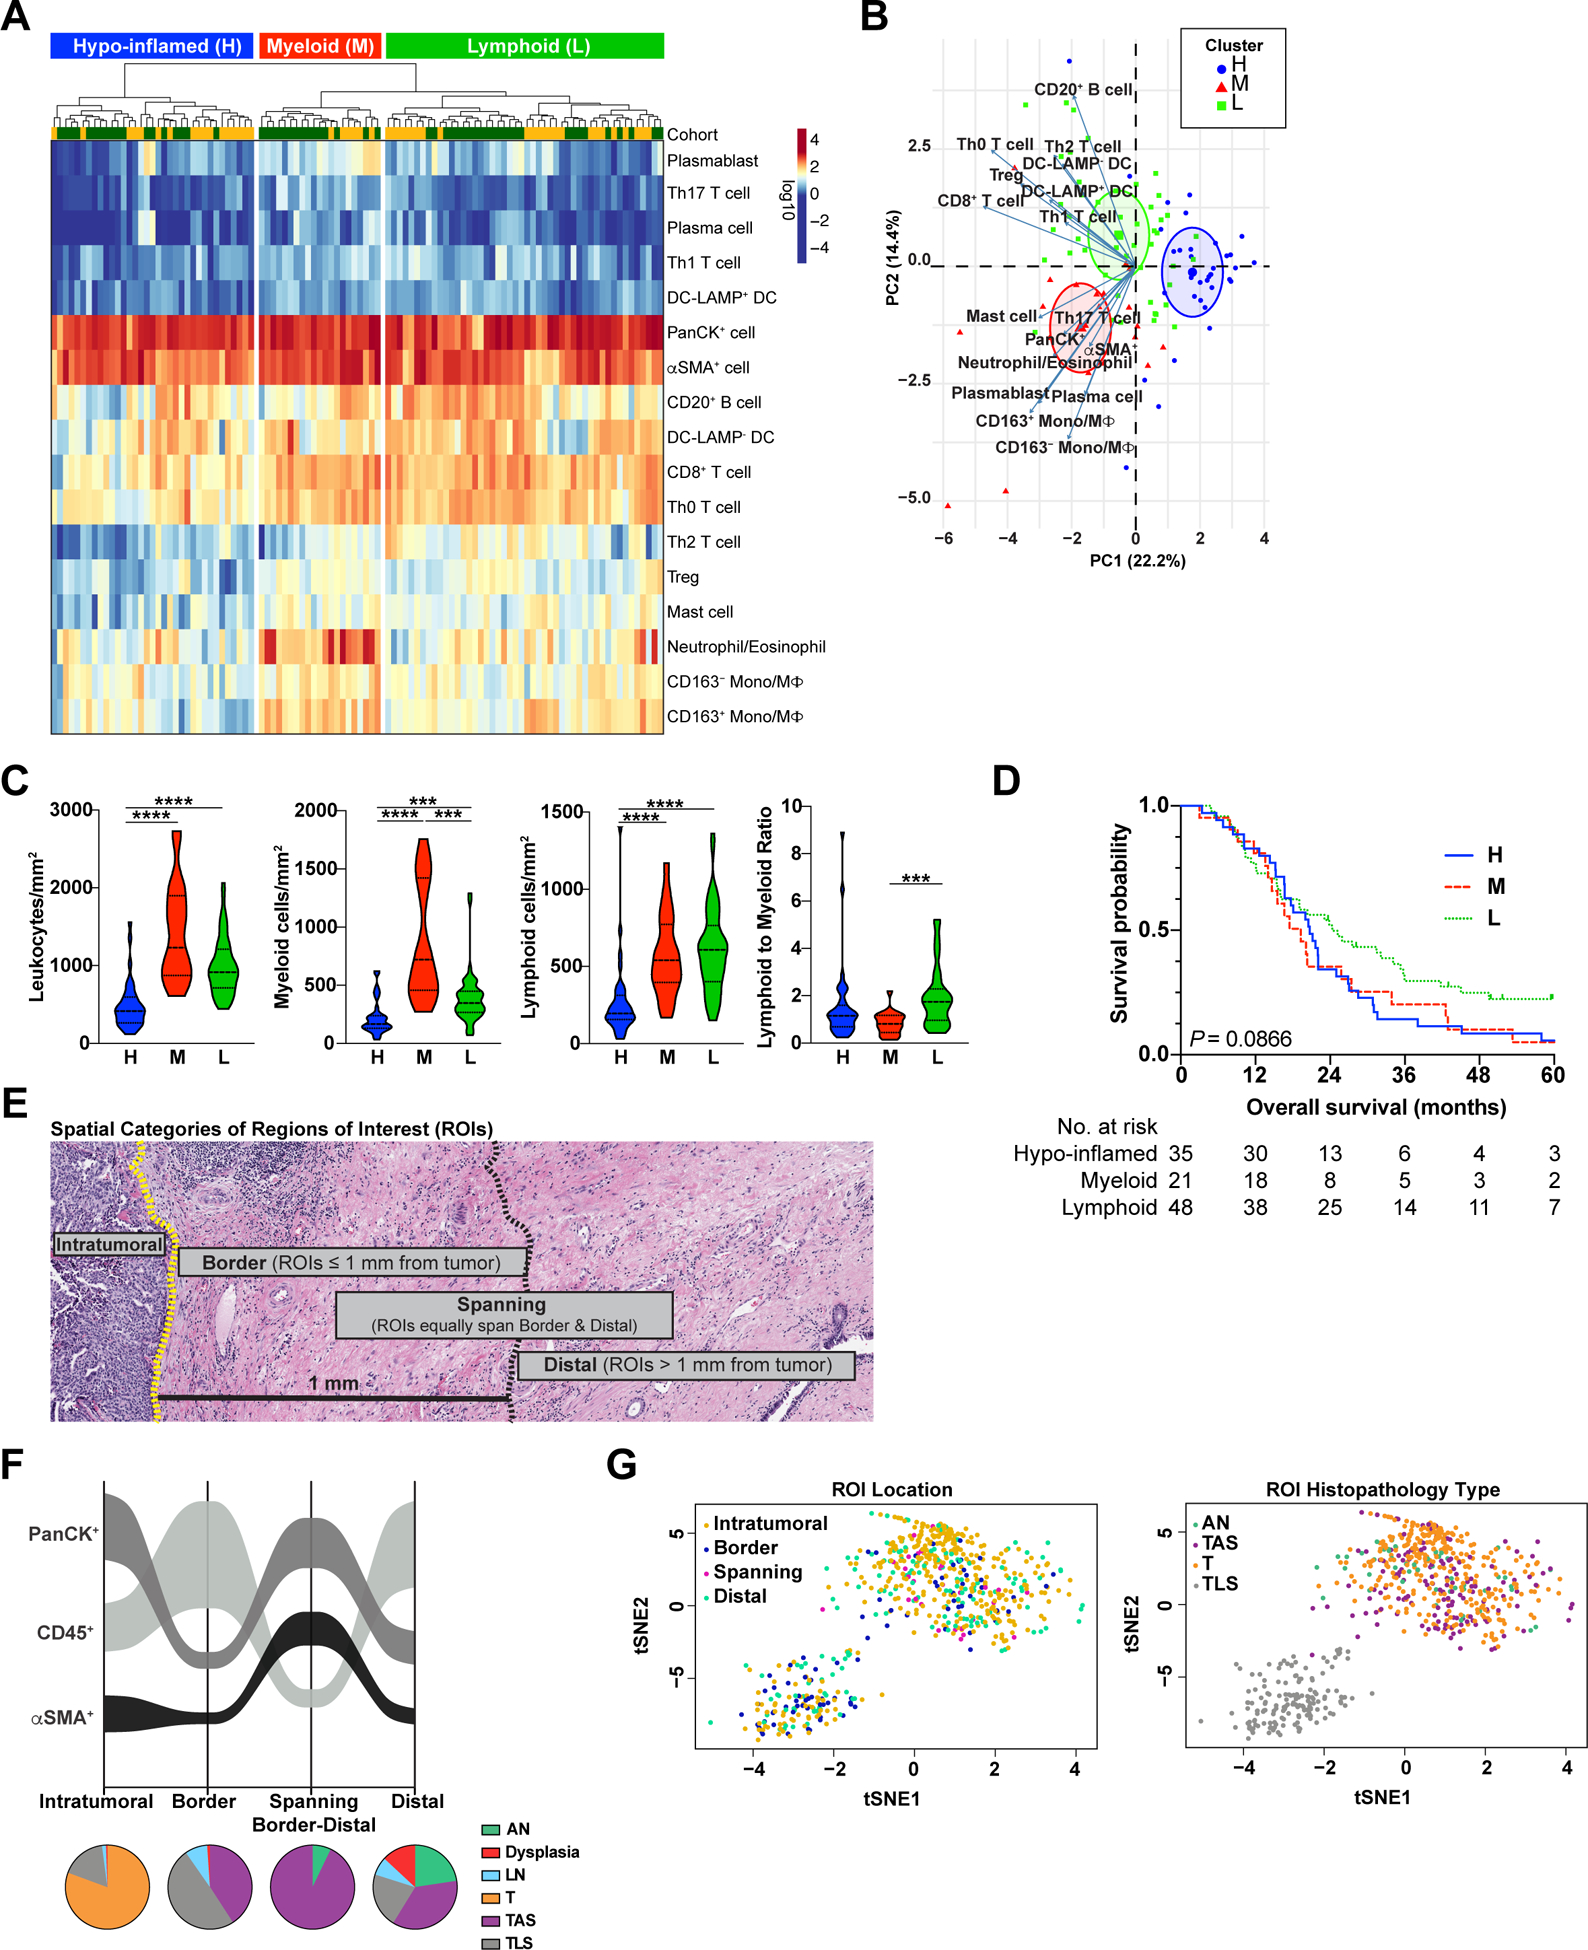
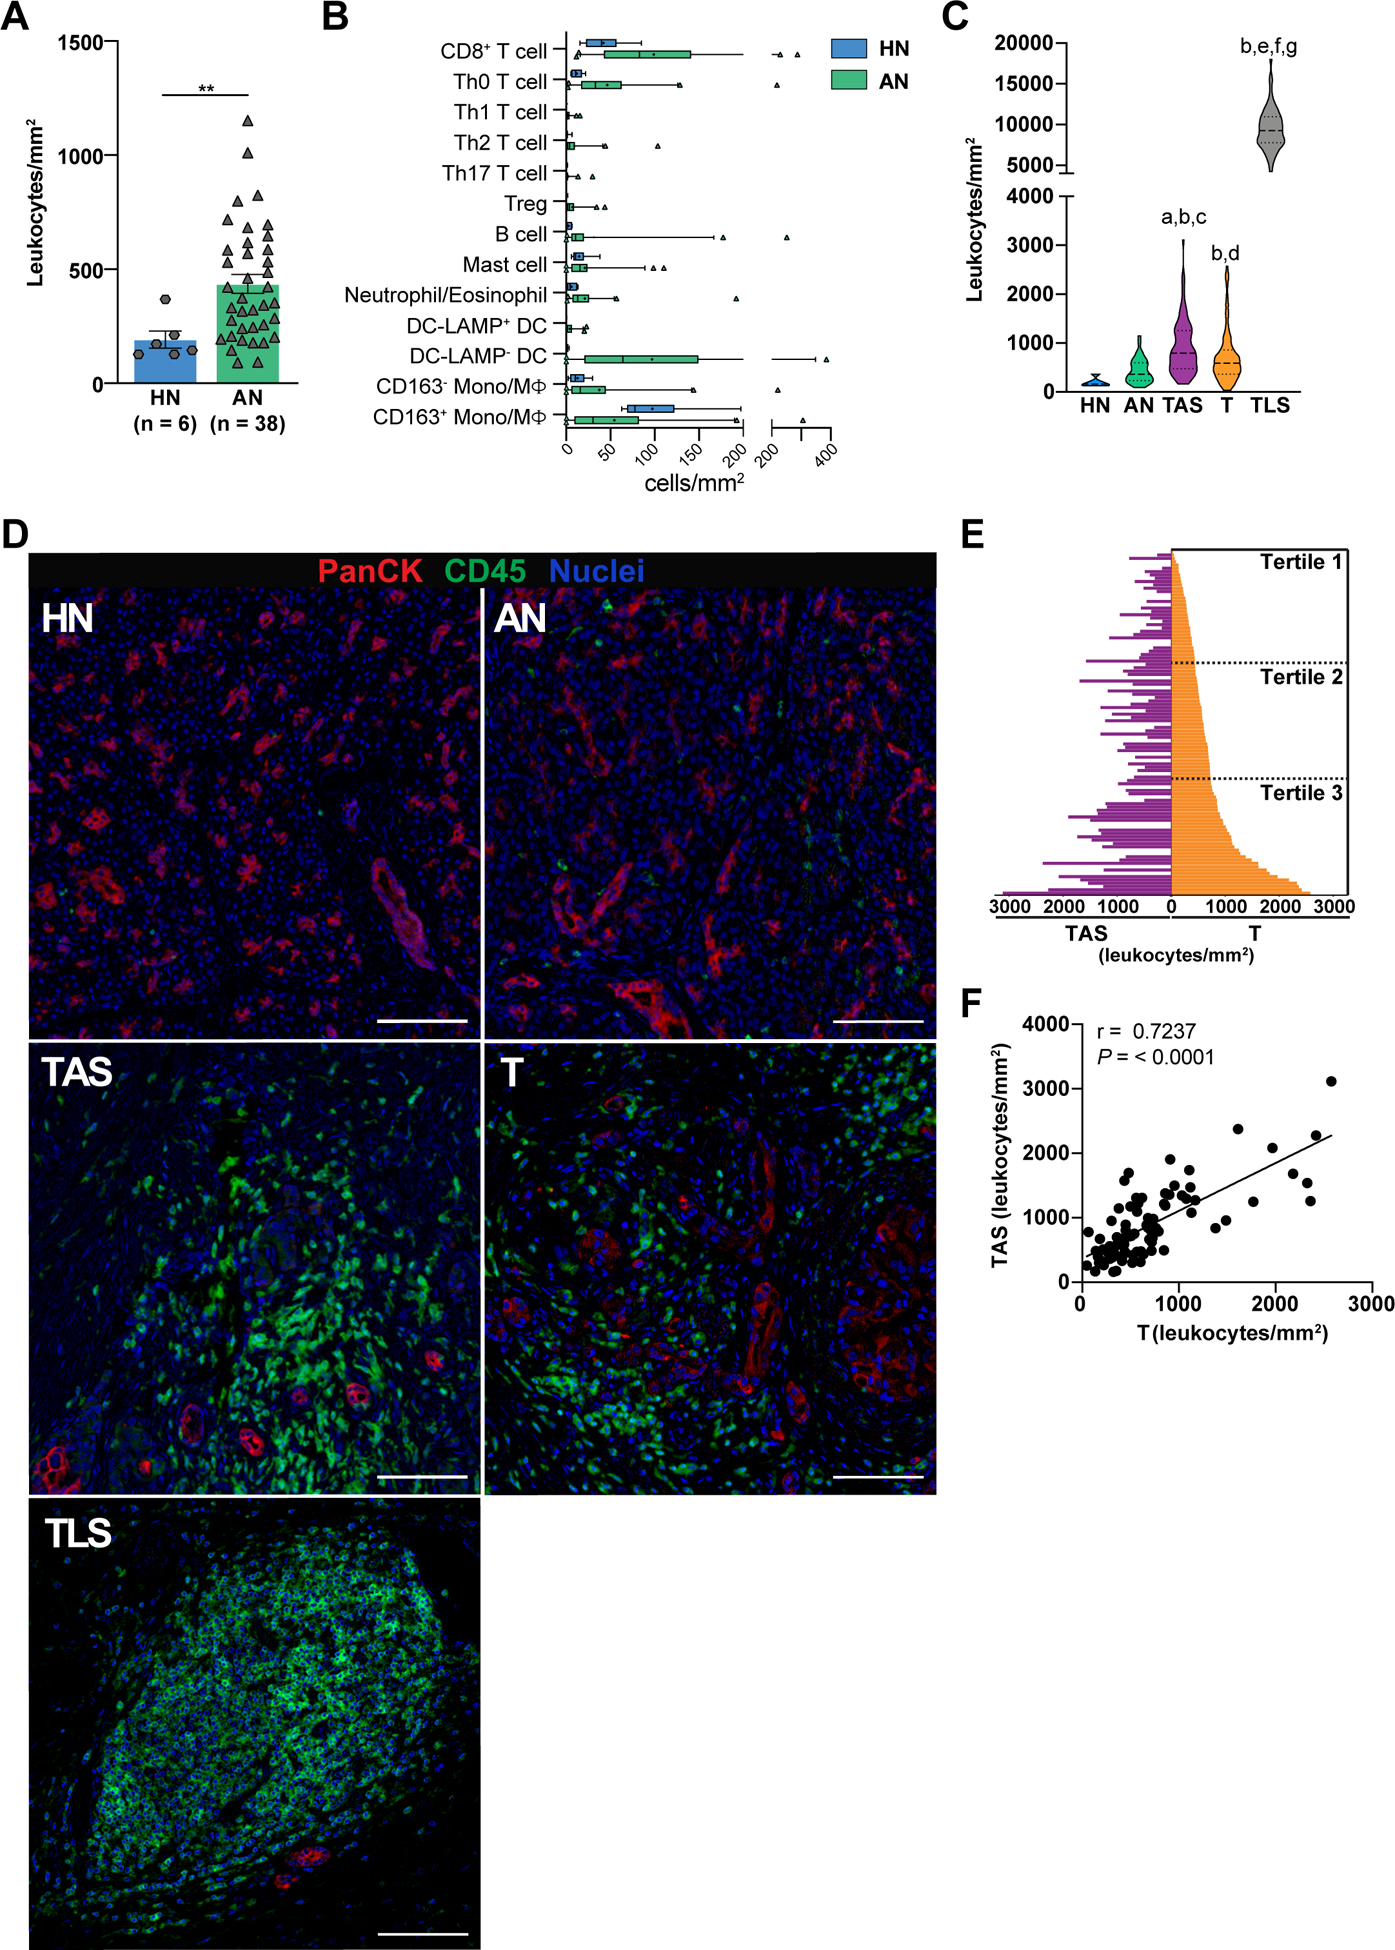
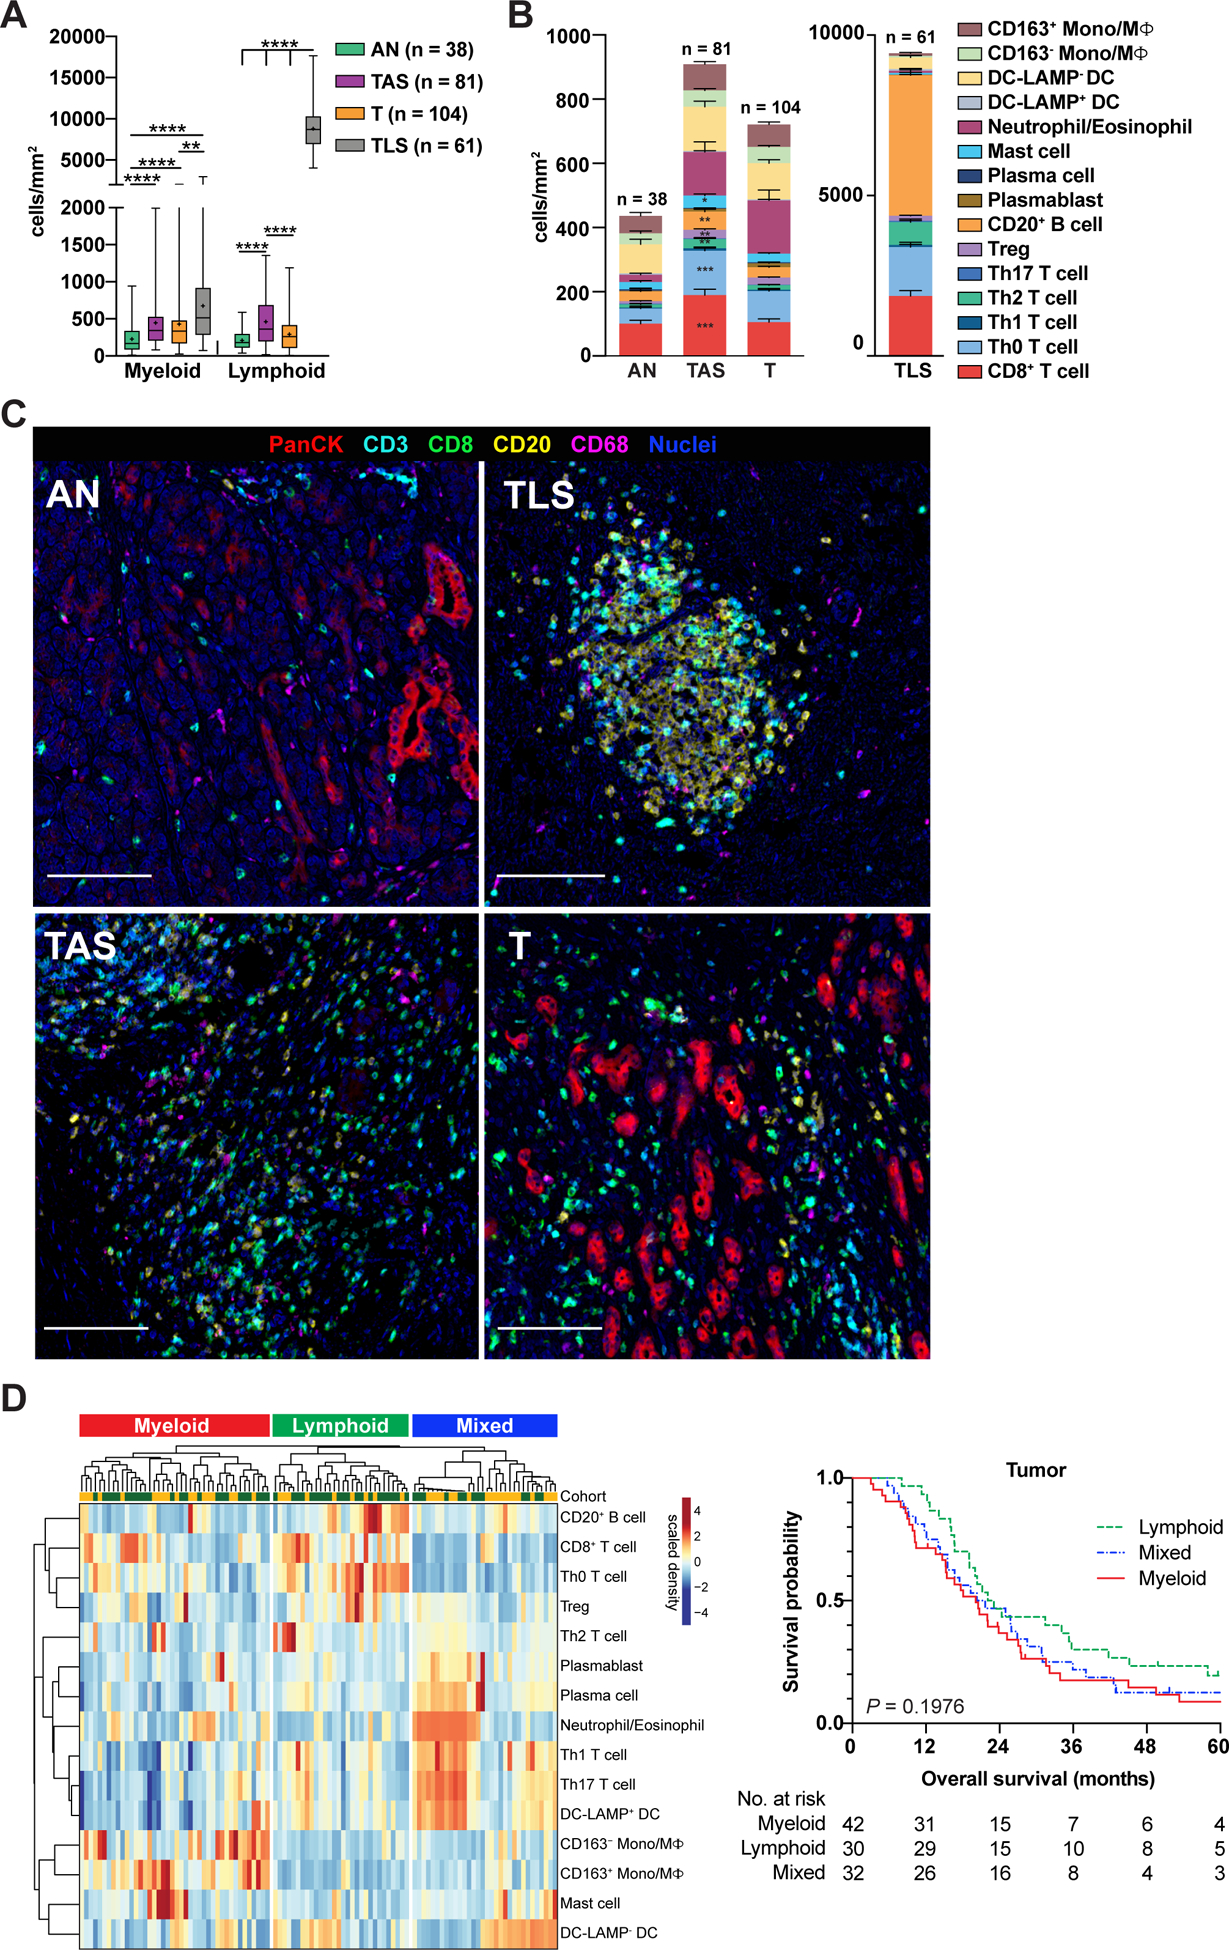
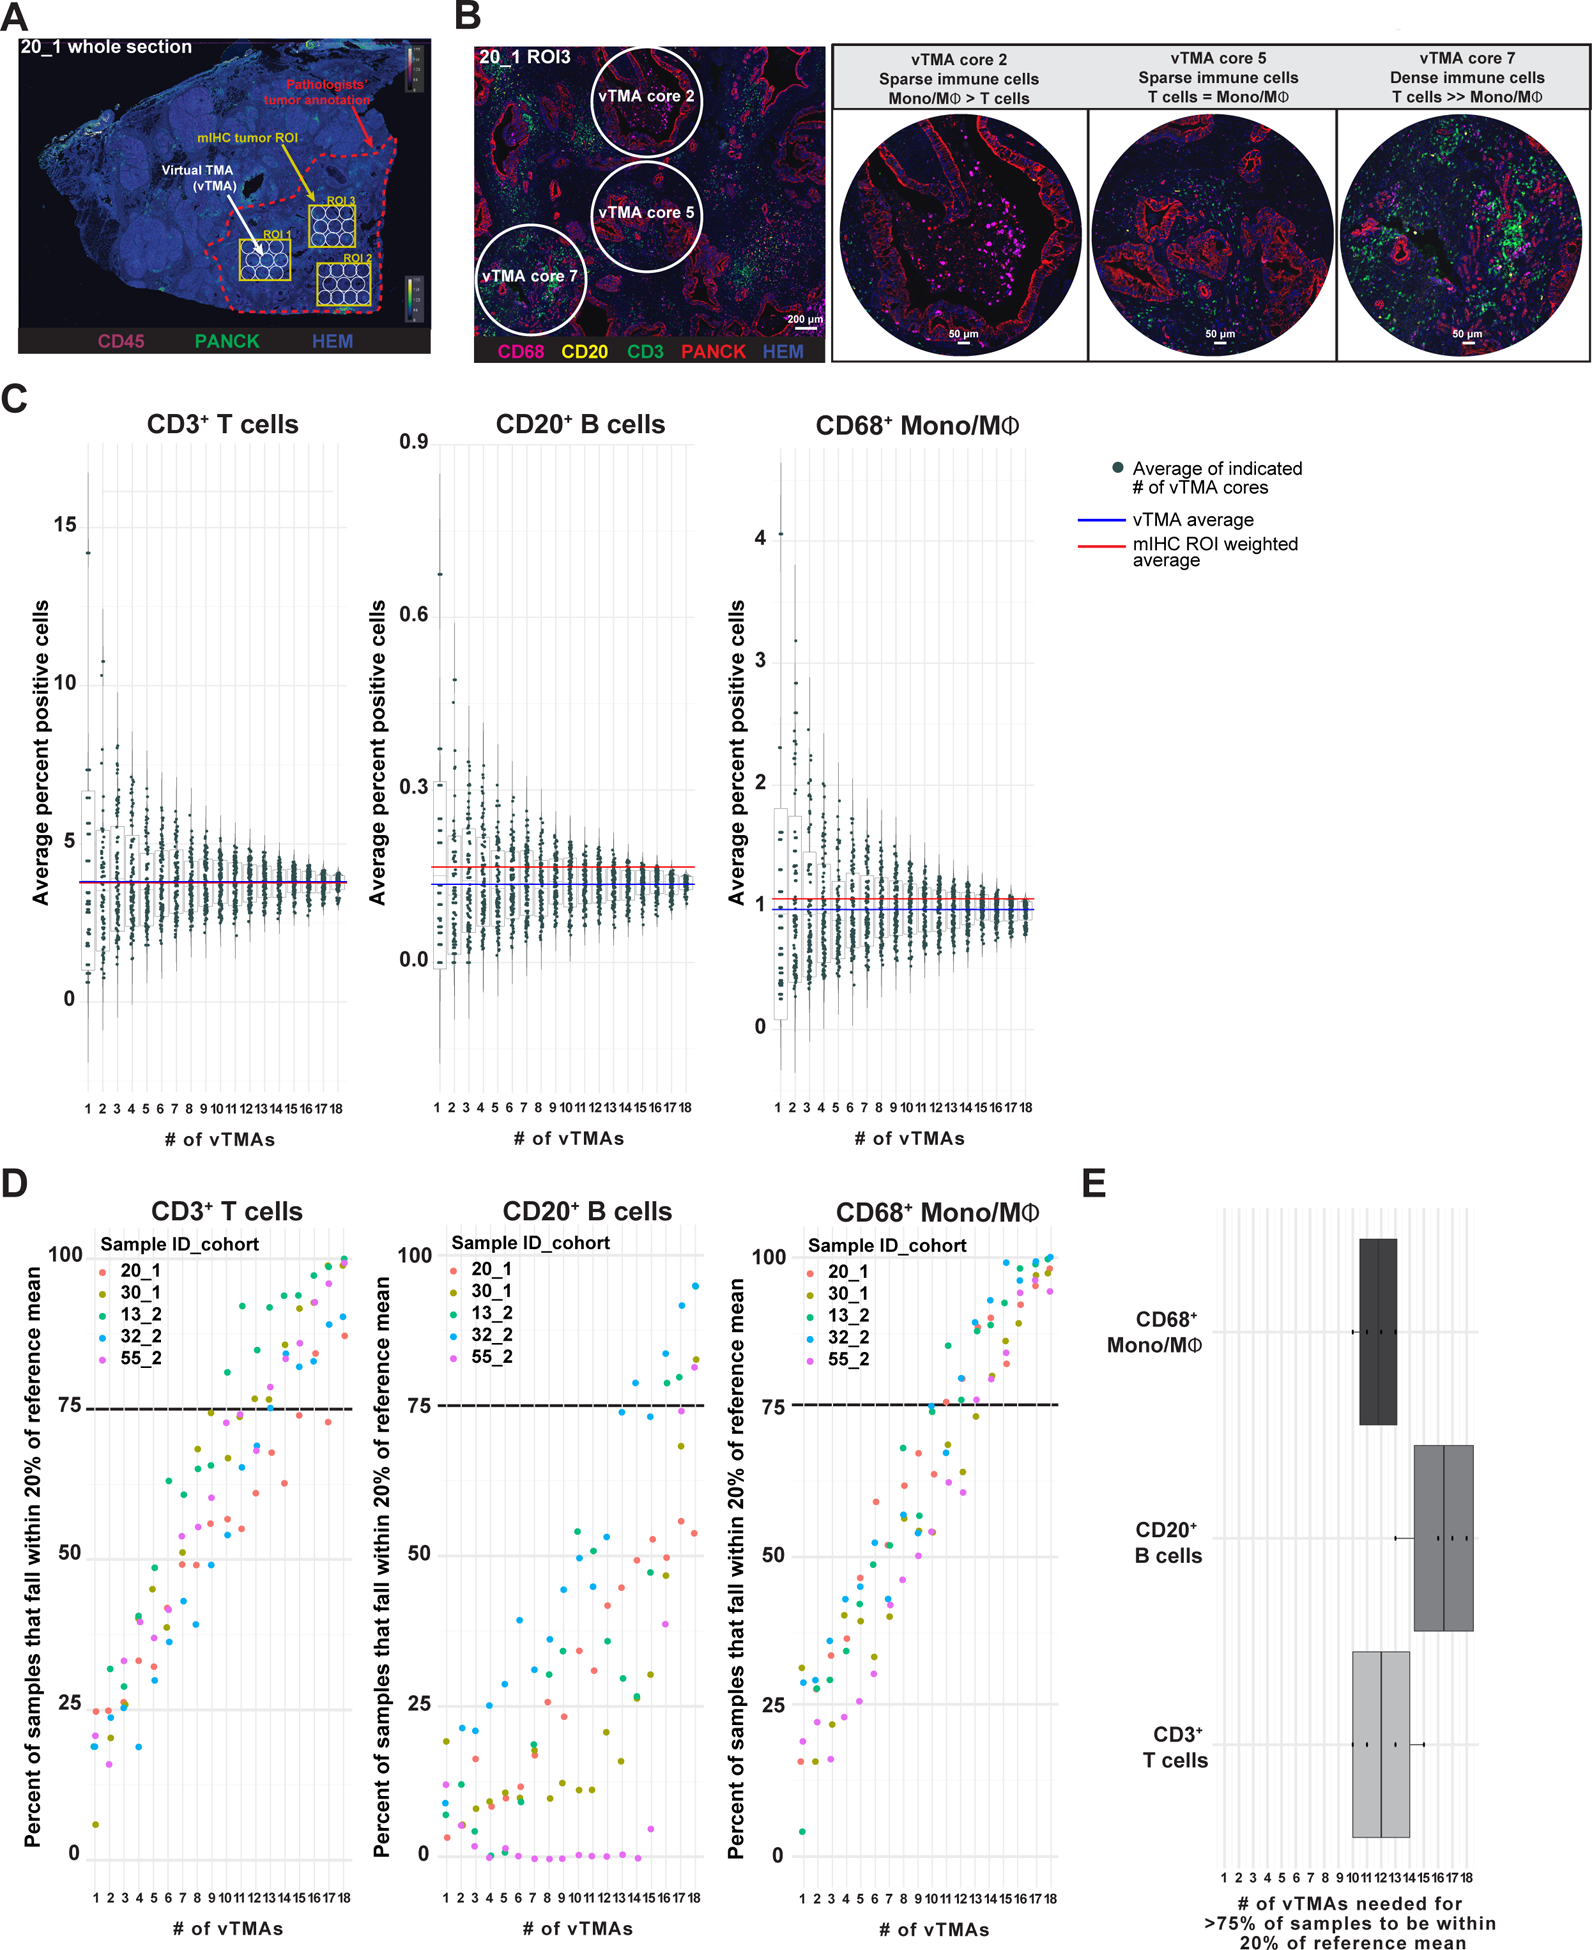
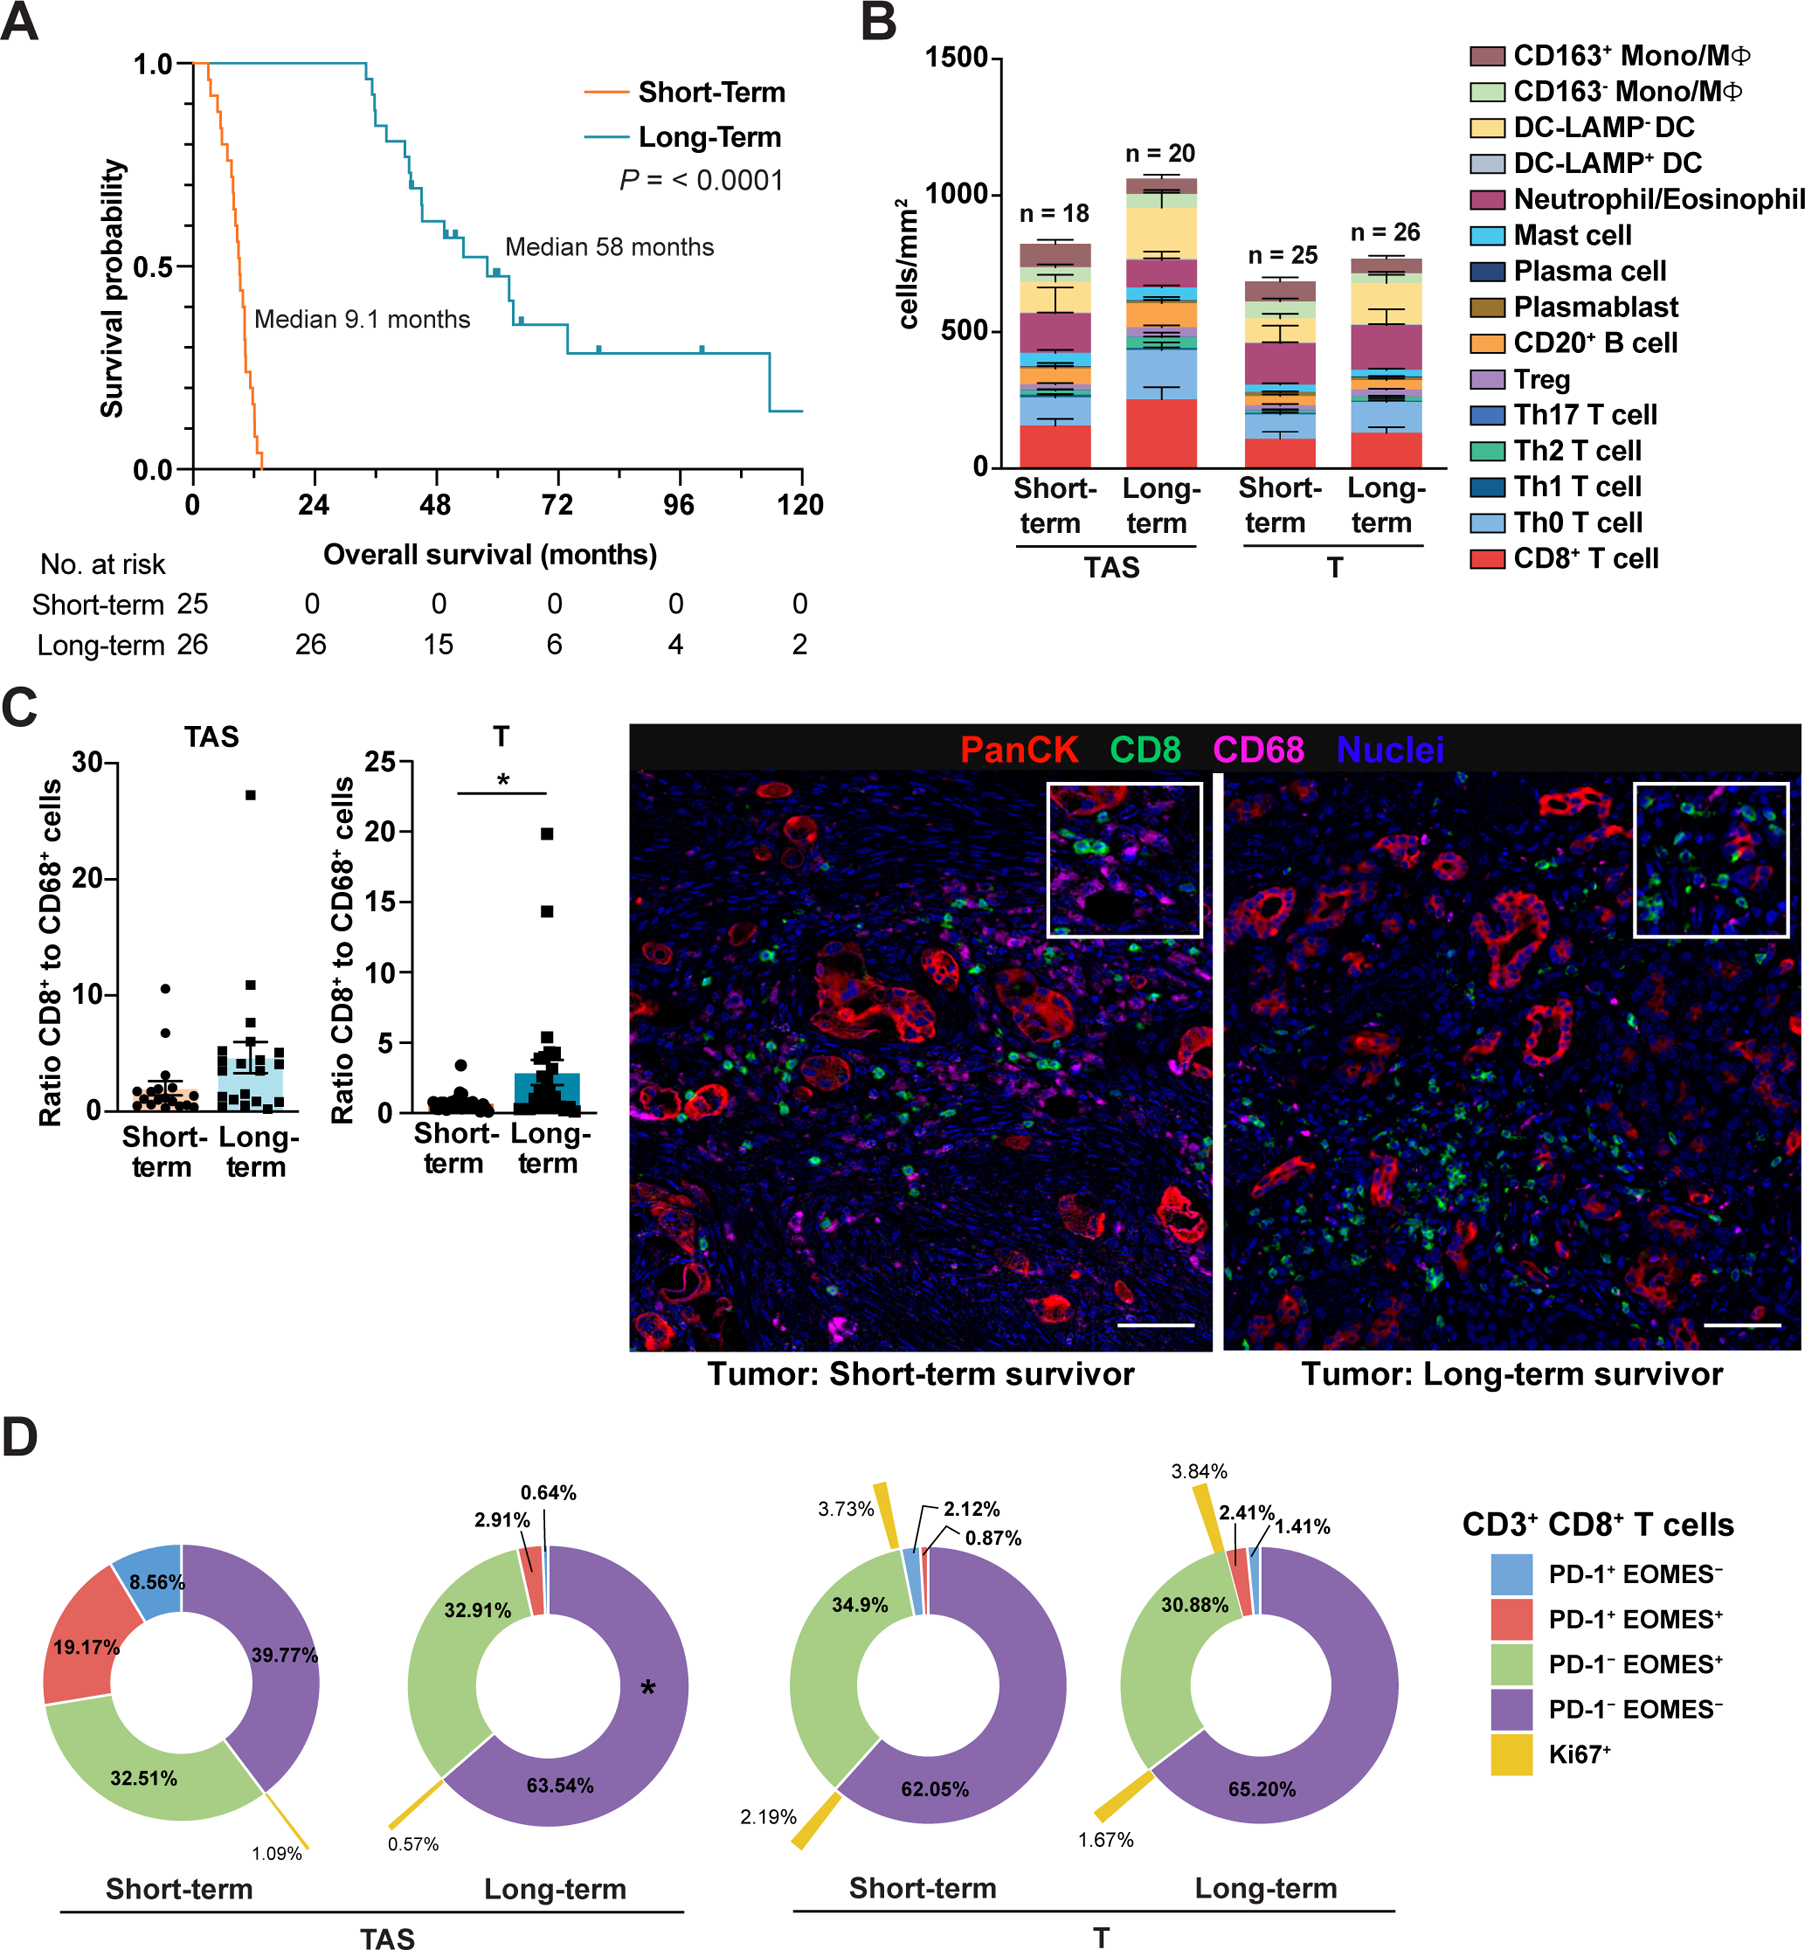
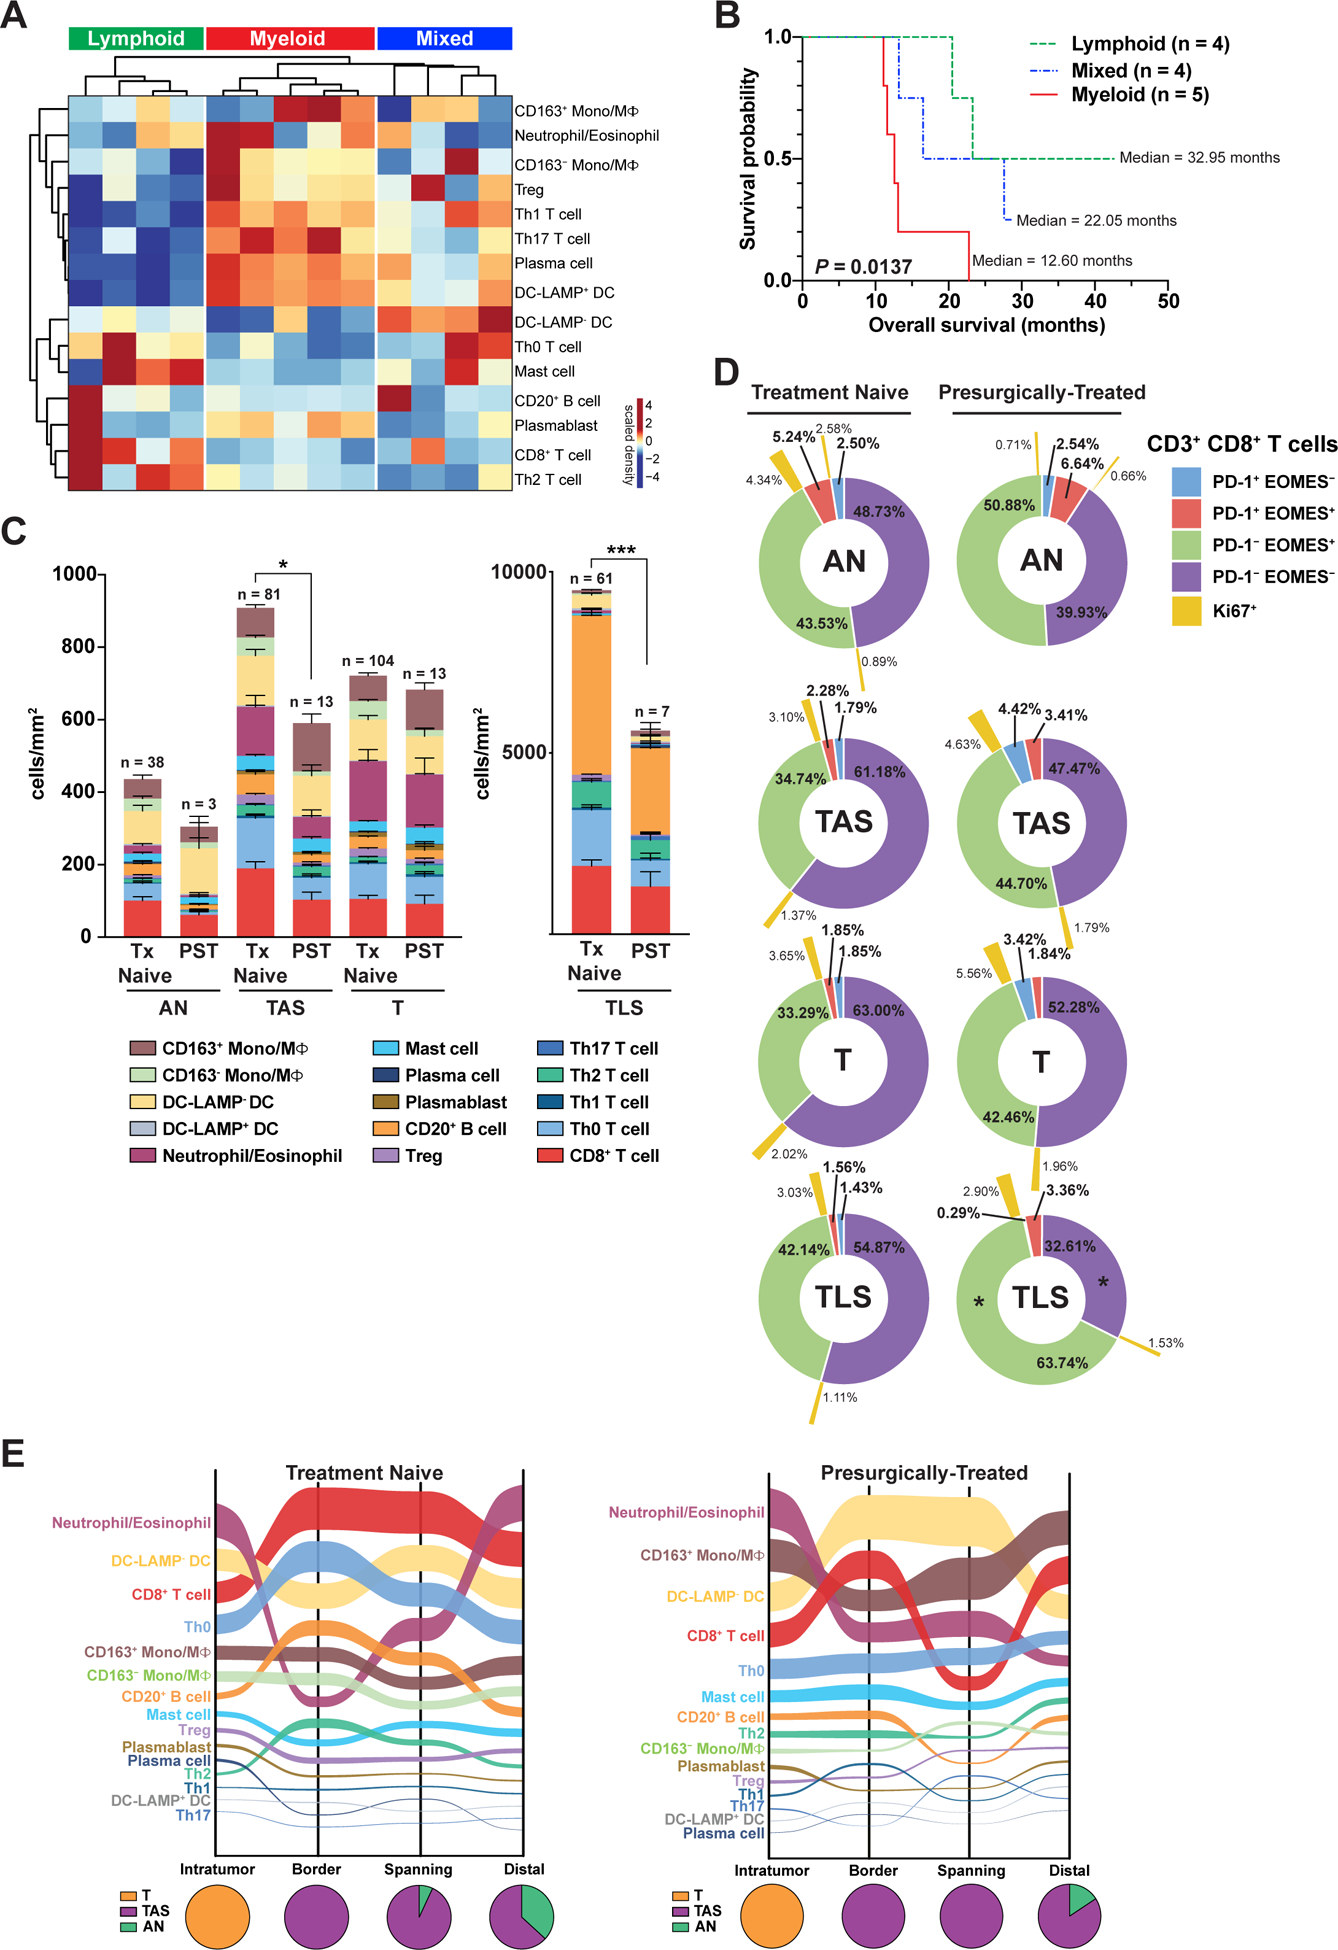
Immunotherapies targeting aspects of T cell functionality are efficacious in many solid tumors, but pancreatic ductal adenocarcinoma (PDAC) remains refractory to these treatments. Deeper understanding of the PDAC immune ecosystem is needed to identify additional therapeutic targets and predictive biomarkers for therapeutic response and resistance monitoring. To address these needs, we quantitatively evaluated leukocyte contexture in 135 human PDACs at single-cell resolution by profiling density and spatial distribution of myeloid and lymphoid cells within histopathologically defined regions of surgical resections from treatment-naive and presurgically (neoadjuvant)-treated patients and biopsy specimens from metastatic PDAC. Resultant data establish an immune atlas of PDAC heterogeneity, identify leukocyte features correlating with clinical outcomes, and, through an in silico study, provide guidance for use of PDAC tissue microarrays to optimally measure intratumoral immune heterogeneity. Atlas data have direct applicability as a reference for evaluating immune responses to investigational neoadjuvant PDAC therapeutics where pretherapy baseline specimens are not available. SIGNIFICANCE: We provide a phenotypic and spatial immune atlas of human PDAC identifying leukocyte composition at steady state and following standard neoadjuvant therapies. These data have broad utility as a resource that can inform on leukocyte responses to emerging therapies where baseline tissues were not acquired.This article is highlighted in the In This Issue feature, p. 1861.


Conflict of interest statement

Conflict of Interests: R.H. Vonderheide reports having received consulting fees or honoraria from Celldex, Lilly, Medimmune, and Verastem. He is an inventor on a licensed patent relating to cancer cellular immunotherapy and receives royalties from Children’s Hospital Boston for a licensed research-only monoclonal antibody. E.M. Jaffee is a paid consultant for Adaptive Biotech, CSTONE, Achilles, DragonFly, and Genocea. She receives funding from Lustgarten Foundation and AduroBiotech and through a licensing agreement between AduroBiotech and JHU has the potential to receive royalties on GVAX. She is the Chief Medical Advisor for Lustgarten and serves on the National Cancer Advisory Board and as an Advisor to the Parker Institute for Cancer Immunotherapy (PICI). B.M. Wolpin reports research funding from Celgene and Eli Lilly and consulting for BioLineRx, Celgene, G1 Therapeutics, and GRAIL. L.M. Coussens is a paid consultant for Cell Signaling Technologies, AbbVie Inc., and Shasqi Inc., received reagent and/or research support from Plexxikon Inc., Pharmacyclics, Inc., Acerta Pharma, LLC, Deciphera Pharmaceuticals, LLC, Genentech, Inc., Roche Glycart AG, Syndax Pharmaceuticals Inc., Innate Pharma, NanoString Technologies, and Cell Signaling Technologies, is a member of the Scientific Advisory Boards of Syndax Pharmaceuticals, Carisma Therapeutics, Zymeworks, Inc, Verseau Therapeutics, Cytomix Therapeutics, Inc., and Kineta Inc, and is a member of the Lustgarten Therapeutics Advisory working group. No potential conflicts of interest were disclosed by the other authors.

Figures

Figure 1.
Figure 1.. Overview of human pancreas specimens and cell populations evaluated by mIHC.
(A) Cohort diagram of human PDACs and healthy pancreas evaluated herein. (B) Representative PDAC tissue section stained with hematoxylin and eosin (H&E) (top) illustrating types of histopathologic regions analyzed, with corresponding serial section of mIHC-stained tissue (bottom) displayed in pseudocolor with pan-cytokeratin (PanCK; green), CD45 (pink), and nuclei (blue). Yellow dotted lines represent pathologist’s annotations of tumor (T) areas. Number of PDAC specimens containing each histopathologic region type are indicated. H&E image of LN at right is from a different treatment-naïve PDAC resection specimen within the cohort. Scale bars, 100 μm. (C) Cell lineages identified by hierarchical gating of lineage-selective and functional biomarkers during image cytometry analysis of mIHC staining.
Figure 2.
Figure 2.. Global analysis of treatment-naïve PDAC surgical resections reveals distinct immune phenotypes.
(A) Unsupervised hierarchical clustering of treatment-naive PDACs from Cohorts 1 (yellow, uppermost row) and 2 (green, uppermost row) showing cell densities of indicated cell subsets (rows). Cell densities for each patient (columns) reflect cumulative densities from all analyzed ROIs per patient. (B) PCA of cell population densities from ‘A’. Each symbol represents one patient. H, hypo-inflamed cluster, n = 35; M, myeloid-enriched cluster, n = 21; L, lymphoid-enriched cluster, n = 48. (C) Indicated cell densities and ratios based on clusters from ‘A’. Statistical differences between groups were determined by Kruskal-Wallis tests with Dunn’s correction for multiple comparisons. (D) Kaplan-Meier curves displaying OS of patients based on clusters defined in ‘A’. P-value was determined by log-rank test. (E) Representative H&E of PDAC depicting spatial categories (‘Intratumoral’, ‘Border’, ‘Spanning’, and ‘Distal’) assigned to each individual region of interest (ROI) analyzed. (F) Sankey flow diagram representing relative densities (cells/mm2) of PanCK+ epithelial cells, CD45+ leukocytes, and αSMA+ mesenchymal support cells within treatment-naïve PDAC specimens across each spatial category (X-axis). Populations are sorted on the Y-axis from highest (top) to lowest (bottom) density, where ribbon width is scaled to density. Pie charts below represent relative contribution of different histopathologic region types (AN, Dysplasia, LN, T, TAS, TLS) within each spatial category. Number of individual ROIs evaluated is listed in Table S6. (G) t-SNE representation of cell density within individual ROIs (dots) color coded by ROI spatial location (left) and histopathology type (right).
Figure 3.
Figure 3.. Leukocyte density in treatment-naïve PDAC.
(A) Total leukocyte density in healthy normal (HN) pancreas from organ transplant donors versus PDAC adjacent normal (AN) pancreas. Each data point represents cumulative cell density from multiple ROIs in a single resection specimen. Statistical differences determined by two-tailed, unpaired Mann-Whitney U test. Data represented as mean ± SEM. (B) Leukocyte composition of HN compared to AN. Box plots show median and interquartile range with means indicated by (+) symbols. (C) Comparison of leukocyte density in HN and indicated treatment-naïve PDAC histopathology regions (from Cohorts 1 and 2). Statistical differences between histopathologic regions determined by mixed model repeated measures ANOVA on log-transformed data with heterogeneous compound symmetry (CSH) covariance structure to assess within-patient correlation. Tukey-Kramer post-hoc correction was applied, and adjusted P-values are reported: aP < 0.001 versus HN; bP < 0.0001 versus AN; cP <0.001 versus T; dP < 0.01 versus HN; eP < 0.0001 versus HN; fP < 0.0001 versus TAS; gP < 0.0001 versus T. (D) Representative pseudocolored images showing epithelial cells (PanCK+) and leukocytes (CD45+) in HN, AN, TAS, T, and TLS regions. Scale bars, 100 μm. (E) Leukocyte density within PDAC T regions (right) and patient-matched TAS (left) sorted low-to-high for intratumoral leukocyte density (T, n = 104; TAS, n = 81). Tumor leukocyte density tertiles are indicated. (F) Spearman correlation of leukocyte density in patient-matched T and TAS PDAC specimens (n = 81).
Figure 4.
Figure 4.. Regional characteristics of lymphoid and myeloid cell enrichment in PDAC.
(A) Myeloid and lymphoid cell densities within indicated regions of treatment-naïve PDAC samples from Cohorts 1 and 2. ‘Myeloid’ reflects cumulative densities of mast cells, neutrophils/eosinophils, DCs, and Mono/MΦ. ‘Lymphoid’ reflects cumulative densities of CD3+ T cells and B cells, including plasma cells and plasmablasts. Statistical differences were determined by mixed model repeated measures ANOVA on log-transformed data with heterogeneous compound symmetry (CSH) covariance structure to assess within-patient correlation. Tukey-Kramer post-hoc correction was applied, and adjusted P-values are reported. (B) Immune composition of PDAC regions from surgical resection specimens shown in ‘A’. A mixed effects model was used to determine differences in cell population densities in T versus TAS. Data represented as mean ± SEM. (C) Representative pseudocolored images of regions quantitated in ‘B’ depicting PanCK+, CD3+, CD8+, CD20+, and CD68+ cell types. Scale bars, 100 μm. (D) Unsupervised hierarchical clustering (left) of treatment-naive PDACs from Cohorts 1 (yellow, uppermost row) and 2 (green, uppermost row) showing relative enrichment of indicated leukocyte subsets (rows) in tumor (T) regions. Data is patient-scaled and immune population z-scored for visualization. Each column represents one patient (n = 104) and reflects multiple tumor ROIs per specimen. Kaplan-Meier curve (right) displaying OS of patients based on clusters; P-value determined by log-rank test.
Figure 5.
Figure 5.. Intrapatient leukocyte heterogeneity in treatment-naïve PDACs.
(A) Representative pseudocolored image depicting PanCK, CD45, and hematoxylin (nuclei) mIHC from one PDAC specimen (Sample 20, Cohort 1) with overlays indicating pathologist’s tumor annotation (red dashed line), T ROIs used in mIHC quantitative analysis (yellow boxes), and vTMA cores (white circles). (B) Pseudocolored image showing CD68, CD20, CD3, PanCK, and nuclei immunostaining of ROI3 from Sample 20 Cohort 1 (20_1), highlighting vTMA cores 2, 5, and 7. Scale bar equals 200 μm (left). Higher magnification images of vTMA cores (right). (C) CD3+ T cell (left), CD20+ B cell (middle), and CD68+ monocyte/macrophage (right) cell frequencies calculated from the average of 1–18 vTMA cores (x-axis) for 100 sample iterations. The vTMA averages (blue lines, sample reference) and mIHC ROI weighted averages (red line) are shown. (D) Percent of data from vTMA sample iterations that falls within 20% of the reference mean (vTMA mean, blue line in panel C) for 1–18 vTMA cores for 3 cell types and 5 patients. A cutoff of 75% of vTMA derived data falling within 20% of the reference mean was chosen as a relative confidence measure and is highlighted with a black dotted line. (E) Number of vTMA cores required to achieve 75% confidence level described in panel D for indicated cell types.
Figure 6.
Figure 6.. CD8+ T cell to CD68+ cell ratios correlate with clinical outcome
(A) Kaplan-Meier curves displaying OS of treatment-naïve short-term (1st quartile OS time) and long-term (4th quartile OS time) survivors from Cohorts 1 and 2. P-value determined by log-rank test. (B) Leukocyte composition in T and patient-matched TAS from short-term and long-term survivors. Data are represented as mean ± SEM. (C) Ratio of CD8+ T cells to total CD68+ Mono/MΦ in T (short-term survivor, n = 25; long-term survivor, n = 26) and patient-matched TAS (short-term survivor, n = 18; long-term survivor, n = 20) with corresponding pseudocolored images from representative tumor areas. Each data point represents a single patient. Statistical differences were determined by Mann-Whitney U test. Scale bars, 50 μm. Boxed insets show higher magnification. (D) Sunburst plots of patients shown in panels ‘A-C’ depicting average frequency of CD3+CD8+ T cells within T and TAS exhibiting PD-1 and/or EOMES expression. Percentage of PD-1/EOMES subpopulations positive for Ki67 are indicated in outermost ring (yellow). Statistical differences in T cell subpopulations in short-term versus long-term survivors were evaluated by a mixed-effects model with Sidak’s multiple comparisons test.
Figure 7.
Figure 7.. Presurgical therapy shapes immune contexture but does not relieve T cell dysfunction in primary PDAC
(A) Unsupervised clustering of ‘T’ regions of PDACs from patients who received chemotherapy and/or radiotherapy prior to surgical resection (n = 13; columns), showing relative intratumoral enrichment of indicated leukocyte subtypes (rows). (B) Kaplan-Meier curve of OS based on clusters in ‘A’ with ‘n’ indicating the number of individual PDACs per cluster. P-value determined by log-rank test. (C) Immune composition of indicated histopathologic regions (AN, TAS, T, TLS) from treatment-naïve and presurgically-treated (PST) specimens. Data presented as mean ± SEM. Differences in total leukocyte density in a given region type in treatment-naïve versus presurgically-treated PDAC determined by Mann-Whitney U test. (D) Sunburst plots depicting average frequency of CD3+CD8+ T cells exhibiting PD-1 and/or EOMES positivity in indicated histopathologic regions (AN, TAS, T, TLS) of the treatment-naïve (left) and presurgically-treated (right) PDACs depicted in ‘C’. Percentage of PD-1/EOMES subpopulations positive for Ki67 indicated in outermost ring (yellow). Statistical differences in T cell subpopulations comparing treatment-naïve and treated cases determined by a mixed-effects model with Sidak correction. (E) Sankey flow diagrams of treatment-naïve and presurgically-treated PDACs representing indicated leukocyte populations sorted on the Y-axis from highest (top) to lowest (bottom) cell density, where line width is scaled to cell density across four spatial categories. Pie charts below represent relative regional contribution of different PDAC histopathologic compartments (T, TAS, AN) within each spatial category. Number of individual ROIs evaluated in this analysis is summarized in Table S6.

References

    1. Siegel RL, Miller KD, Fuchs HE, Jemal A. Cancer Statistics, 2021. CA Cancer J Clin 2021;71(1):7–33 doi 10.3322/caac.21654. - DOI - PubMed
    1. Garrido-Laguna I, Hidalgo M. Pancreatic cancer: from state-of-the-art treatments to promising novel therapies. Nat Rev Clin Oncol 2015;12(6):319–34 doi 10.1038/nrclinonc.2015.53. - DOI - PubMed
    1. Conroy T, Hammel P, Hebbar M, Ben Abdelghani M, Wei AC, Raoul JL, et al. FOLFIRINOX or Gemcitabine as Adjuvant Therapy for Pancreatic Cancer. The New England journal of medicine 2018;379(25):2395–406 doi 10.1056/NEJMoa1809775. - DOI - PubMed
    1. Conroy T, Desseigne F, Ychou M, Bouche O, Guimbaud R, Becouarn Y, et al. FOLFIRINOX versus gemcitabine for metastatic pancreatic cancer. The New England journal of medicine 2011;364(19):1817–25 doi 10.1056/NEJMoa1011923. - DOI - PubMed
    1. Morrison AH, Byrne KT, Vonderheide RH. Immunotherapy and Prevention of Pancreatic Cancer. Trends Cancer 2018;4(6):418–28 doi 10.1016/j.trecan.2018.04.001. - DOI - PMC - PubMed

Publication types

MeSH terms