

doi: 10.9745/GHSP-D-20-00517.
Print 2021 Mar 15.
Mind the Global Community Health Funding Gap
Affiliations
- PMID: 33727316
- PMCID: PMC7971370
- DOI: 10.9745/GHSP-D-20-00517
Item in Clipboard
Mind the Global Community Health Funding Gap
Glob Health Sci Pract.
.
Abstract
Community health workers play a critical role in providing both essential health services and pandemic response. Community health demonstrates a strong return on investment, but funding for this sector is limited and fragmented. Understanding the underlying costs of a community health system is crucial for both planning and policy; the data demonstrate a strong investment case.
Figures

Updated Annual Total Costs of At-Scale Community Health Worker Program Resource Needs in Sub-Saharan Africa,a by Model US$Billions Abbreviations: CHW, community health worker; FAH, Financing Alliance for Health.a Key driving factors of cost are rural versus rural and urban coverage (62% versus 100% of sub-Saharan Africa population) and higher cost per community health worker (11% difference).

Cost Comparison of National Community Health Programs Across 9 Countriesa in Sub-Saharan Africa, GDP Per Capita, US$ Abbreviation: GDP, gross domestic product.a Countries X and Y are masked - awaiting formal government approval to share the data.

Average Community Health Worker to Population Ratio in 9 Countries in Sub-Saharan Africa a Excludes country Y in the average number; model only costed one cadre who play more of a supervisory role and that serve entire population but did not include volunteer CHWs because the program has not been costed. Costs are based on recurrent costs including commodities. Costs reflected are final year costs for the duration of the community health strategy (and hence final year of costing model). This assumes that at the final year, the program will be fully scaled, hence will have reached the steady state. Steady state costing values are adjusted to 2019 US$for comparison. Countries X and Y are masked - awaiting formal government approval to share the data.

Community Health Annualized Program Costs Showing Salaries and Incentives as the Main Cost Drivers Across 9 Countries in Sub-Saharan Africaa,b a Commodities and salaries/incentives were the main cost drivers accounting for between 50%–90% of costs. Countries X and Y are masked; awaiting formal government approval to share the data.b Key insights: overhead costs were relatively higher for countries with whole directorates; inclusion of mobile phones resulted in relatively higher costs; countries with longer training programs had relatively higher training costs.

The Average Annual Cost per Capita Served Across 9 Countries in Sub-Saharan Africa, US$a a The annual average cost per person served ranged from $1.50–$13.0. Excludes country Y in the average number; model only costed one cadre who play more of a supervisory role and that serve entire population but did not include volunteer CHWS because the program has not been costed; costs are based on recurrent costs including commodities; costs reflected are final year costs for the duration of the community health strategy (and hence final year of costing model). This assumes that at the final year, the program will be fully scaled, hence will have reached the steady state. Steady state costing values are adjusted to 2019 USDs for comparison. Countries X and Y are masked; awaiting formal government approval to share the data.

Cost Efficiency of Community Health Programs With Scale in 9 Countries in Sub-Saharan Africaa a As the number of people served increases, cost per person served decreases. South Africa is an outlier with both a higher population and higher cost structure for its community health program, which is based on high-cost ward-based outreach teams, a multidisciplinary platform integrated into primary care. Excluding South Africa, the trendline goes downward indicating economies of scale likely due to shared fixed costs.

Health Impact of the Community Health Worker Program in Rwanda
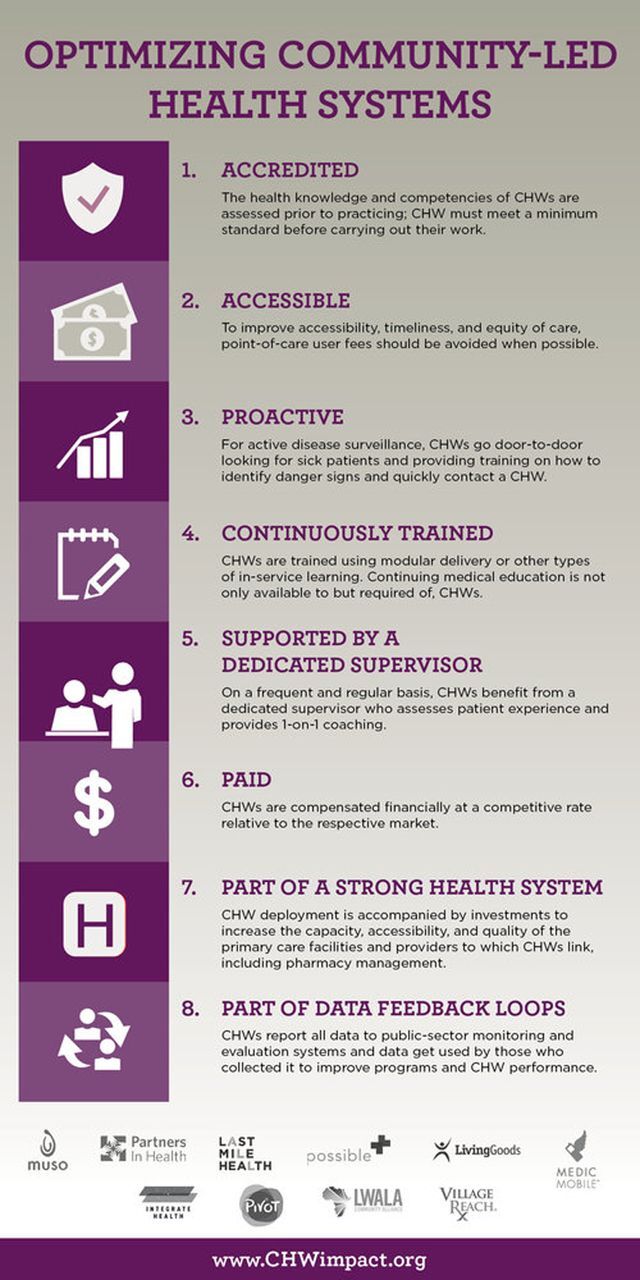
The 8 Design Principles to Design Optimized Community Programs
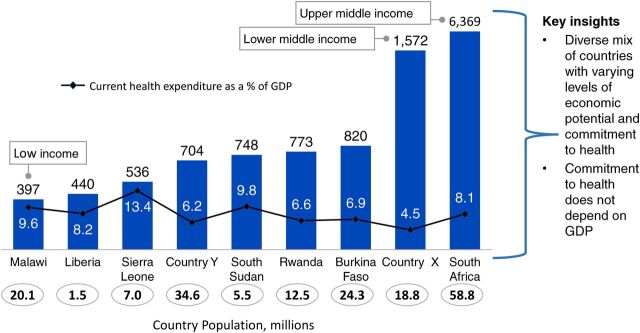
Correlation Between Country Income Status and Health Spending, Across 9 Countries in sub-Saharan Africa, Gross Domestic Product Per Capita, US$
Similar articles
-
Trends in global health financing.BMJ. 2019 May 20;365:l2185. doi: 10.1136/bmj.l2185. BMJ. 2019. PMID: 31109918 Free PMC article.
-
Innovative financing instruments for global health 2002-15: a systematic analysis.Lancet Glob Health. 2017 Jul;5(7):e720-e726. doi: 10.1016/S2214-109X(17)30198-5. Lancet Glob Health. 2017. PMID: 28619230 Review.
-
The unconscionable health gap: a global plan for justice.Lancet. 2010 May 1;375(9725):1504-5. doi: 10.1016/S0140-6736(10)60065-7. Lancet. 2010. PMID: 20435214 No abstract available.
-
Coordinating funding in public health emergencies.Lancet. 2016 May 28;387(10034):2197-8. doi: 10.1016/S0140-6736(16)30604-3. Lancet. 2016. PMID: 27302027 No abstract available.
-
A Chronology of Global Assistance Funding for NCD.Glob Heart. 2016 Dec;11(4):371-374. doi: 10.1016/j.gheart.2016.10.027. Glob Heart. 2016. PMID: 27938820 Review.
Cited by
-
Comparing the roles of community health workers for malaria control and elimination in Cambodia and Tanzania.BMJ Glob Health. 2023 Dec 9;8(12):e013593. doi: 10.1136/bmjgh-2023-013593. BMJ Glob Health. 2023. PMID: 38070880 Free PMC article. Review.
-
Country-led institutionalization of community health within primary health care: Reflections from a global partnership.J Glob Health. 2021 Mar 1;11:03037. doi: 10.7189/jogh.11.03037. J Glob Health. 2021. PMID: 33763211 Free PMC article. Review. No abstract available.
-
A Political-Economic Model of Community and Societal Health Resources: A 92-Country Global Analysis.Sociol Health Illn. 2025 Feb;47(2):e13865. doi: 10.1111/1467-9566.13865. Epub 2024 Nov 25. Sociol Health Illn. 2025. PMID: 39584813 Free PMC article.
-
Community health workers at the dawn of a new era: 11. CHWs leading the way to "Health for All".Health Res Policy Syst. 2021 Oct 12;19(Suppl 3):111. doi: 10.1186/s12961-021-00755-5. Health Res Policy Syst. 2021. PMID: 34641891 Free PMC article. Review.
-
The Lancet Global Health Commission on financing primary health care: putting people at the centre.Lancet Glob Health. 2022 May;10(5):e715-e772. doi: 10.1016/S2214-109X(22)00005-5. Epub 2022 Apr 4. Lancet Glob Health. 2022. PMID: 35390342 Free PMC article. Review. No abstract available.
References
-
- United Nations Economic Commission for Africa (UNECA). Healthcare and Economic Growth in Africa. UNECA; 2019. Accessed February 5, 2021. https://repository.uneca.org/bitstream/handle/10855/43118/b11955521.pdf
-
- Dahn B, Woldemariam AT, Perry H, et al. . Strengthening Primary Health Care Through Community Health Workers: Investment Case and Financing Recommendations. World Health Organization; 2015. Accessed February 5, 2021. https://www.who.int/hrh/news/2015/CHW-Financing-FINAL-July-15-2015.pdf?ua=1
-
- Women in the changing world of community health work. CHW Central. Accessed February 5, 2021. https://chwcentral.org/twg_article/women-in-the-changing-world-of-commun...
MeSH terms
LinkOut - more resources
Full Text Sources
Other Literature Sources
Miscellaneous