

Exposure density and neighborhood disparities in COVID-19 infection risk
- PMID: 33727410
- PMCID: PMC8020638
- DOI: 10.1073/pnas.2021258118
Exposure density and neighborhood disparities in COVID-19 infection risk
Abstract
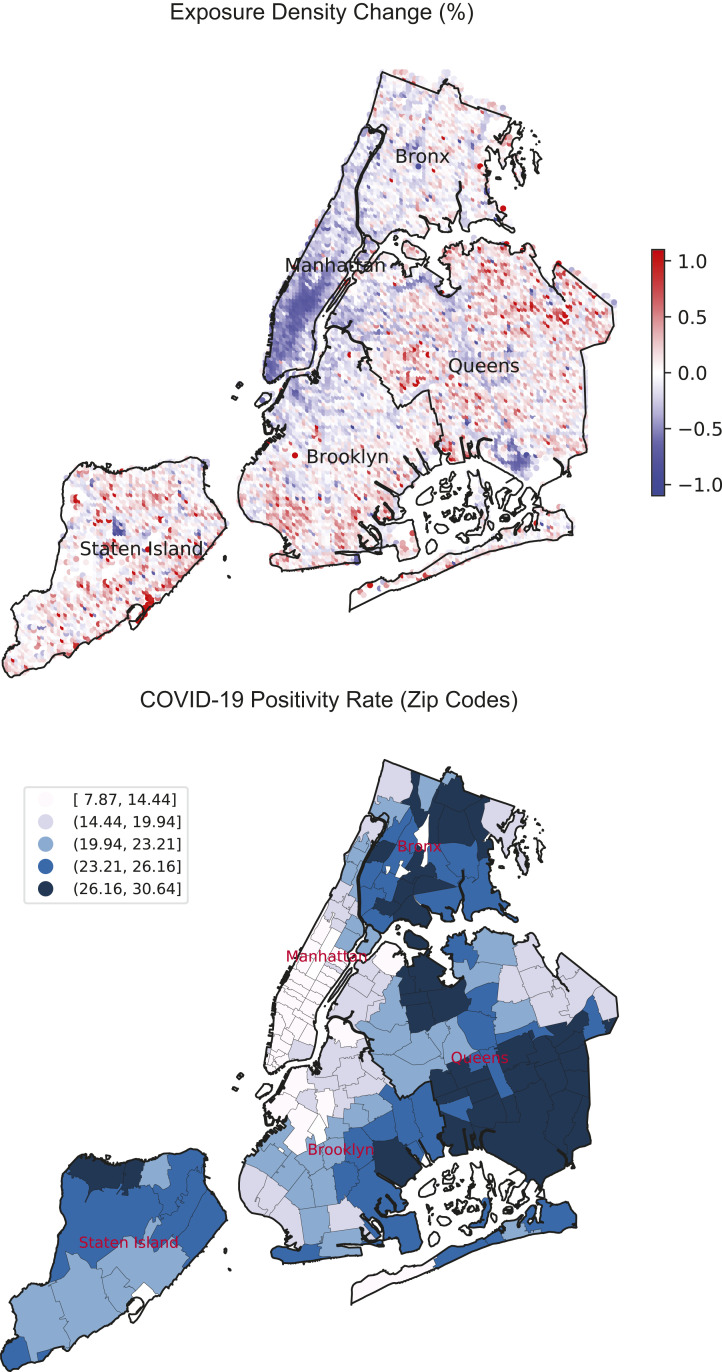
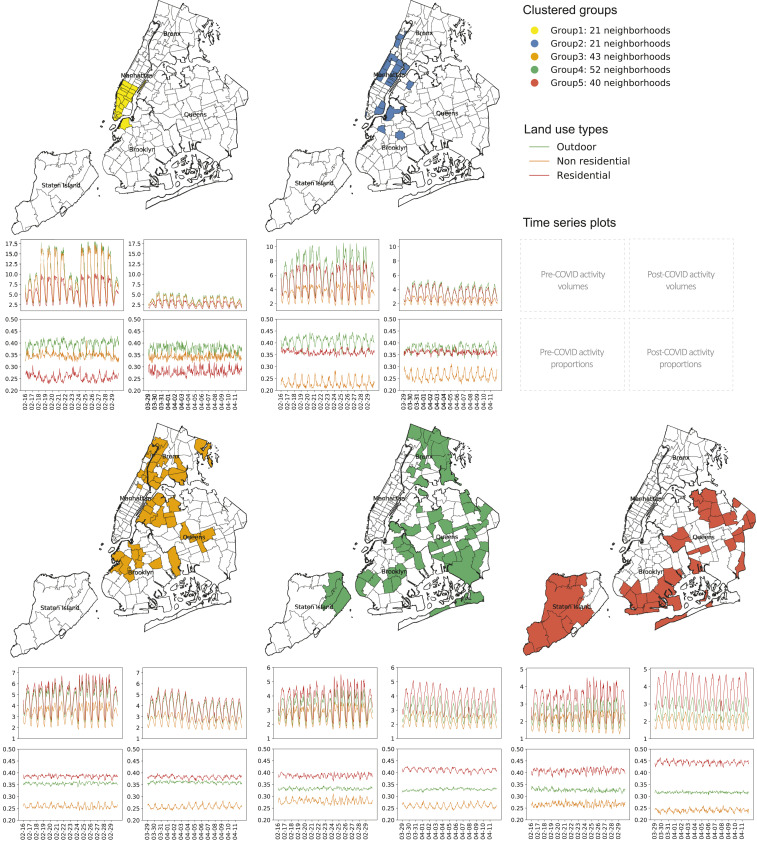
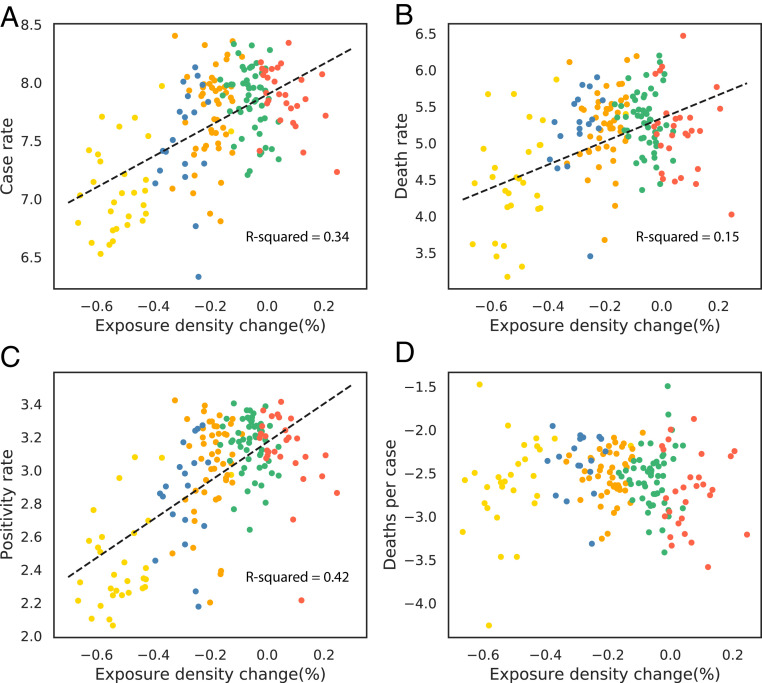
Although there is increasing awareness of disparities in COVID-19 infection risk among vulnerable communities, the effect of behavioral interventions at the scale of individual neighborhoods has not been fully studied. We develop a method to quantify neighborhood activity behaviors at high spatial and temporal resolutions and test whether, and to what extent, behavioral responses to social-distancing policies vary with socioeconomic and demographic characteristics. We define exposure density ([Formula: see text]) as a measure of both the localized volume of activity in a defined area and the proportion of activity occurring in distinct land-use types. Using detailed neighborhood data for New York City, we quantify neighborhood exposure density using anonymized smartphone geolocation data over a 3-mo period covering more than 12 million unique devices and rasterize granular land-use information to contextualize observed activity. Next, we analyze disparities in community social distancing by estimating variations in neighborhood activity by land-use type before and after a mandated stay-at-home order. Finally, we evaluate the effects of localized demographic, socioeconomic, and built-environment density characteristics on infection rates and deaths in order to identify disparities in health outcomes related to exposure risk. Our findings demonstrate distinct behavioral patterns across neighborhoods after the stay-at-home order and that these variations in exposure density had a direct and measurable impact on the risk of infection. Notably, we find that an additional 10% reduction in exposure density city-wide could have saved between 1,849 and 4,068 lives during the study period, predominantly in lower-income and minority communities.
Keywords: COVID-19; computational modeling; geolocation data; mobility behavior; neighborhood disparities.
Copyright © 2021 the Author(s). Published by PNAS.
Conflict of interest statement
The authors declare no competing interest.
Figures
References
-
- World Health Organization , WHO coronavirus disease (COVID-19) dashboard (2020). https://covid19.who.int/. Accessed 17 December 2020.
-
- World Health Organization , “Coronavirus disease 2019 (COVID-19): Situation report” (Situation Report 72, World Health Organization, Geneva, Switzerland, 2020).
-
- Courtemanche C., Garuccio J., Le A., Pinkston J., Yelowitz A., Strong social distancing measures in the United States reduced the COVID-19 growth rate: Study evaluates the impact of social distancing measures on the growth rate of confirmed COVID-19 cases across the United States. Health Aff. 39, 1237–1246 (2020). - PubMed
MeSH terms
LinkOut - more resources
Full Text Sources
Other Literature Sources
Medical
