. 2021 Mar 16;12(1):1684.
doi: 10.1038/s41467-021-21931-9.

Xbp1s-FoxO1 axis governs lipid accumulation and contractile performance in heart failure with preserved ejection fraction

Affiliations

Xbp1s-FoxO1 axis governs lipid accumulation and contractile performance in heart failure with preserved ejection fraction

Gabriele G Schiattarella et al. Nat Commun. .

Abstract

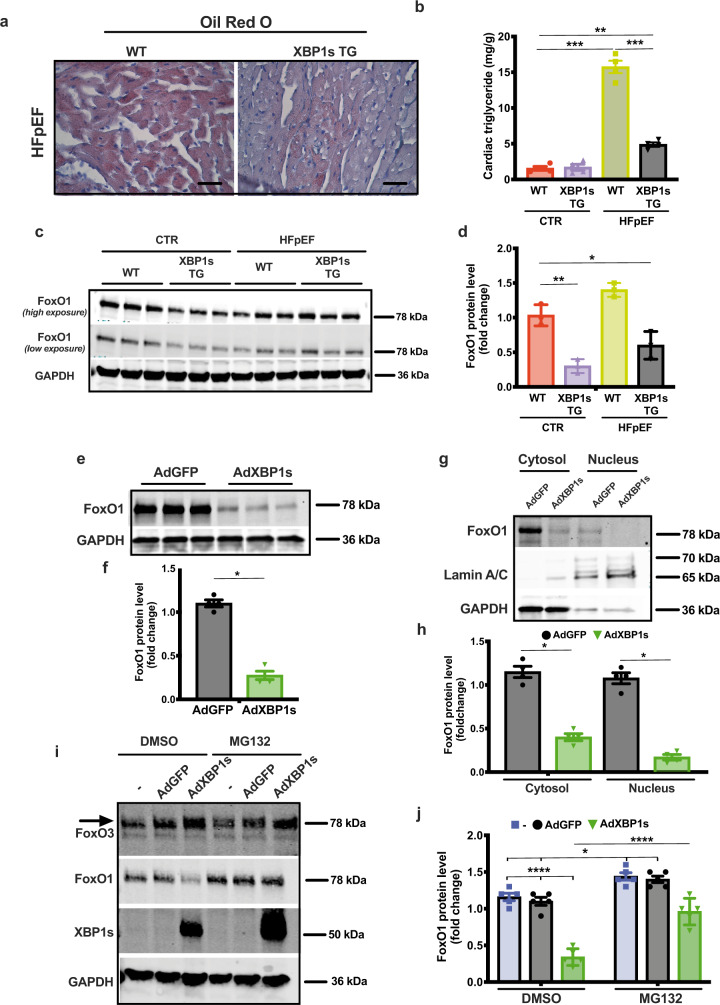
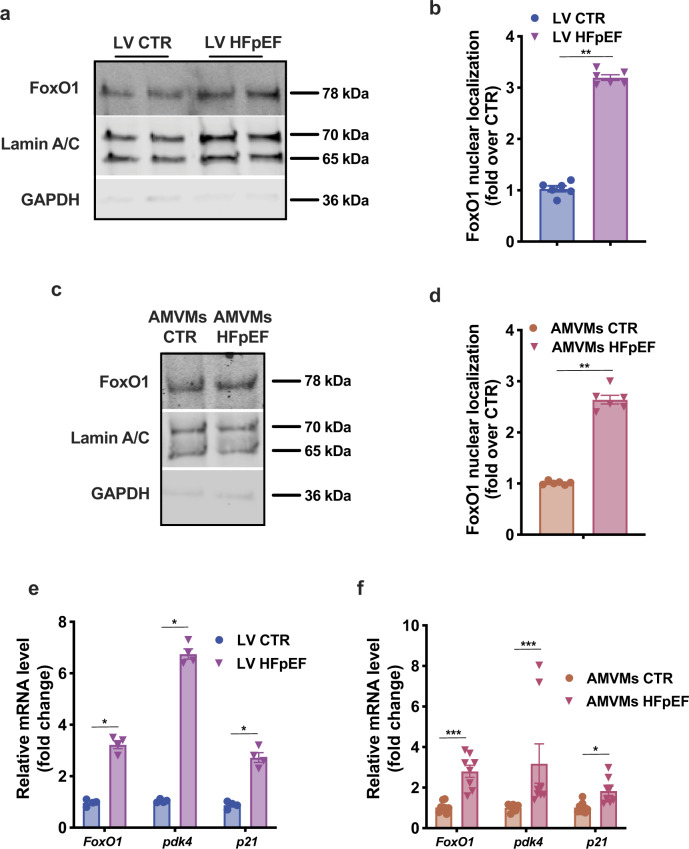
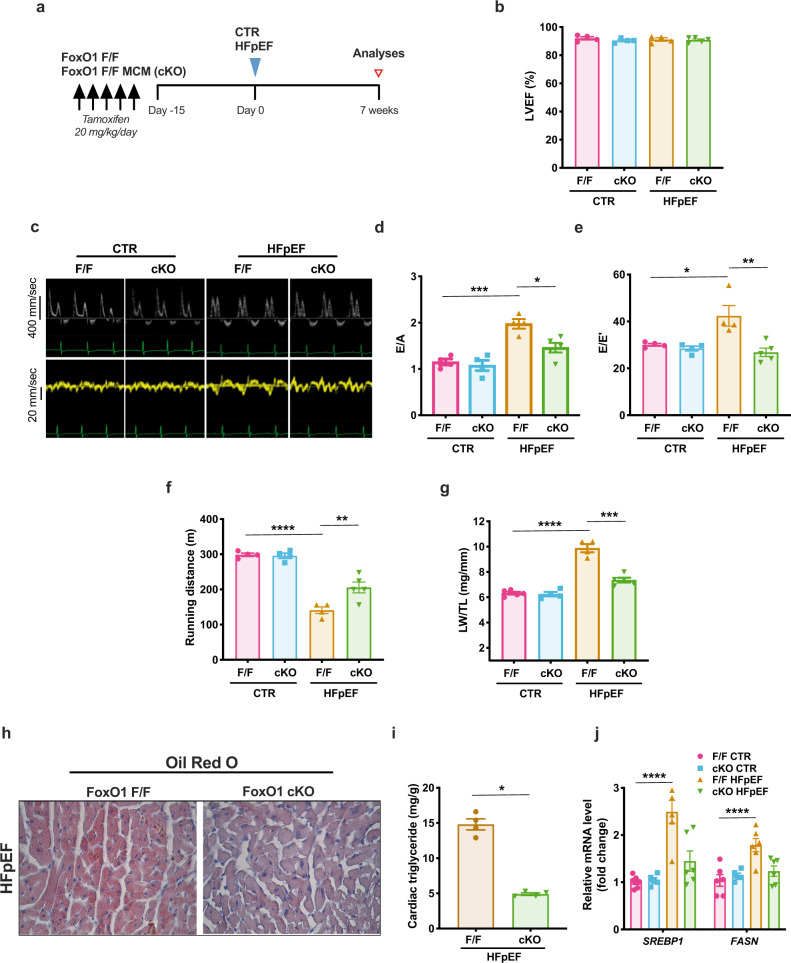
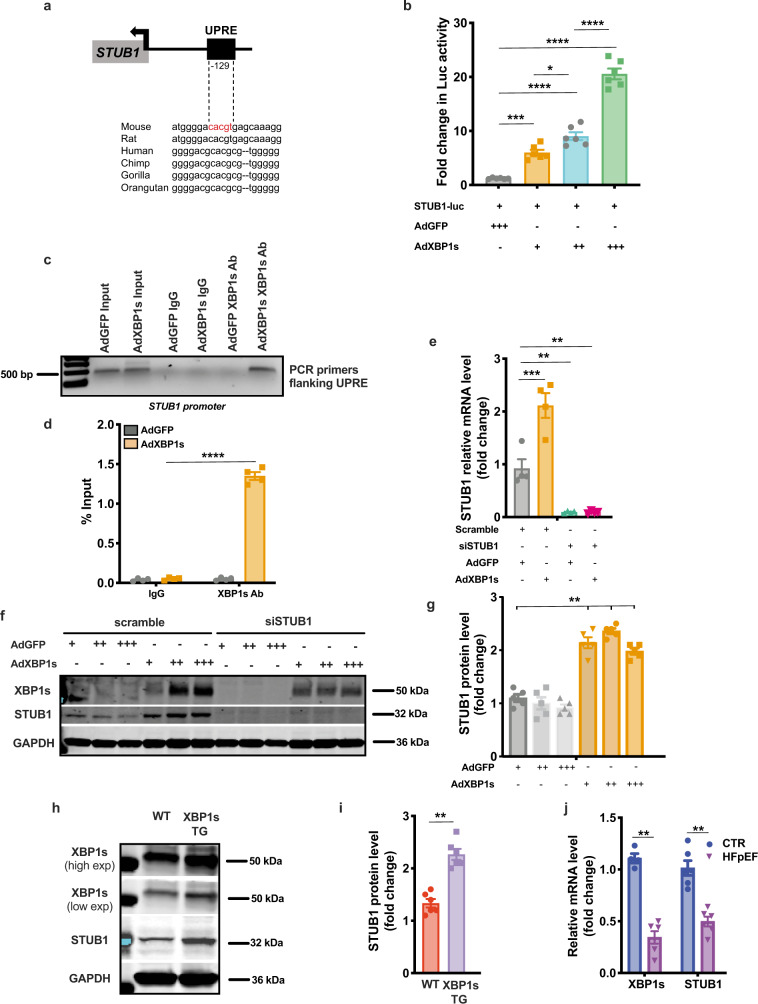
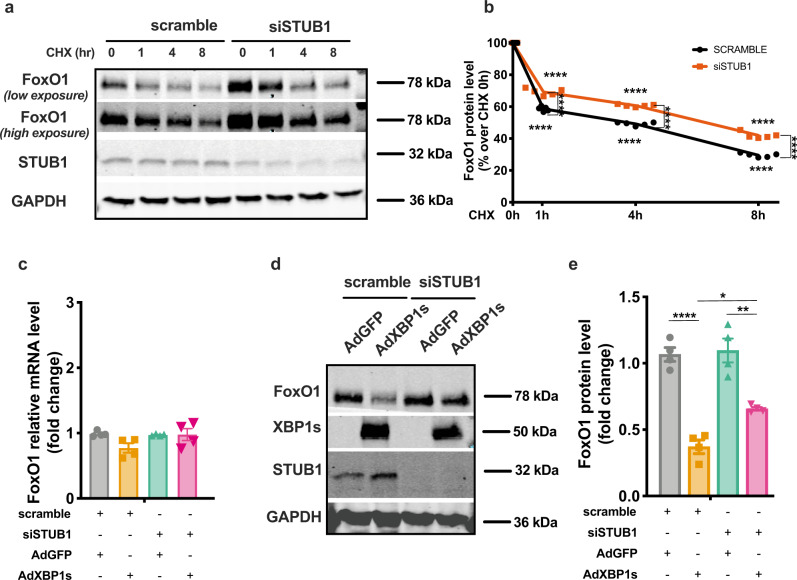
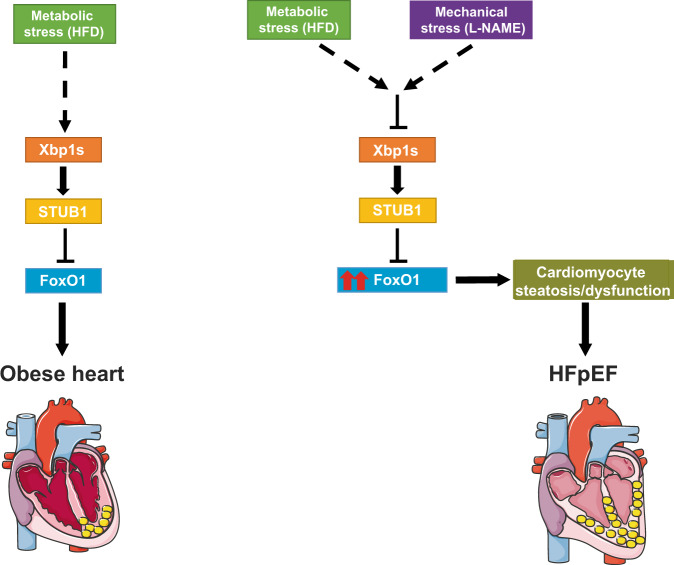
Heart failure with preserved ejection fraction (HFpEF) is now the dominant form of heart failure and one for which no efficacious therapies exist. Obesity and lipid mishandling greatly contribute to HFpEF. However, molecular mechanism(s) governing metabolic alterations and perturbations in lipid homeostasis in HFpEF are largely unknown. Here, we report that cardiomyocyte steatosis in HFpEF is coupled with increases in the activity of the transcription factor FoxO1 (Forkhead box protein O1). FoxO1 depletion, as well as over-expression of the Xbp1s (spliced form of the X-box-binding protein 1) arm of the UPR (unfolded protein response) in cardiomyocytes each ameliorates the HFpEF phenotype in mice and reduces myocardial lipid accumulation. Mechanistically, forced expression of Xbp1s in cardiomyocytes triggers ubiquitination and proteasomal degradation of FoxO1 which occurs, in large part, through activation of the E3 ubiquitin ligase STUB1 (STIP1 homology and U-box-containing protein 1) a novel and direct transcriptional target of Xbp1s. Our findings uncover the Xbp1s-FoxO1 axis as a pivotal mechanism in the pathogenesis of cardiometabolic HFpEF and unveil previously unrecognized mechanisms whereby the UPR governs metabolic alterations in cardiomyocytes.


Conflict of interest statement

G.G.S., T.G.G., and J.A.H. are co-inventors on a patent application (PCT/US/2017/037019) that was filed in June 2017 (provisional application filed in June 2016). The patent relates to the diet used for modeling HFpEF. The remaining authors declare no competing interests.

Figures

Fig. 1
Fig. 1. Cardiomyocyte-specific overexpression of Xbp1s mitigates cardiac steatosis and induces FoxO1 protein degradation in HFpEF.
a Representative images of Oil Red O staining of left ventricular (LV) sections from wild-type (WT) and cardiomyocyte-restricted Xbp1s overexpressing (Xbp1s TG) HFpEF mice. Scale bars = 50 μm. Images are representative of four hearts/group. b Cardiac triglyceride content in myocardial tissue from WT and Xbp1s TG control (CTR) and HFpEF hearts (n = 4/group). c Representative immunoblot images of FoxO1 and GAPDH proteins from LV of WT and Xbp1s TG mice under CTR and HFpEF conditions. Images are representative of three hearts/group. d Densitometric analysis of FoxO1 protein band. (n = 3/group). e Representative immunoblot images of FoxO1 and GAPDH proteins from neonatal rat ventricular myocytes (NRVMs) transduced with adenovirus expressing green fluorescent protein (GFP; AdGFP) or Xbp1s (AdXbp1s). Images are representative of four independent experiments. f Densitometric analysis of FoxO1 protein band in the different experimental groups. (n = 4 biologically independent experiments). g Representative immunoblot images of FoxO1, Lamin A/C, and GAPDH proteins in cytosolic and nuclear extracts from NRVMs transduced with AdGFP or AdXbp1s. Images are representative of four independent experiments. h Densitometric analysis of cytosolic and nuclear FoxO1 protein band in the different experimental groups (n = 4 biologically independent experiments). i Representative immunoblot images of FoxO3, FoxO1, Xbp1s, and GAPDH proteins from NRVMs transduced with AdGFP, AdXbp1s, or not transduced (−) in presence or absence of MG132. Arrow indicates FoxO3-specific band. Images are representative of five independent experiments. j Densitometric analysis of FoxO1 protein band in the different experimental groups (n = 5 biologically independent experiments). Results are presented as mean ± S.E.M. In b, d, and j, *p < 0.05, **p < 0.005, ***p < 0.0005, ****p < 0.0001, two-way ANOVA plus Sidak’s multiple comparisons test. In f and h, *p < 0.05, unpaired, two-tailed Kolmogorov–Smirnov test.
Fig. 2
Fig. 2. FoxO1 activation in hearts and cardiomyocytes from HFpEF mice.
a Representative immunoblot images of FoxO1, Lamin A/C, and GAPDH proteins in nuclear extracts from LV of CTR and HFpEF mice. Images are representative of six hearts/group. b Bar graphs depicting intensities of the nuclear FoxO1 protein band (n = 6/group). c Representative immunoblot images of FoxO1, Lamin A/C, and GAPDH proteins in nuclear extracts from adult mouse ventricular myocytes (AMVMs) of CTR and HFpEF mice. Images are representative of six hearts/group. d Bar graphs depicting the nuclear FoxO1 protein band intensities (n = 6/group). e mRNA levels of FoxO1, pdk4, and p21 in LV of CTR and HFpEF mice (n = 4/group). f mRNA levels of FoxO1, pdk4, and p21 in AMVMs of CTR and HFpEF mice (n = 8/group). Results are presented as mean ± S.E.M. In b, d, e, and f *p < 0.05, **p < 0.005, ***p < 0.0005, unpaired, two-tailed Kolmogorov–Smirnov test.
Fig. 3
Fig. 3. Cardiomyocyte-restricted deletion of FoxO1 improves HFpEF phenotype in mice and reduces cardiac lipid accumulation.
a Experimental design. FoxO1 flox/flox (FoxO1 F/F) and FoxO1 flox/flox/α-MHC-MerCreMer mice (FoxO1 F/F MCM; cKO) were injected once a day for 5 consecutive days. After 15 days, FoxO1 F/F and FoxO1-cKO were exposed to CTR or HFpEF combination diet (blue triangle). After 7 weeks, mice were subjected to functional analysis and tissue harvesting (red empty triangle). b Left ventricular ejection fraction % (LVEF%) of different experimental groups (n = 4 for F/F CTR, F/F cKO, and F/F HFpEF groups; n = 5 for cKO HFpEF group). c Representative pulse wave Doppler (top) and tissue Doppler (bottom) tracings from different experimental groups. Images are representative of four hearts/group. d E/A ratio of different experimental cohorts (n = 4 for F/F CTR, F/F cKO, and F/F HFpEF groups; n = 5 for cKO HFpEF group). e E/E’ ratio of different experimental cohorts (n = 4 for F/F CTR, F/F cKO and F/F HFpEF groups; n = 5 for cKO HFpEF group). f Running distance during exercise exhaustion test (n = 4 for F/F CTR, F/F cKO, and F/F HFpEF groups; n = 5 for cKO HFpEF group). g Ratio between lung weight (LW) immediately after mouse euthanasia (wet) and tibia length (LW/TL) (n = 4 for F/F cKO and F/F HFpEF groups; n = 5 for F/F CTR and cKO HFpEF groups). h Representative images of Oil Red O staining of LV sections from FoxO1 F/F and FoxO1-cKO HFpEF hearts. Scale bars = 50 μm. Images are representative of four hearts/group. i Cardiac triglyceride content in myocardial tissue from FoxO1 F/F and FoxO1-cKO HFpEF hearts (n = 4/group). j mRNA levels of SREBP1 and FASN in LV of FoxO1 F/F and FoxO1-cKO CTR and HFpEF hearts (n = 6 for F/F CTR, F/F HFpEF, and cKO HFpEF groups; n = 5 for cKO CTR group). Results are presented as mean ± S.E.M. In b, dg, j *p < 0.05, **p < 0.005, ***p < 0.0005, ****p < 0.0001, two-way ANOVA plus Sidak’s multiple comparisons test. i ****p < 0.0001, unpaired, two-tailed Kolmogorov–Smirnov test.
Fig. 4
Fig. 4. STUB1 is a direct transcriptional target of Xbp1s.
a Conserved consensus sequence of Xbp1s-binding site (unfolded protein response element—UPRE) in the promoter region of STUB1. 129 bp from the transcriptional start site (arrow). b Luciferase (Luc) activity in human embryonic kidney 293 cells (HEK293) transfected with STUB1-luciferase reporter construct (STUB1-Luc) and transduced with the increasing multiplicity of infection of AdGFP or AdXbp1s (n = 6 biologically independent experiments). c Electrophoretic analysis of chromatin immunoprecipitation (ChIP) assay of STUB1 promoter in NRVMs transduced with AdGFP or AdXbp1s. ChIP was performed with either control mouse immunoglobulin G (IgG) or anti-Xbp1s antibody. PCR was conducted with primers spanning the UPRE site. Images are representative of 4 independent experiments. d Densitometric analysis of STUB1 ChIP band intensities in the different experimental groups (n = 4 biologically independent experiments). e mRNA level of STUB1 in NRVMs transfected with STUB1-specific small interfering RNA (siSTUB1) or scrambled siRNA control and transduced with AdGFP or AdXbp1s (n = 4 biologically independent experiments). f Representative immunoblot images of Xbp1s, STUB1 and GAPDH proteins from NRVMs transfected with siSTUB1 or scrambled siRNA control and transduced with increasing multiplicity of infection of AdGFP or AdXbp1s. Images are representative of five independent experiments. g Densitometric analysis of STUB1 protein band in the different experimental groups (n = 5 biologically independent experiments). h Representative immunoblot images of Xbp1s, STUB1, and GAPDH proteins from LV of WT and Xbp1s TG mice. High and low exposure (high/low exp). Images are representative of six hearts/group. i Bar graphs depicting STUB1 protein band intensities in WT and Xbp1s TG LV samples (n = 6/group). j mRNA level of XBP1s and STUB1 in LV of CTR and HFpEF hearts (n = 4 for Xbp1s CTR group; n = 6 for the remaining groups). Results are presented as mean ± S.E.M. In b and e, *p < 0.05, **p < 0.005, ***p < 0.0005, ****p < 0.0001, one-way ANOVA plus Sidak’s multiple comparisons test. In d, g, i, j **p < 0.005, ****p < 0.0001, unpaired, two-tailed Kolmogorov–Smirnov test.
Fig. 5
Fig. 5. STUB1 mediates Xbp1s-dependent FoxO1 protein degradation.
a Representative immunoblot images of FoxO1, STUB1, and GAPDH proteins from NRVMs transfected with siSTUB1 or scrambled siRNA control and treated with cycloheximide (CHX) for different durations (0, 1, 4, and 8 h). Images are representative of five independent experiments. b Densitometric analysis of FoxO1 protein band in the different experimental groups. (n = 5 biologically independent experiments). c mRNA level of FoxO1 in NRVMs transfected with siSTUB1 or scrambled siRNA control and transduced with AdGFP or AdXbp1s (n = 4 biologically independent experiments). d Representative immunoblot images of FoxO1, Xbp1s, STUB1, and GAPDH proteins from NRVMs transfected with siSTUB1 or scrambled siRNA control and transduced with AdGFP, AdXbp1s. Images are representative of four independent experiments. e Densitometric analysis of FoxO1 protein band in the different experimental groups. (n = 4 biologically independent experiments). Results are presented as mean ± S.E.M. In b, c, and e *p < 0.05, **p < 0.005, ****p < 0.0001, two-way ANOVA plus Sidak’s multiple comparisons test.
Fig. 6
Fig. 6. Proposed model.
Schematic depicting a mechanistic model of Xbp1s-STUB1-FoxO1 axis in HFpEF.

References

    1. Pfeffer MA, Shah AM, Borlaug BA. Heart failure with preserved ejection fraction in perspective. Circ. Res. 2019;124:1598–1617. doi: 10.1161/CIRCRESAHA.119.313572. - DOI - PMC - PubMed
    1. Shah AM, et al. Heart failure stages among older adults in the community: the Atherosclerosis Risk in Communities Study. Circulation. 2017;135:224–240. doi: 10.1161/CIRCULATIONAHA.116.023361. - DOI - PMC - PubMed
    1. Dunlay SM, Roger VL, Redfield MM. Epidemiology of heart failure with preserved ejection fraction. Nat. Rev. Cardiol. 2017;14:591–602. doi: 10.1038/nrcardio.2017.65. - DOI - PubMed
    1. Borlaug, B. A. Evaluation and management of heart failure with preserved ejection fraction. Nat. Rev. Cardiol. 17, 559–573 (2020). - PubMed
    1. Shah SJ, et al. Phenotype-specific treatment of heart failure with preserved ejection fraction: a multiorgan roadmap. Circulation. 2016;134:73–90. doi: 10.1161/CIRCULATIONAHA.116.021884. - DOI - PMC - PubMed

Publication types

MeSH terms