. 2021 Mar 16;12(1):1698.
doi: 10.1038/s41467-021-21868-z.

Prospective contributions of biomass pyrolysis to China's 2050 carbon reduction and renewable energy goals

Affiliations

Prospective contributions of biomass pyrolysis to China's 2050 carbon reduction and renewable energy goals

Qing Yang et al. Nat Commun. .

Abstract

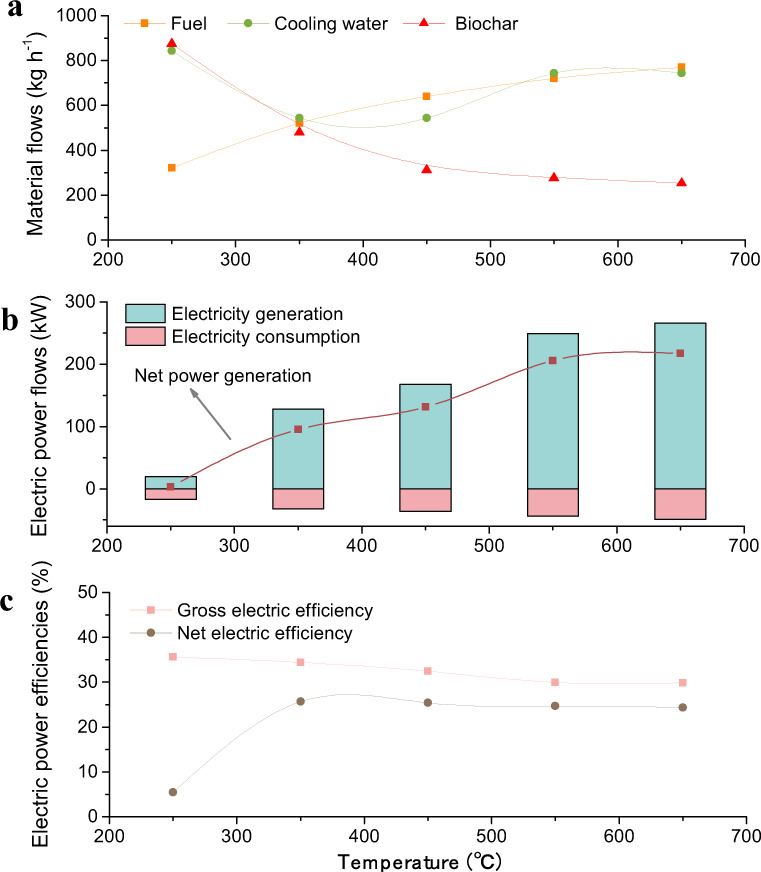
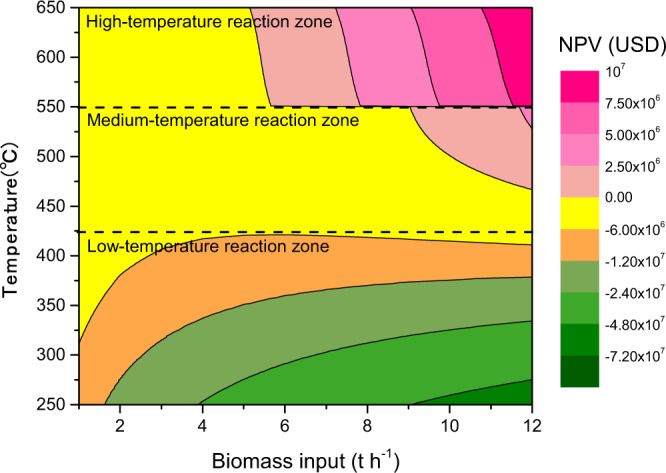
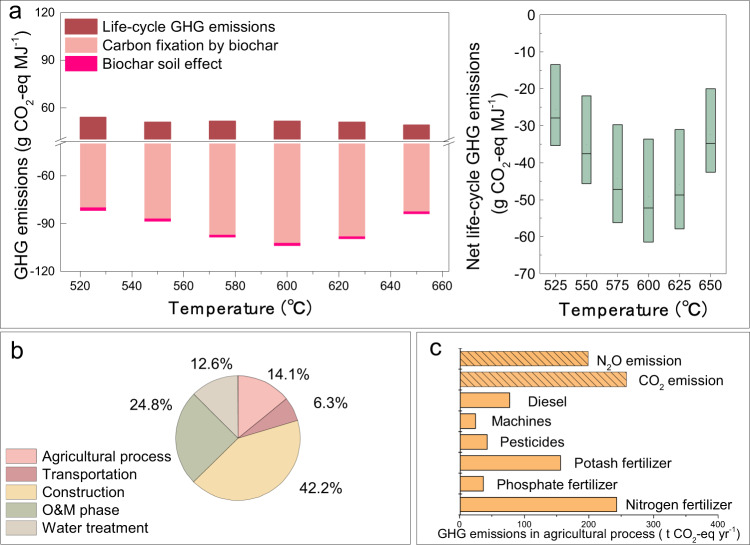
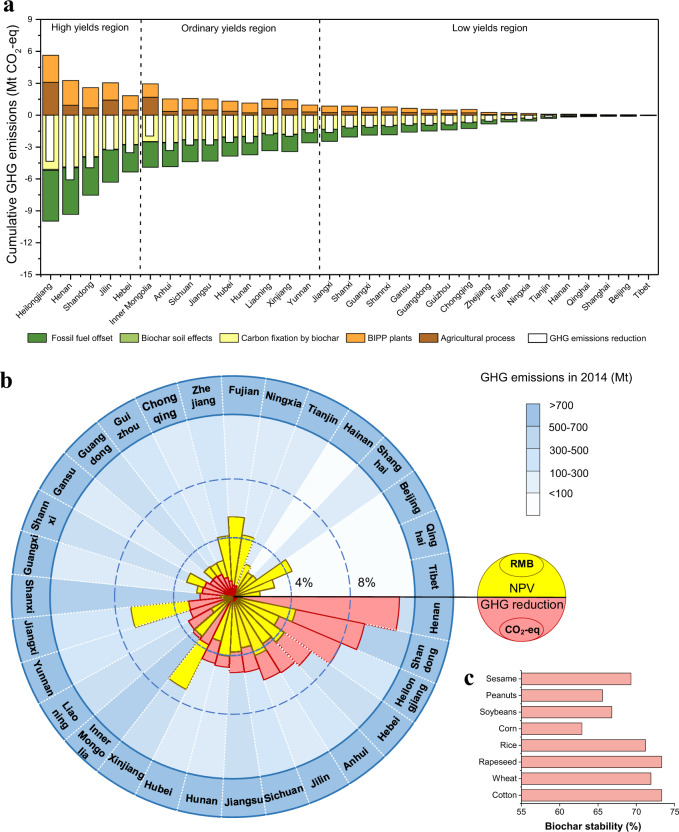
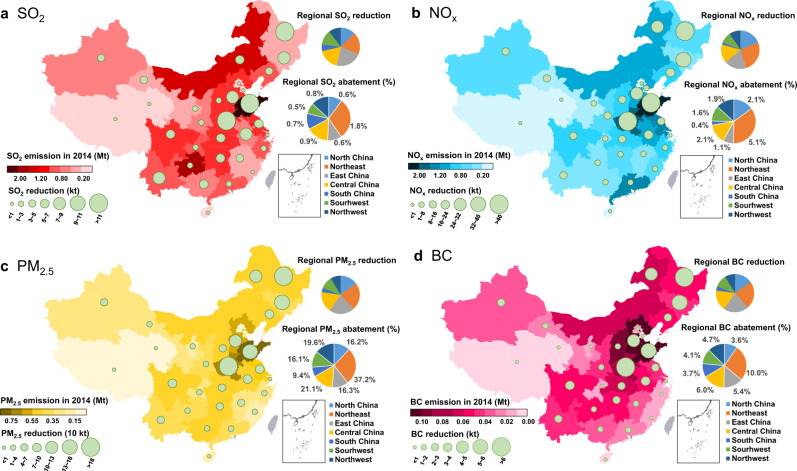
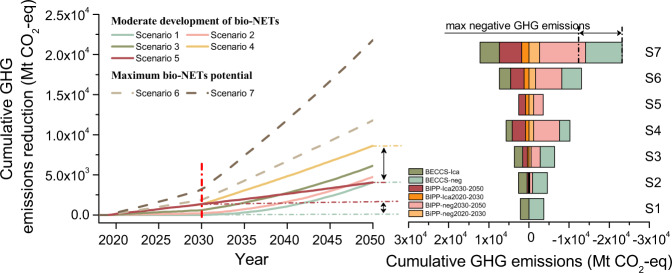
Recognizing that bioenergy with carbon capture and storage (BECCS) may still take years to mature, this study focuses on another photosynthesis-based, negative-carbon technology that is readier to implement in China: biomass intermediate pyrolysis poly-generation (BIPP). Here we find that a BIPP system can be profitable without subsidies, while its national deployment could contribute to a 61% reduction of carbon emissions per unit of gross domestic product in 2030 compared to 2005 and result additionally in a reduction in air pollutant emissions. With 73% of national crop residues used between 2020 and 2030, the cumulative greenhouse gas (GHG) reduction could reach up to 8620 Mt CO2-eq by 2050, contributing 13-31% of the global GHG emission reduction goal for BECCS, and nearly 4555 Mt more than that projected for BECCS alone in China. Thus, China's BIPP deployment could have an important influence on achieving both national and global GHG emissions reduction targets.


Conflict of interest statement

The authors declare no competing interests.

Figures

Fig. 1
Fig. 1. Performance of a BIPP system with temperature varying from 250 to 650 °C for 1 t biomass input per hour.
a Material flows: fuels input for high-temperature flue gas generation, cooling water inputs used to cool biochar, and the biochar output; b electric power flows: electricity generation by the pyrolysis gas combustion power system, electricity consumption of the whole system, and net power generation; c electric power efficiencies: gross/net efficiencies of electricity generation in the BIPP system, which are defined as the gross/net power generation divided by the energy input from pyrolysis gas.
Fig. 2
Fig. 2. The two-factor sensitivity analysis for net present value.
Note that there is a step change at 550 °C caused by the pyrolysis gas price change in different regimes of heating value (shown in Supplementary Note 7).
Fig. 3
Fig. 3. The GHG emissions for a demonstration BIPP system with biochar sequestration (excluding fossil fuel offset).
a Left figure presents life-cycle GHG emissions, carbon fixation by sequestering biochar into soil (influenced by the stability of biochar), and reduced emissions by biochar soil effect (explained in “Methods”), while the right figure represents the net life-cycle GHG emissions for the whole system; b the GHG emission shares of five subsystems at 600 °C with the lowest net life-cycle GHG emissions; c the GHG emissions for different components of agricultural production (with N2O and CO2 emissions coming from soil as explained in Supplementary Note 13).
Fig. 4
Fig. 4. Spatial distribution of GHG emissions reduction and economic feasibility of national deployment of BIPP systems.
a Comparison of GHG emissions reductions across Chinese provinces with deployment of BIPP systems (note that provinces are ordered by the amount of available crop residues); b overlapping graph of shares (%) of national GHG emissions reduction per year (red sectors) that could be achieved in Chinese provinces using BIPP systems with biochar sequestration (omitting Taiwan, Macao, and Hong Kong), and shares (%) of national NPV economic performance (yellow sectors); the blue background shades indicate total GHG emissions levels in 2014, as defined at right; c the stability of biochar produced from various crop residues of a BIPP system at 600 °C.
Fig. 5
Fig. 5. Reductions in annual air pollutant emissions (SO2, NOx, PM2.5, and BC) achieved by nationwide deployment of BIPP systems with biochar sequestration.
a The annual SO2 emissions reduction, the red color shading represents the levels of SO2 emissions in 2014; b the annual NOx emissions reduction, the blue color shading indicates the levels of NOx emissions in 2014; c the annual PM2.5 emissions reduction, the yellow color shading shows the levels of PM2.5 emissions in 2014; d the annual BC emissions reduction, the pink color shading represents the levels of BC emissions in 2014. The green round labels in ad indicate total emissions reductions by province resulting from three sources: BIPP substitution for other energy uses, avoided domestic biomass burning (DBB), and avoided open biomass burning (OBB). The regional divisions in ad are shown in Supplementary Fig. 9, and the regional pollutant emissions abatement (%) is defined as the regional emissions reduction divided by the regional emissions in 2014.
Fig. 6
Fig. 6. Cumulative GHG emissions reduction during 2020–2050 compared with BAU and cumulative GHG emissions.
The net life-cycle GHG emissions are studied taking account of carbon fixation by biochar/carbon storage by BECCS, life-cycle GHG emissions for a BIPP/BECCS system and biochar soil effect of biochar sequestration (see “Method”, Eq. (2)). The GHG emissions reduction is attributed to biochar production in the studied pyrolysis (BIPP) systems or/and BECCS (including fossil fuel offset and net life-cycle GHG emissions). Results are shown for seven scenarios, in which solid lines indicate the scenarios under “Moderate development of bio-NETs”, dashed lines under “Maximum bio-NETs potentials”.

References

    1. Victor, D. et al. Climate change 2014: mitigation of climate change. In Contribution of Working Group III to the Fifth Assessment Report of the Intergovernmental Panel on Climate Change (eds. Edenhofer, O. et al.) (Cambridge University Press, 2013).
    1. Tavoni M, et al. Post-2020 climate agreements in the major economies assessed in the light of global models. Nat. Clim. Change. 2015;5:119–126. doi: 10.1038/nclimate2475. - DOI
    1. Rogelj J, et al. Paris Agreement climate proposals need a boost to keep warming well below 2 °C. Nature. 2016;534:631–639. doi: 10.1038/nature18307. - DOI - PubMed
    1. Krey V, Luderer G, Clarke L, Kriegler E. Getting from here to there–energy technology transformation pathways in the EMF27 scenarios. Clim. Change. 2014;123:369–382. doi: 10.1007/s10584-013-0947-5. - DOI
    1. Riahi K, et al. Locked into Copenhagen pledges—implications of short-term emission targets for the cost and feasibility of long-term climate goals. Technol. Forecast. Soc. Change. 2015;90:8–23. doi: 10.1016/j.techfore.2013.09.016. - DOI

Publication types

LinkOut - more resources