

Effect of COVID-19 on Mortality of Pregnant and Postpartum Women: A Systematic Review and Meta-Analysis
- PMID: 33728066
- PMCID: PMC7938334
- DOI: 10.1155/2021/8870129
Effect of COVID-19 on Mortality of Pregnant and Postpartum Women: A Systematic Review and Meta-Analysis
Abstract
Background: Based on what is known at this time, pregnant women are at an increased risk of severe illness from COVID-19 compared to nonpregnant women. Additionally, pregnant women with COVID-19 might have an increased risk of adverse pregnancy outcomes. To investigate the effects of coronavirus disease 2019 (COVID-19) on mortality of pregnant and postpartum women, we performed a systematic review of available published literature on pregnancies affected by COVID-19.
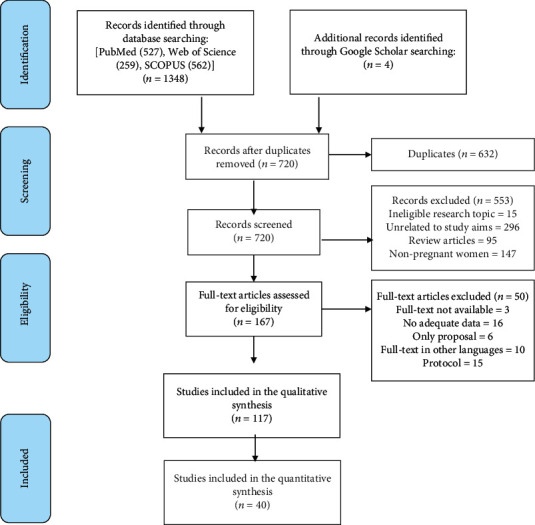
Methods: Web of Science, SCOPUS, and MEDLINE- databases were searched for original studies concerning the effect of COVID-19 on mortality of pregnant and postpartum women published by July 10, 2020. Meta-analyses of proportions were used to combine data and report pooled proportions.
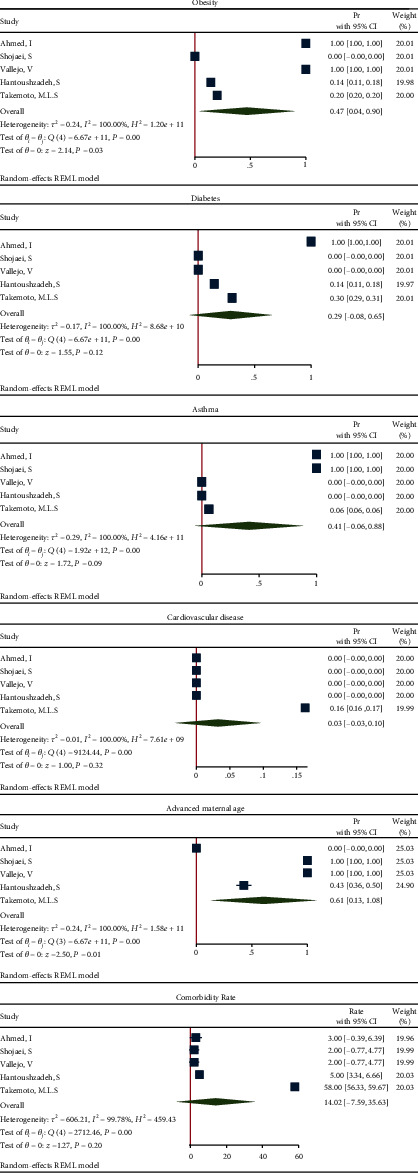
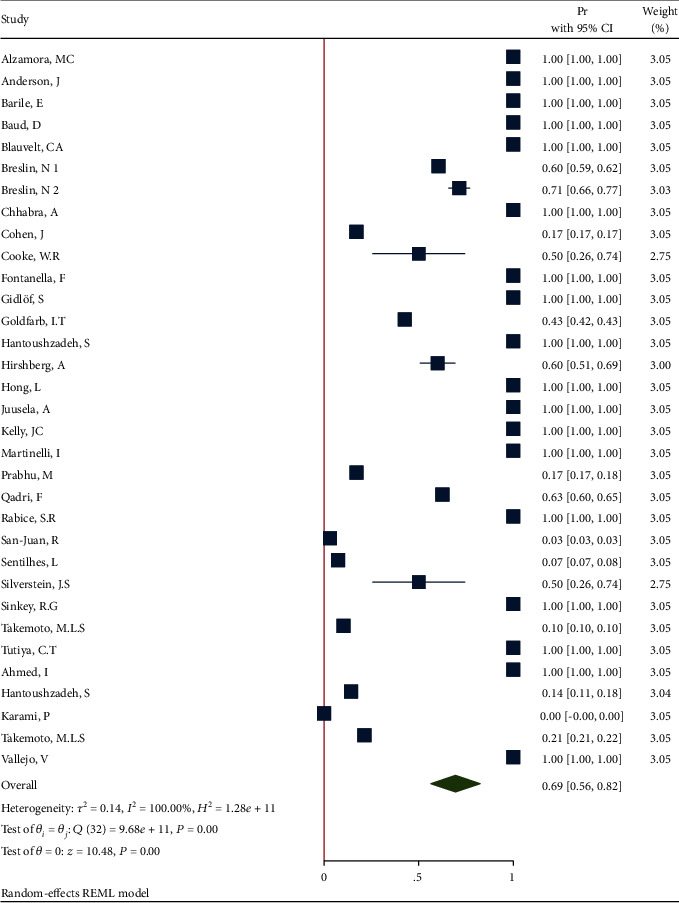
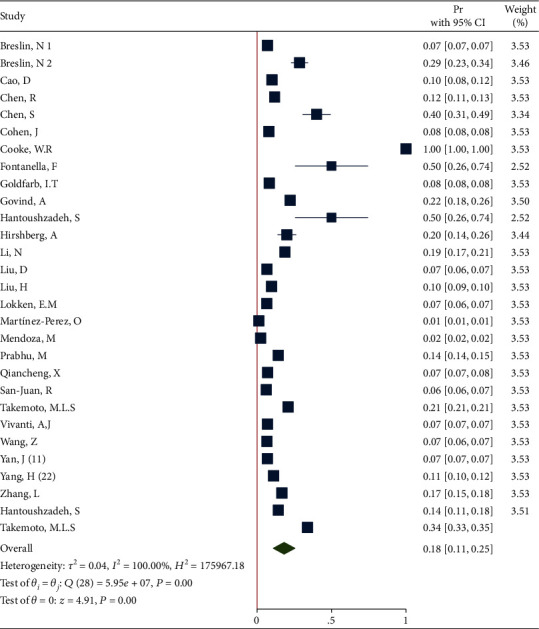
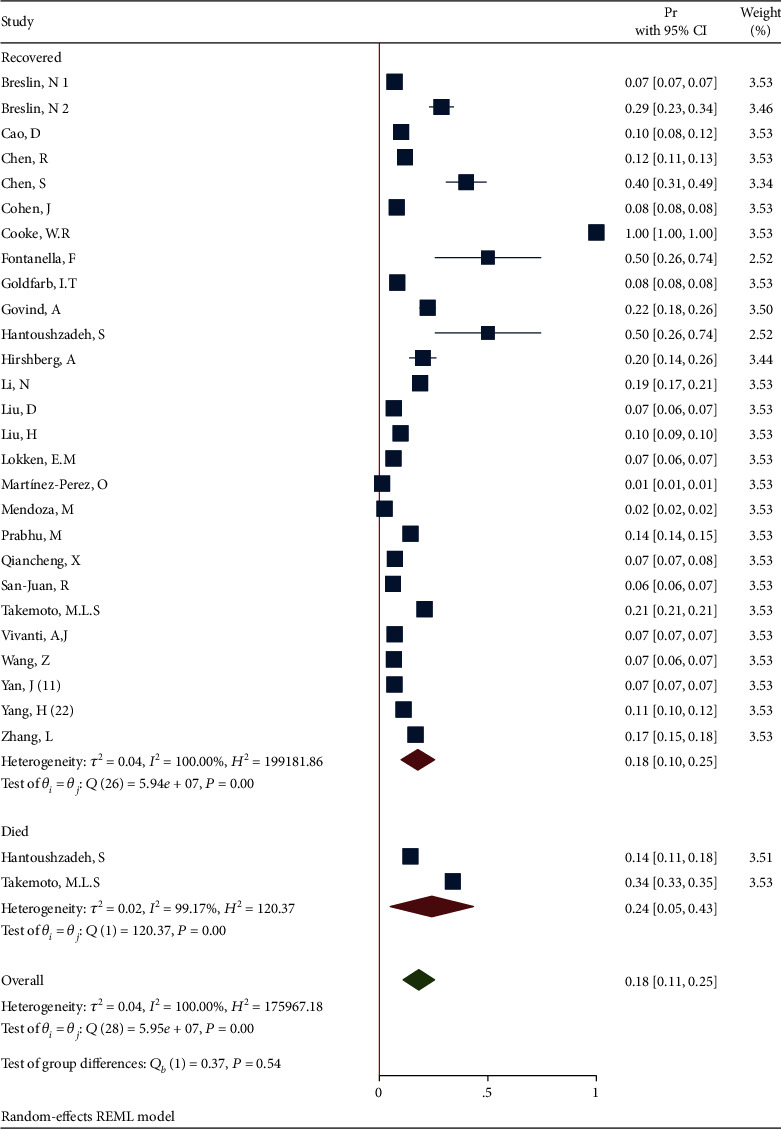
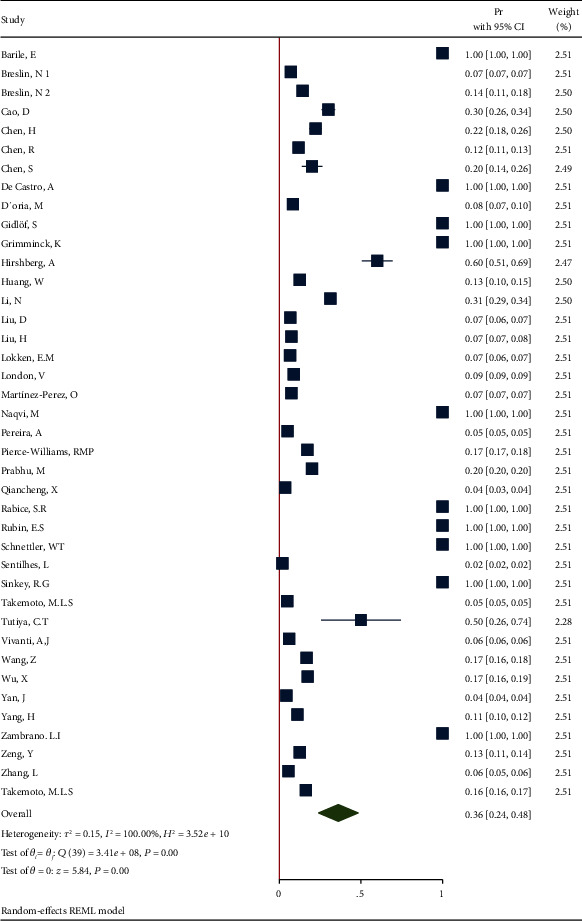
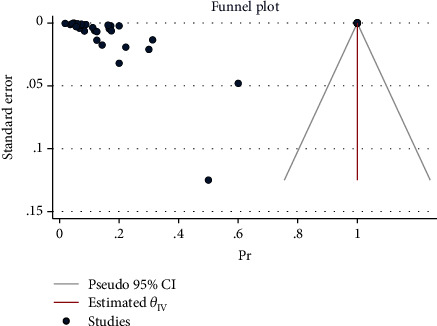
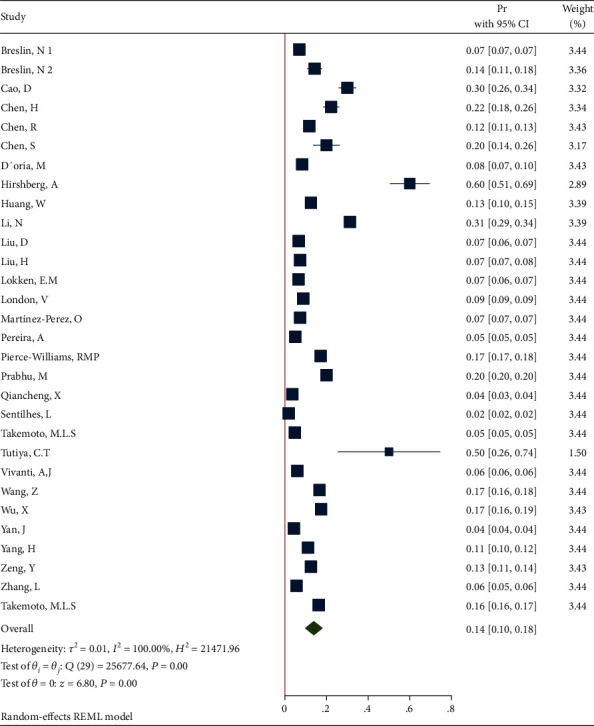
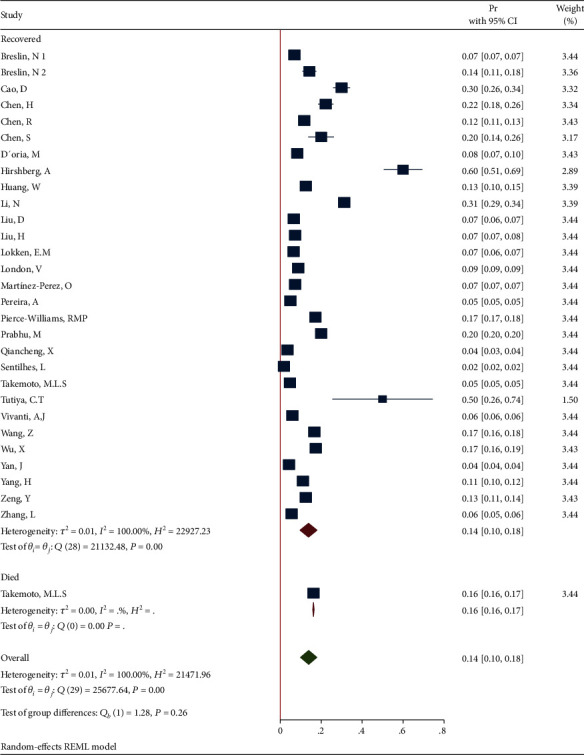
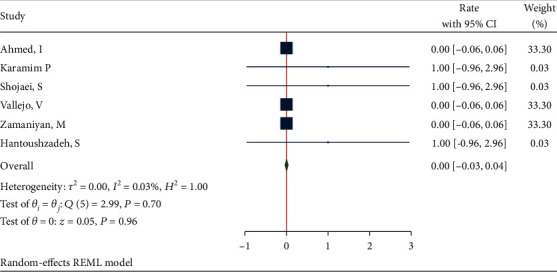
Results: 117 studies with a total of 11758 pregnant women were included. The age ranged between 15 and 48 years. Most subjects were infected with SARS-CoV-2 in the third trimester. Disease severity was not reported in 1125 subjects. Maternal mortality was 1.3%. In 100% of fatal cases with adequate data, fever alone or with cough was one of the presenting symptoms. Also, dyspnea (58.3%) and myalgia (50%) were the most common symptoms. Sore throat (8.3%) and gastrointestinal symptoms (anorexia, nausea) (8.3%) were rare. The rate of comorbidities was 20% among COVID-19 deaths. The majority of COVID-19-infected women who died had cesarean section (58.3%), 25% had a vaginal delivery, and 16.7% of patients were not full term.
Conclusion: COVID-19 infection in pregnant women was associated with higher rates (and pooled proportions) of cesarean section and mortality. Because new data are continuously being generated and published, the findings of this study can be complete and updated with new researches. The results of this study can guide and improve prenatal counseling of COVID-19-infected pregnant women.
Copyright © 2021 Leila Karimi et al.
Conflict of interest statement
The authors report no conflict of interest.
Figures
References
-
- Becker A. How does COVID-19 affect pregnancy and postpartum care? June 2020, https://www.tmc.edu/news/2020/06/how-does-covid-19-affect-pregnancy-and-...
Publication types
MeSH terms
LinkOut - more resources
Full Text Sources
Other Literature Sources
Medical
Miscellaneous
