. 2021 Mar 12;2(3):100212.
doi: 10.1016/j.patter.2021.100212. Epub 2021 Jan 28.

VERSO: A comprehensive framework for the inference of robust phylogenies and the quantification of intra-host genomic diversity of viral samples

Affiliations

VERSO: A comprehensive framework for the inference of robust phylogenies and the quantification of intra-host genomic diversity of viral samples

Daniele Ramazzotti et al. Patterns (N Y). .

Abstract

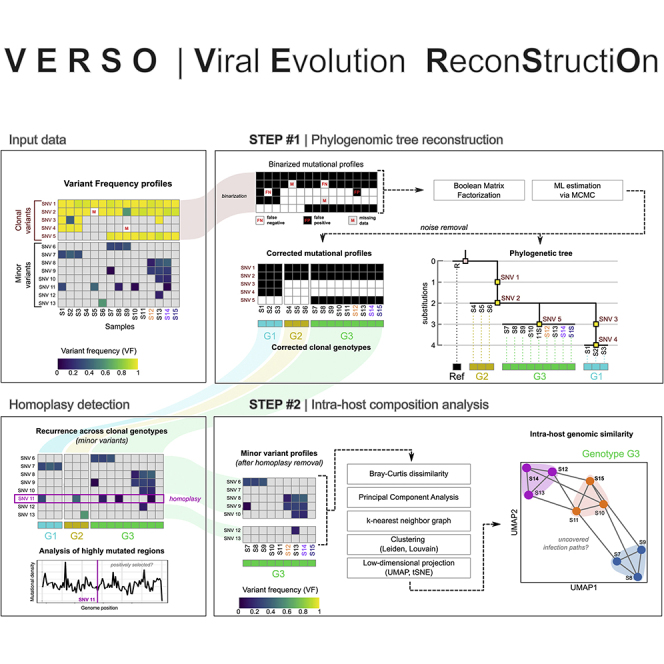
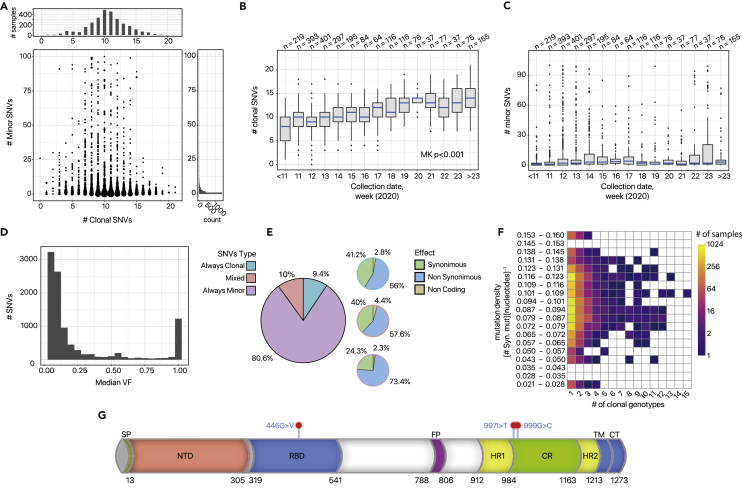
We introduce VERSO, a two-step framework for the characterization of viral evolution from sequencing data of viral genomes, which is an improvement on phylogenomic approaches for consensus sequences. VERSO exploits an efficient algorithmic strategy to return robust phylogenies from clonal variant profiles, also in conditions of sampling limitations. It then leverages variant frequency patterns to characterize the intra-host genomic diversity of samples, revealing undetected infection chains and pinpointing variants likely involved in homoplasies. On simulations, VERSO outperforms state-of-the-art tools for phylogenetic inference. Notably, the application to 6,726 amplicon and RNA sequencing samples refines the estimation of severe acute respiratory syndrome coronavirus 2 (SARS-CoV-2) evolution, while co-occurrence patterns of minor variants unveil undetected infection paths, which are validated with contact tracing data. Finally, the analysis of SARS-CoV-2 mutational landscape uncovers a temporal increase of overall genomic diversity and highlights variants transiting from minor to clonal state and homoplastic variants, some of which fall on the spike gene. Available at: https://github.com/BIMIB-DISCo/VERSO.

Keywords: COVID-19; SARS-CoV-2; genomic surveillance; intra-host genomic diversity; phylogenomics; viral evolution; viral variants.


Conflict of interest statement

The authors declare no competing interests.

Figures

None
Graphical abstract
Figure 1
Figure 1
VERSO framework for viral evolution inference and intra-host genomic diversity quantification (A) In this example, three hosts infected by the same viral lineage are sequenced. All hosts share the same clonal mutation (T>C, green), but two of them (#2 and #3) are characterized by a distinct minor mutation (A>T, red), which randomly emerged in host #2 and was transferred to host #3 during the infection. Standard sequencing experiments return an identical consensus sequence for all samples, by employing a threshold on VF and by selecting mutations characterizing the dominant lineage. (B) VERSO takes as input the VF profiles of samples, generated from raw sequencing data. In step #1, VERSO processes the binarized profiles of clonal variants and solves a Boolean matrix factorization problem by maximizing a likelihood function via MCMC, in order to correct false-positives/-negatives and missing data. As output, it returns both the corrected mutational profiles of samples and the phylogenetic tree, in which samples with identical corrected clonal genotypes are grouped in polytomies. Corrected clonal genotypes are then employed to identify homoplasies of minor variants, which are further investigated to pinpoint positively selected mutations. The VF profile of minor variants (excluding homoplasies) is processed by step #2 of VERSO, which computes a refined genomic distance among hosts (via Bray-Curtis dissimilarity, after PCA) and performs clustering and dimensionality reduction, in order to project and visualize samples on a 2D space, representing the intra-host genomic diversity and the distance among hosts. This allows one to identify undetected transmission paths among samples with identical clonal genotype.
Figure 2
Figure 2
Comparative assessment on simulated data (A–D) Synthetic datasets were generated via the widely used coalescent model simulator msprime (see the Supplementary Material and Table S1 for the parameter settings). Twenty distinct topologies with 1,000 samples were generated, including a number of distinguishable variants in the range (14, 31). For each topology, four synthetic datasets were generated, with different sample sizes (n = 1000, 500), and different combinations of false-positives and false-negatives ([α = 0.05, β = 0.05], [α = 0.10, β = 0.10]), for a total of four configurations (A, B, C, and D) and 80 independent datasets. VERSO step #1 was compared with IQ-TREE and BEAST 2, on (1) absolute error evolutionary distance, (2) branch score difference and (3) quadratic path difference with respect to the ground-truth sample phylogeny provided by msprime (see the Supplemental experimental procedures for the description of the metrics). In the upper panels, distributions are shown as violin plots, whereas lower panels include the empirical cumulative distribution functions. The percentage improvement of VERSO with respect to competing methods is shown on all metrics (computed on median values), in addition to the p value of the two-sided Mann-Whitney U test on distributions, for all settings.
Figure 3
Figure 3
Viral evolution and intra-host genomic characterization of 2906 SARS-CoV-2 samples of via VERSO (dataset #1) (A) The phylogenetic model returned by VERSO step #1 from the mutational profile of 2,906 samples selected after the quality check, on 29 clonal variants (VF > 90%) detected in at least 3% of the samples of dataset #1 (reference genome: SARS-CoV-2-ANC). Colors mark the 25 distinct clonal genotypes identified by VERSO (the mapping with the lineage nomenclature proposed in Rambaut et al. and generated via pangolin 2.0 is provided in File S3). Samples with identical corrected clonal genotypes are grouped in polytomies and the black sample represents the SARS-CoV-2-ANC genome (visualization via FigTree80). The green curves juxtaposed to certain polytomies report the number and fraction of samples in which the five homoplastic mutations are observed (only if the mutation is detected in at least 10 samples with the same corrected clonal genotype; see Data S2 for a summary on the samples exhibiting homoplastic clonal variants). The projection of the intra-host genomic diversity computed by VERSO step #2 from VF profiles is shown on the UMAP low-dimensional space for the clonal genotypes including ≥100 samples. Samples are clustered via Leiden algorithm on the kNN graph (k = 10), computed on the Bray-Curtis dissimilarity on VF profiles, after PCA. Solid lines represent the edges of the k-NNG. (B) The composition of the corrected clonal genotypes returned by VERSO step #1 is shown. Clonal SNVs are annotated with mapping on ORFs, synonymous (S), nonsynonymous (NS), and non-coding (NC) states, and related amino acid substitutions. Variants g.8782T>C (ORF1ab, synonymous) and g.28144C>T (ORF8, p.84S>L) are colored in blue, whereas variant g.23403 A>G (S, p.614 D>G) is colored in red. The prevalence variation in time of the relative haplotypes (i.e., the fraction of samples displaying such mutations) is also shown. The five homoplastic variants are colored in green. (C and D) (C) The geo-temporal localization of the clonal genotypes via Microreact and (D) the prevalence variation in time are displayed.
Figure 4
Figure 4
Infection dynamics revealed via characterization of intra-host genomic similarity (dataset #1) (A) The distribution of the pairwise intra-host genomic distance (computed via Bray-Curtis dissimilarity on the kNN graph, with k = 10, after PCA; see Experimental procedures) for the samples belonging to the same household or institution (including samples marked as near), versus the pairwise distance of all samples belonging to clonal genotypes G4, G12, and G21. The p values of the Mann-Whitney U test two-sided are also shown. (B) The proportion of samples that are disconnected in the kNN graph, with respect to the samples belonging to the same household or institution (including samples marked as near) and with respect to all samples. (C) The UMAP projection of the intra-host genomic diversity of the samples belonging to clonal genotypes G4, G12, and G21, returned by VERSO step #2.
Figure 5
Figure 5
Mutational landscape of 2906SARS-CoV-2 samples (dataset #1) (A) Scatterplot displaying, for each sample, the number of clonal (VF > 90%) and minor variants (VF ≤ 90%, node size proportional to the number of samples). (B and C) Boxplots returning the distribution of the number of clonal (B) and minor variants (C), obtained by grouping samples according to collection date (weeks, 2020). The p value of the Mann-Kendall (MK) trend test on clonal variants is highly significant. (D) Distribution of the median VF for all SNVs detected in the viral populations. (E) Pie charts returning (left) the proportion of SNVs detected as always clonal, always minor, or mixed; (right) for each category, the proportion of synonymous, nonsynonymous, and non-coding variants (check the pie-chart border color for a visual clue). (F) Heatmap returning the distribution of always minor SNVs with respect to (x axis) the number of clonal genotype of the phylogenomic model in Figure 3 in which each variant is observed, (y axis) the mutational density of the genome region in which it is located (see the Supplemental experimental procedures). (G) Mapping of the candidate homoplastic minor variants located on the spike gene of the SARS-CoV-2 virus.

Similar articles

Cited by

References

    1. Zhou P., Yang X.L., Wang X.G., Hu B., Zhang L., Zhang W., Si H.R., Zhu Y., Li B., Huang C.L. A pneumonia outbreak associated with a new coronavirus of probable bat origin. Nature. 2020;579:270–273. doi: 10.1038/s41586-020-2012-7. - DOI - PMC - PubMed
    1. Wu F., Zhao S., Yu B., Chen Y.M., Wang W., Song Z.G., Hu Y., Tao Z.W., Tian J.H., Pei Y.Y. A new coronavirus associated with human respiratory disease in China. Nature. 2020;579:265–269. doi: 10.1038/s41586-020-2008-3. - DOI - PMC - PubMed
    1. Andersen K.G., Rambaut A., Lipkin W.I., Holmes E.C., Garry R.F. The proximal origin of SARS-CoV-2. Nat. Med. 2020;26:450–452. doi: 10.1038/s41591-020-0820-9. - DOI - PMC - PubMed
    1. Xiao K., Zhai J., Feng Y., Zhou N., Zhang X., Zou J.J., Li N., Guo Y., Li X., Shen X. Isolation of SARS-CoV-2-related coronavirus from Malayan pangolins. Nature. 2020;583:286–289. doi: 10.1038/s41586-020-2313-x. - DOI - PubMed
    1. Deng X., Gu W., Federman S., du Plessis L., Pybus O.G., Faria N.R., Wang C., Yu G., Bushnell B., Pan C.Y. Genomic surveillance reveals multiple introductions of SARS-CoV-2 into Northern California. Science. 2020;369:582–587. doi: 10.1126/science.abb9263. - DOI - PMC - PubMed

LinkOut - more resources