. 2021 Jun 14;17(3):413-425.
doi: 10.1039/d0mo00188k.

Data-independent acquisition-based proteome and phosphoproteome profiling across six melanoma cell lines reveals determinants of proteotypes

Affiliations

Data-independent acquisition-based proteome and phosphoproteome profiling across six melanoma cell lines reveals determinants of proteotypes

Erli Gao et al. Mol Omics. .

Abstract

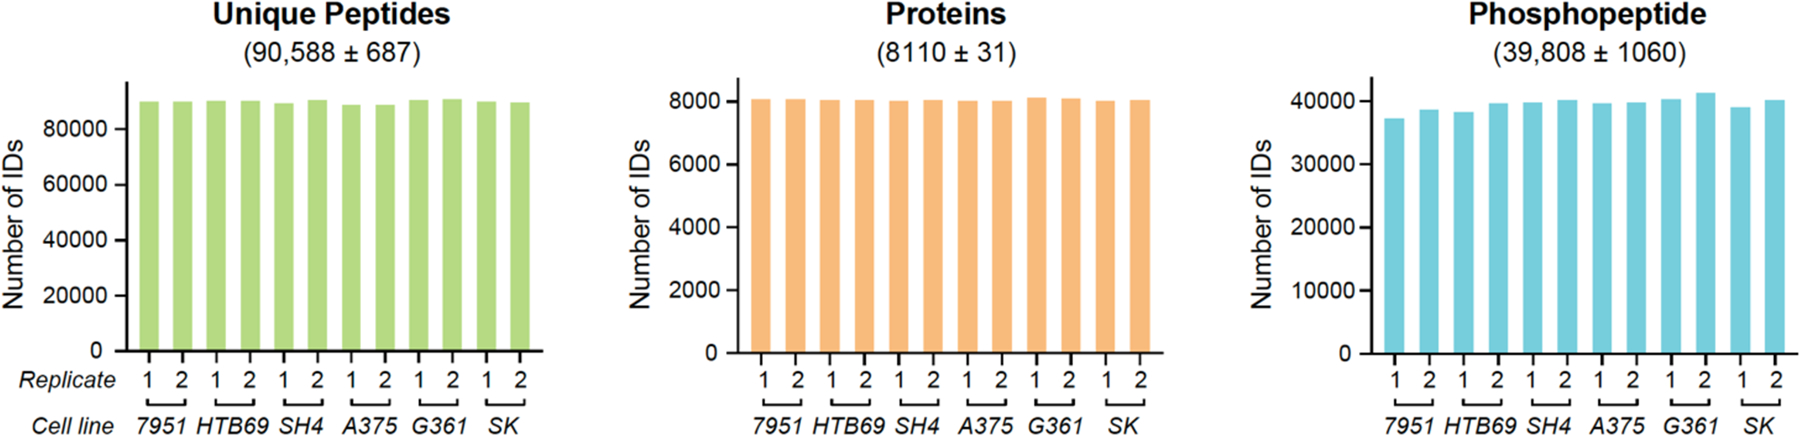
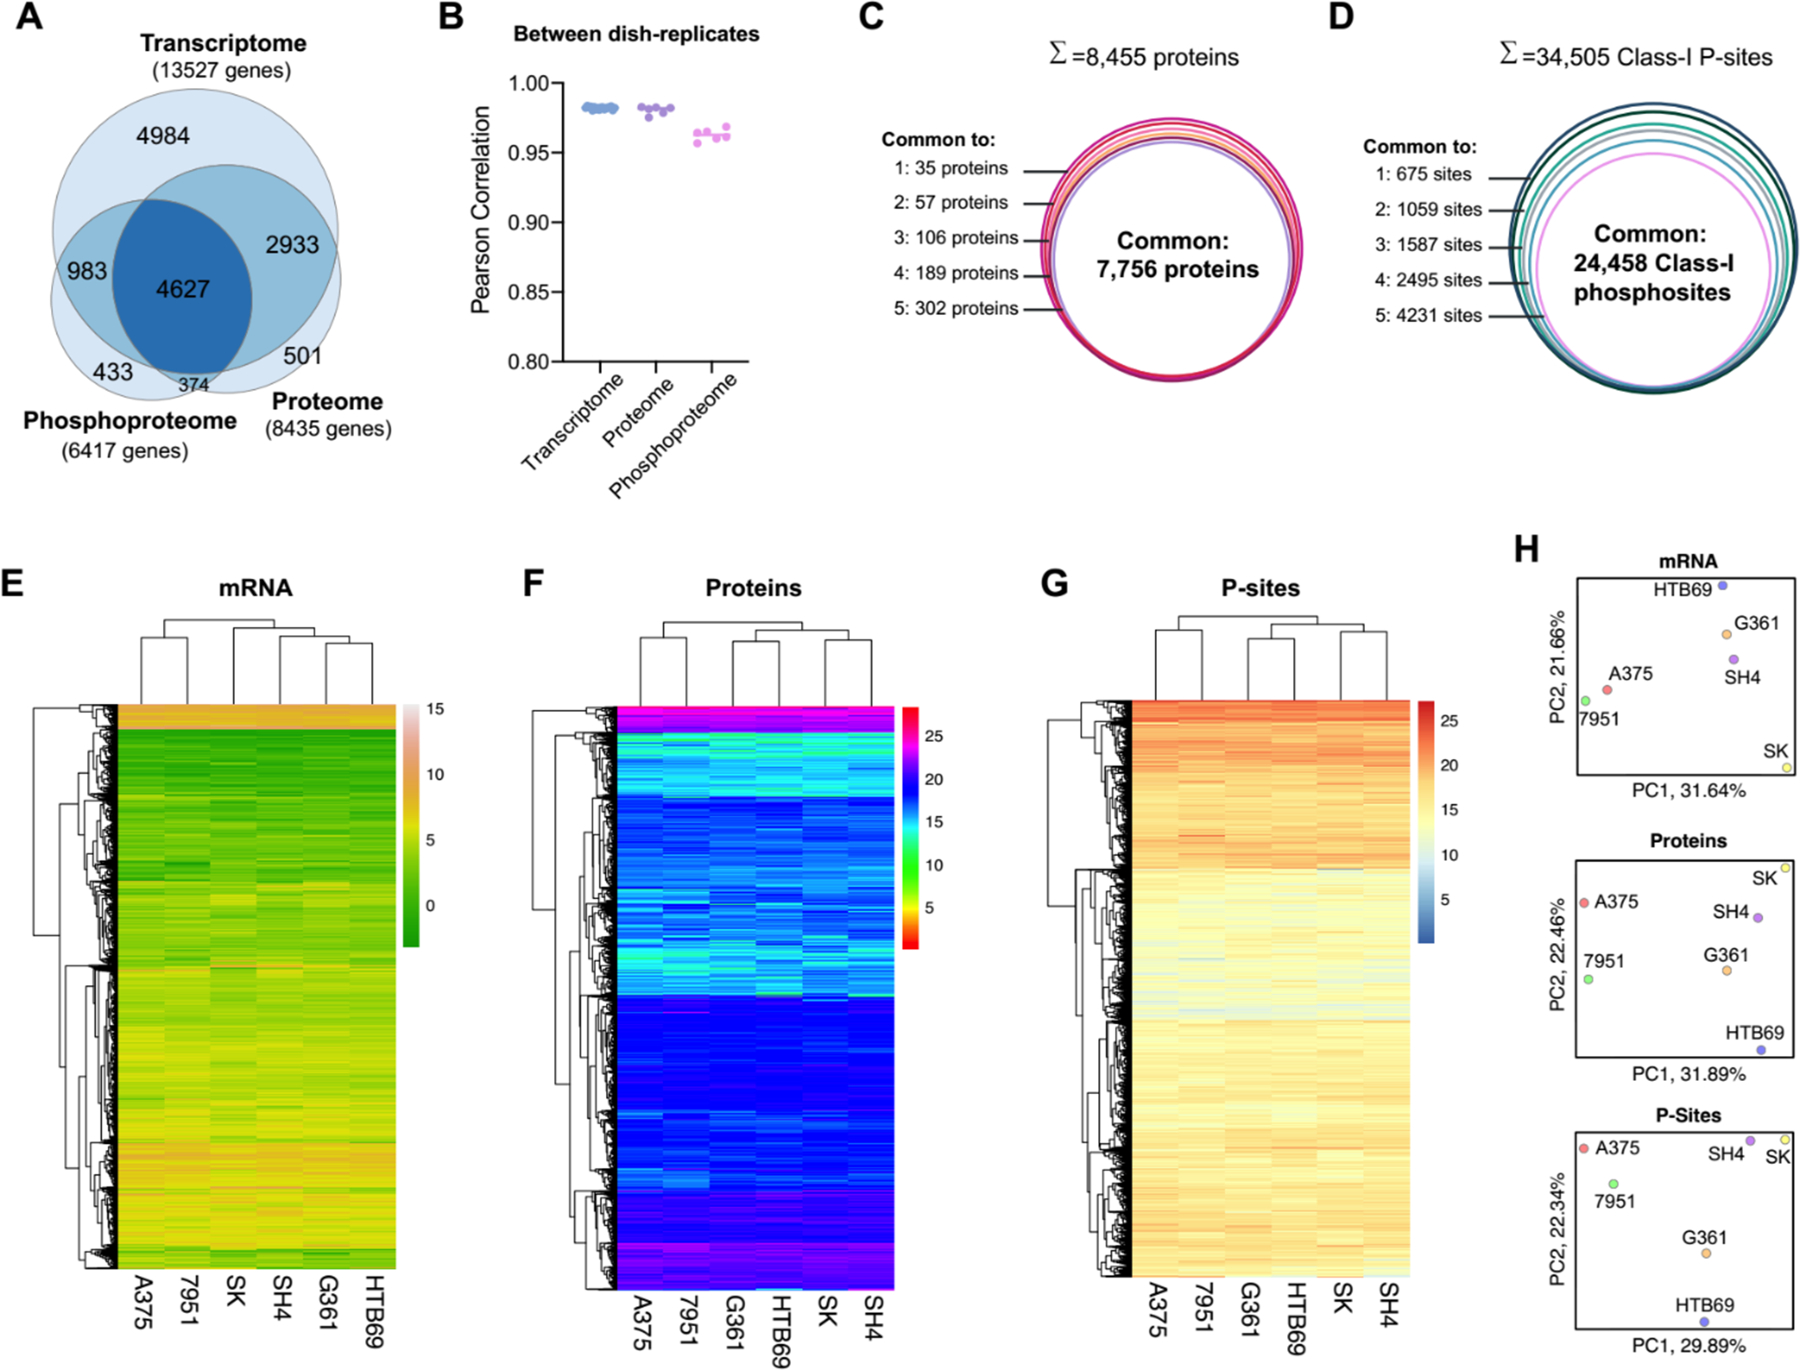
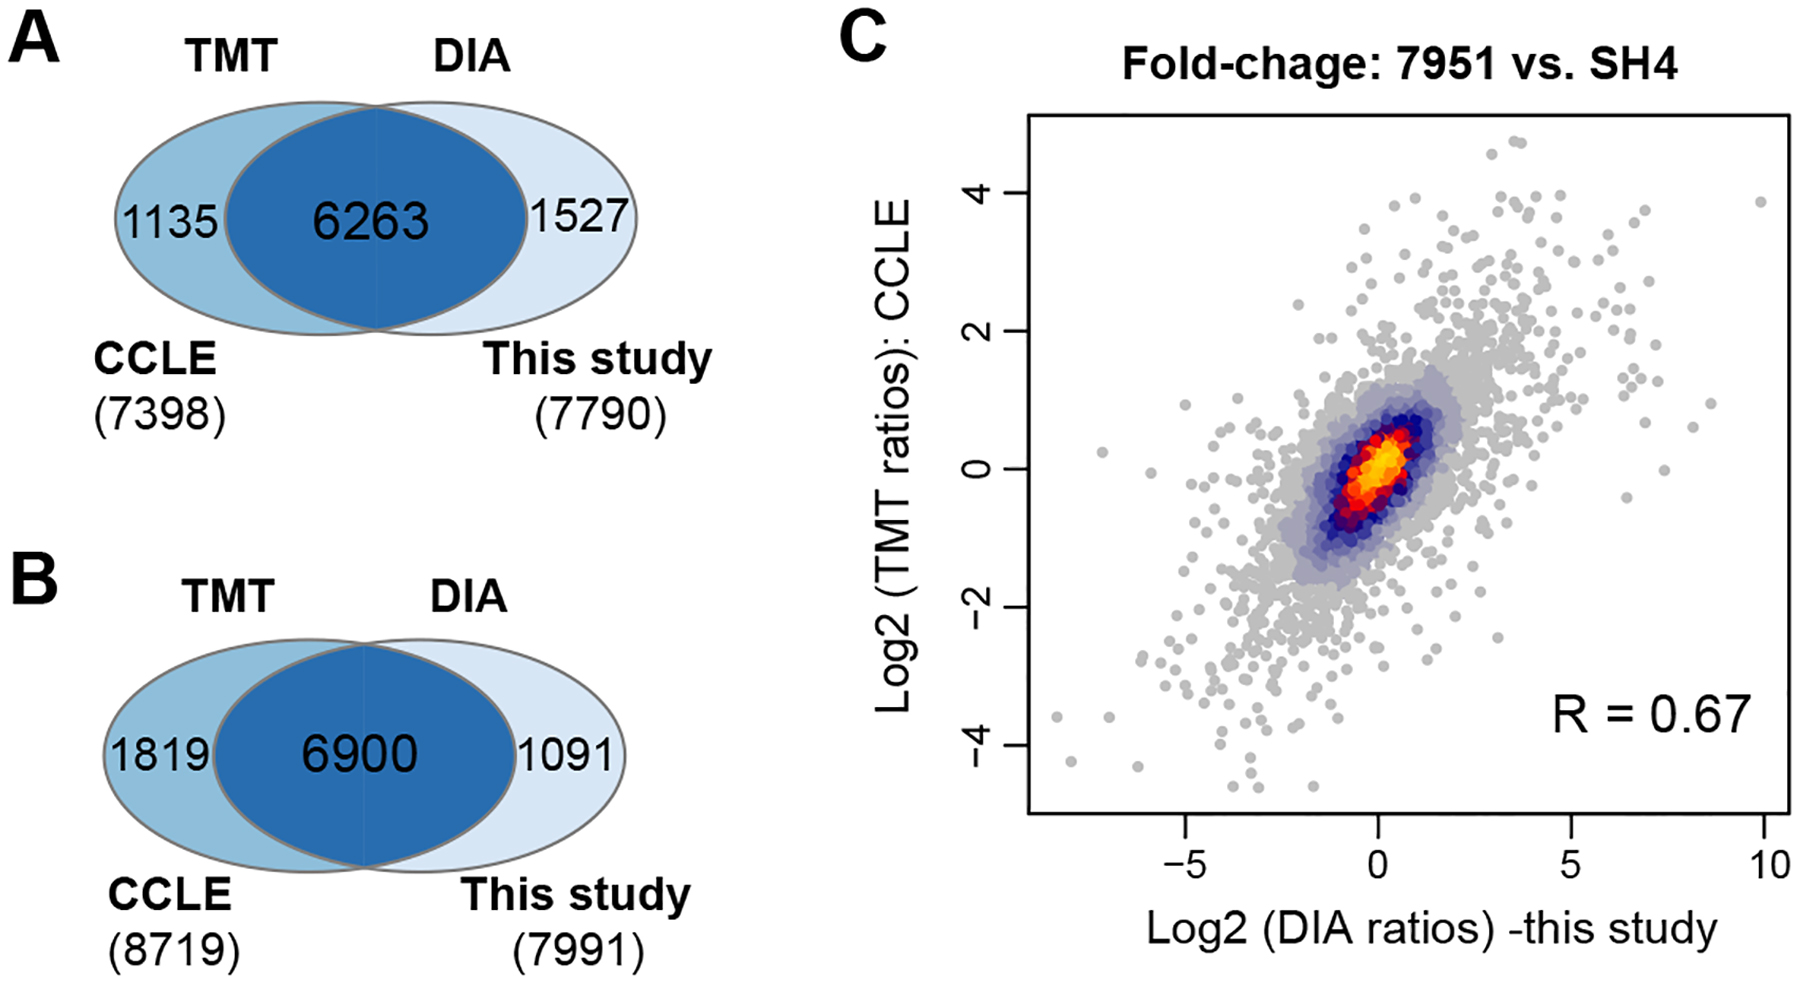
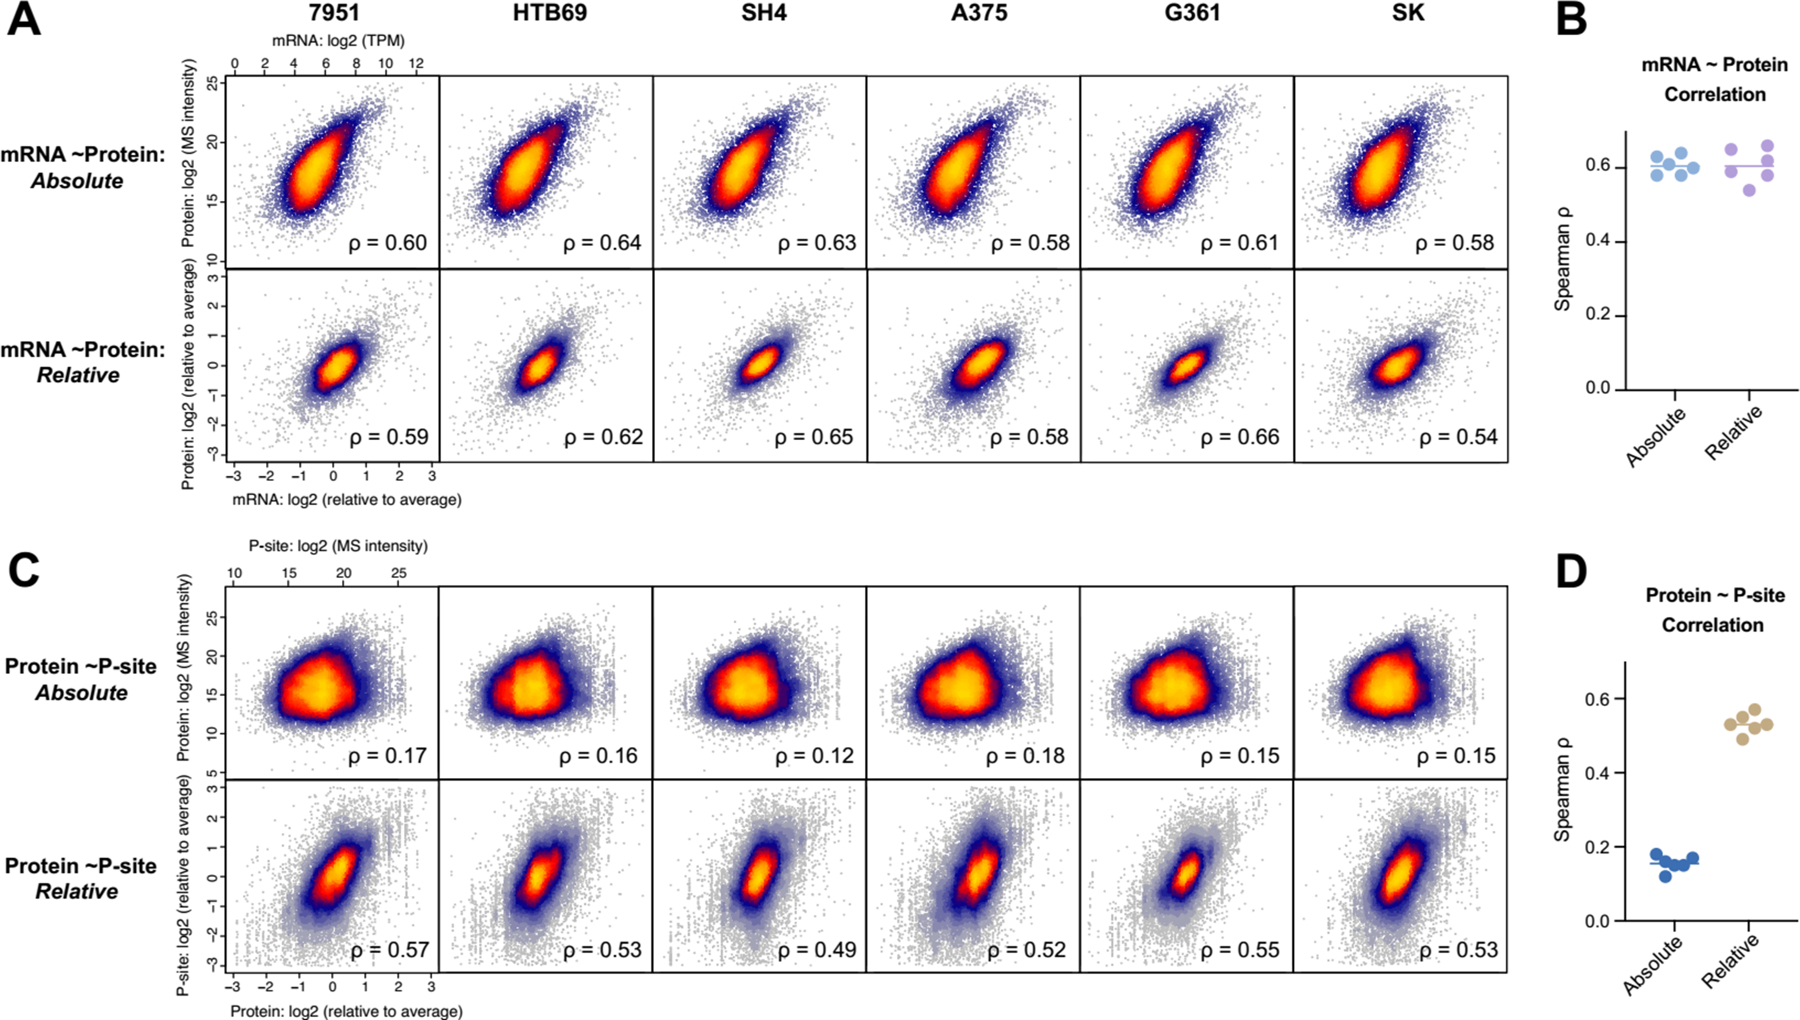
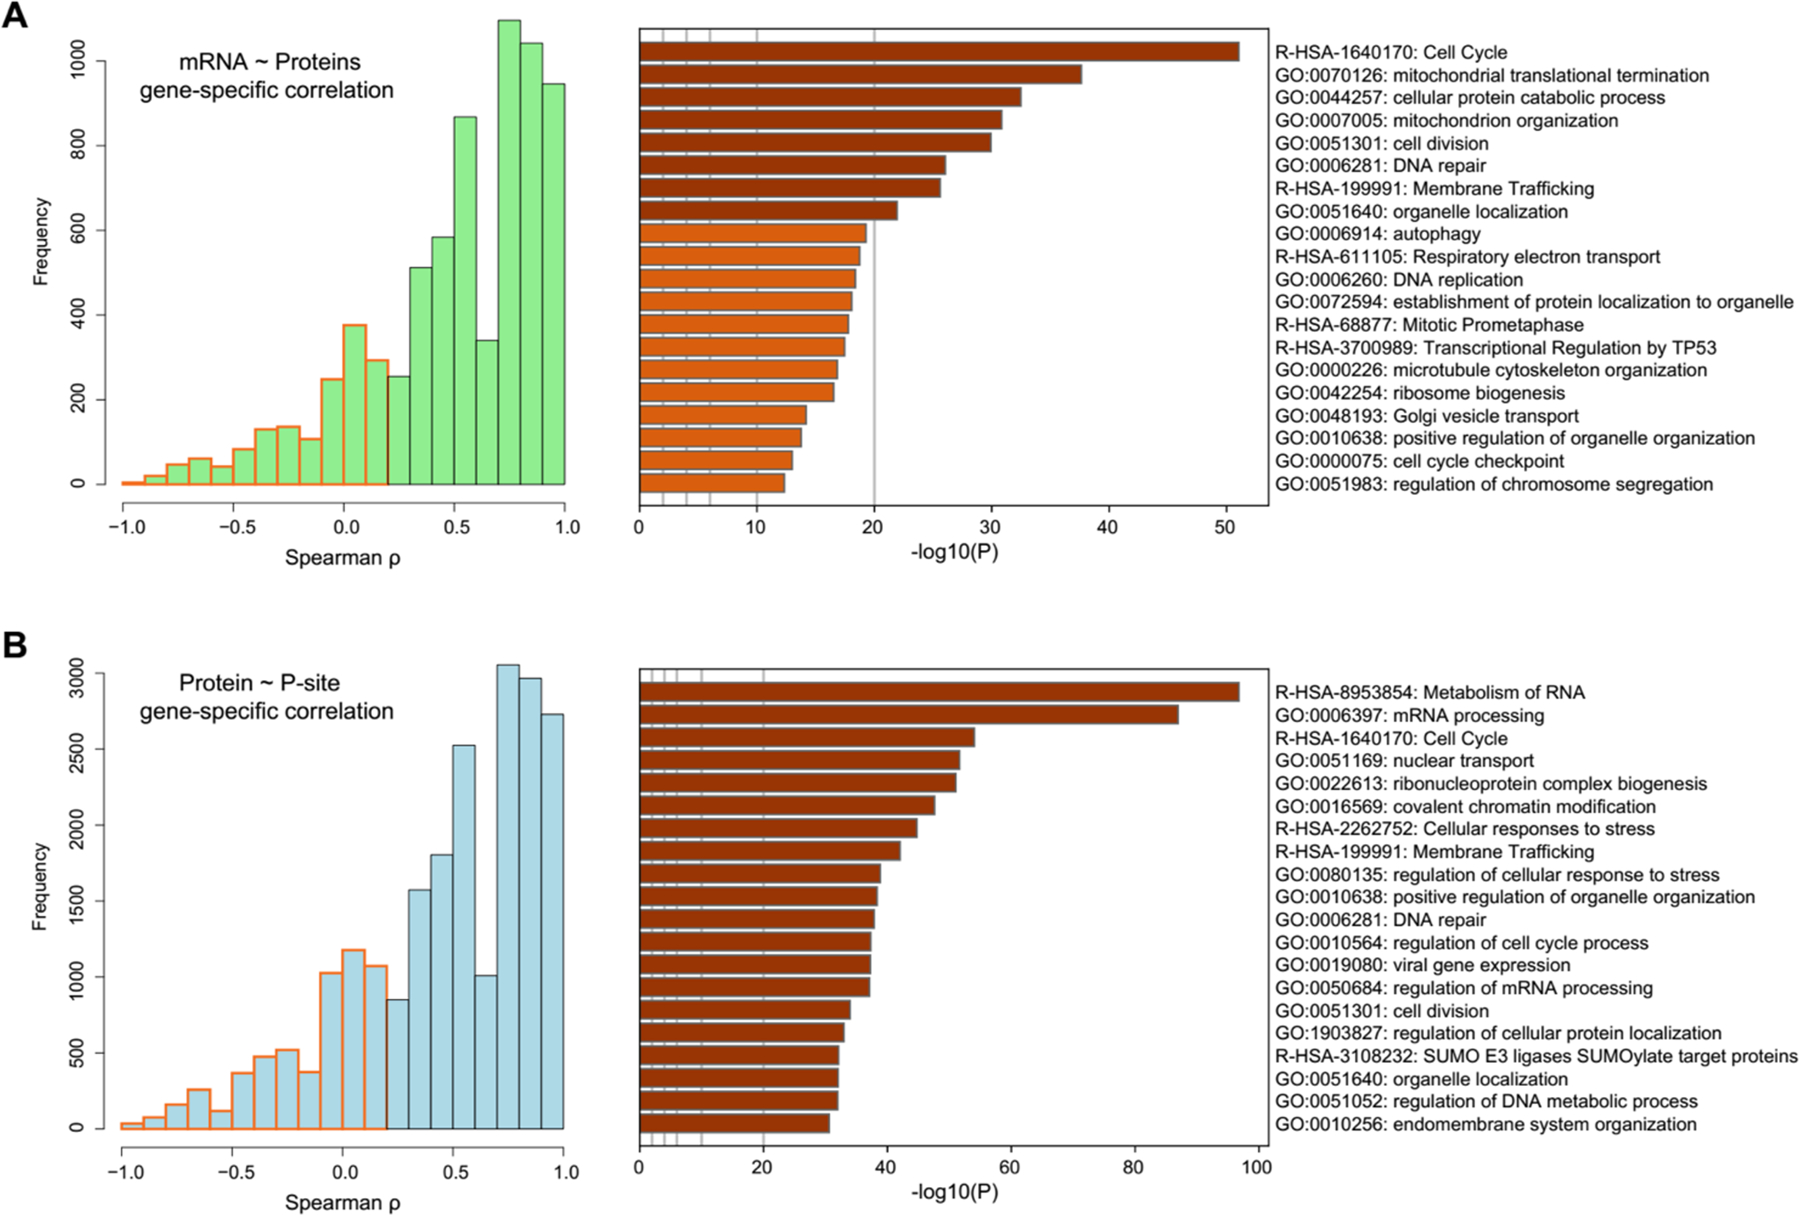
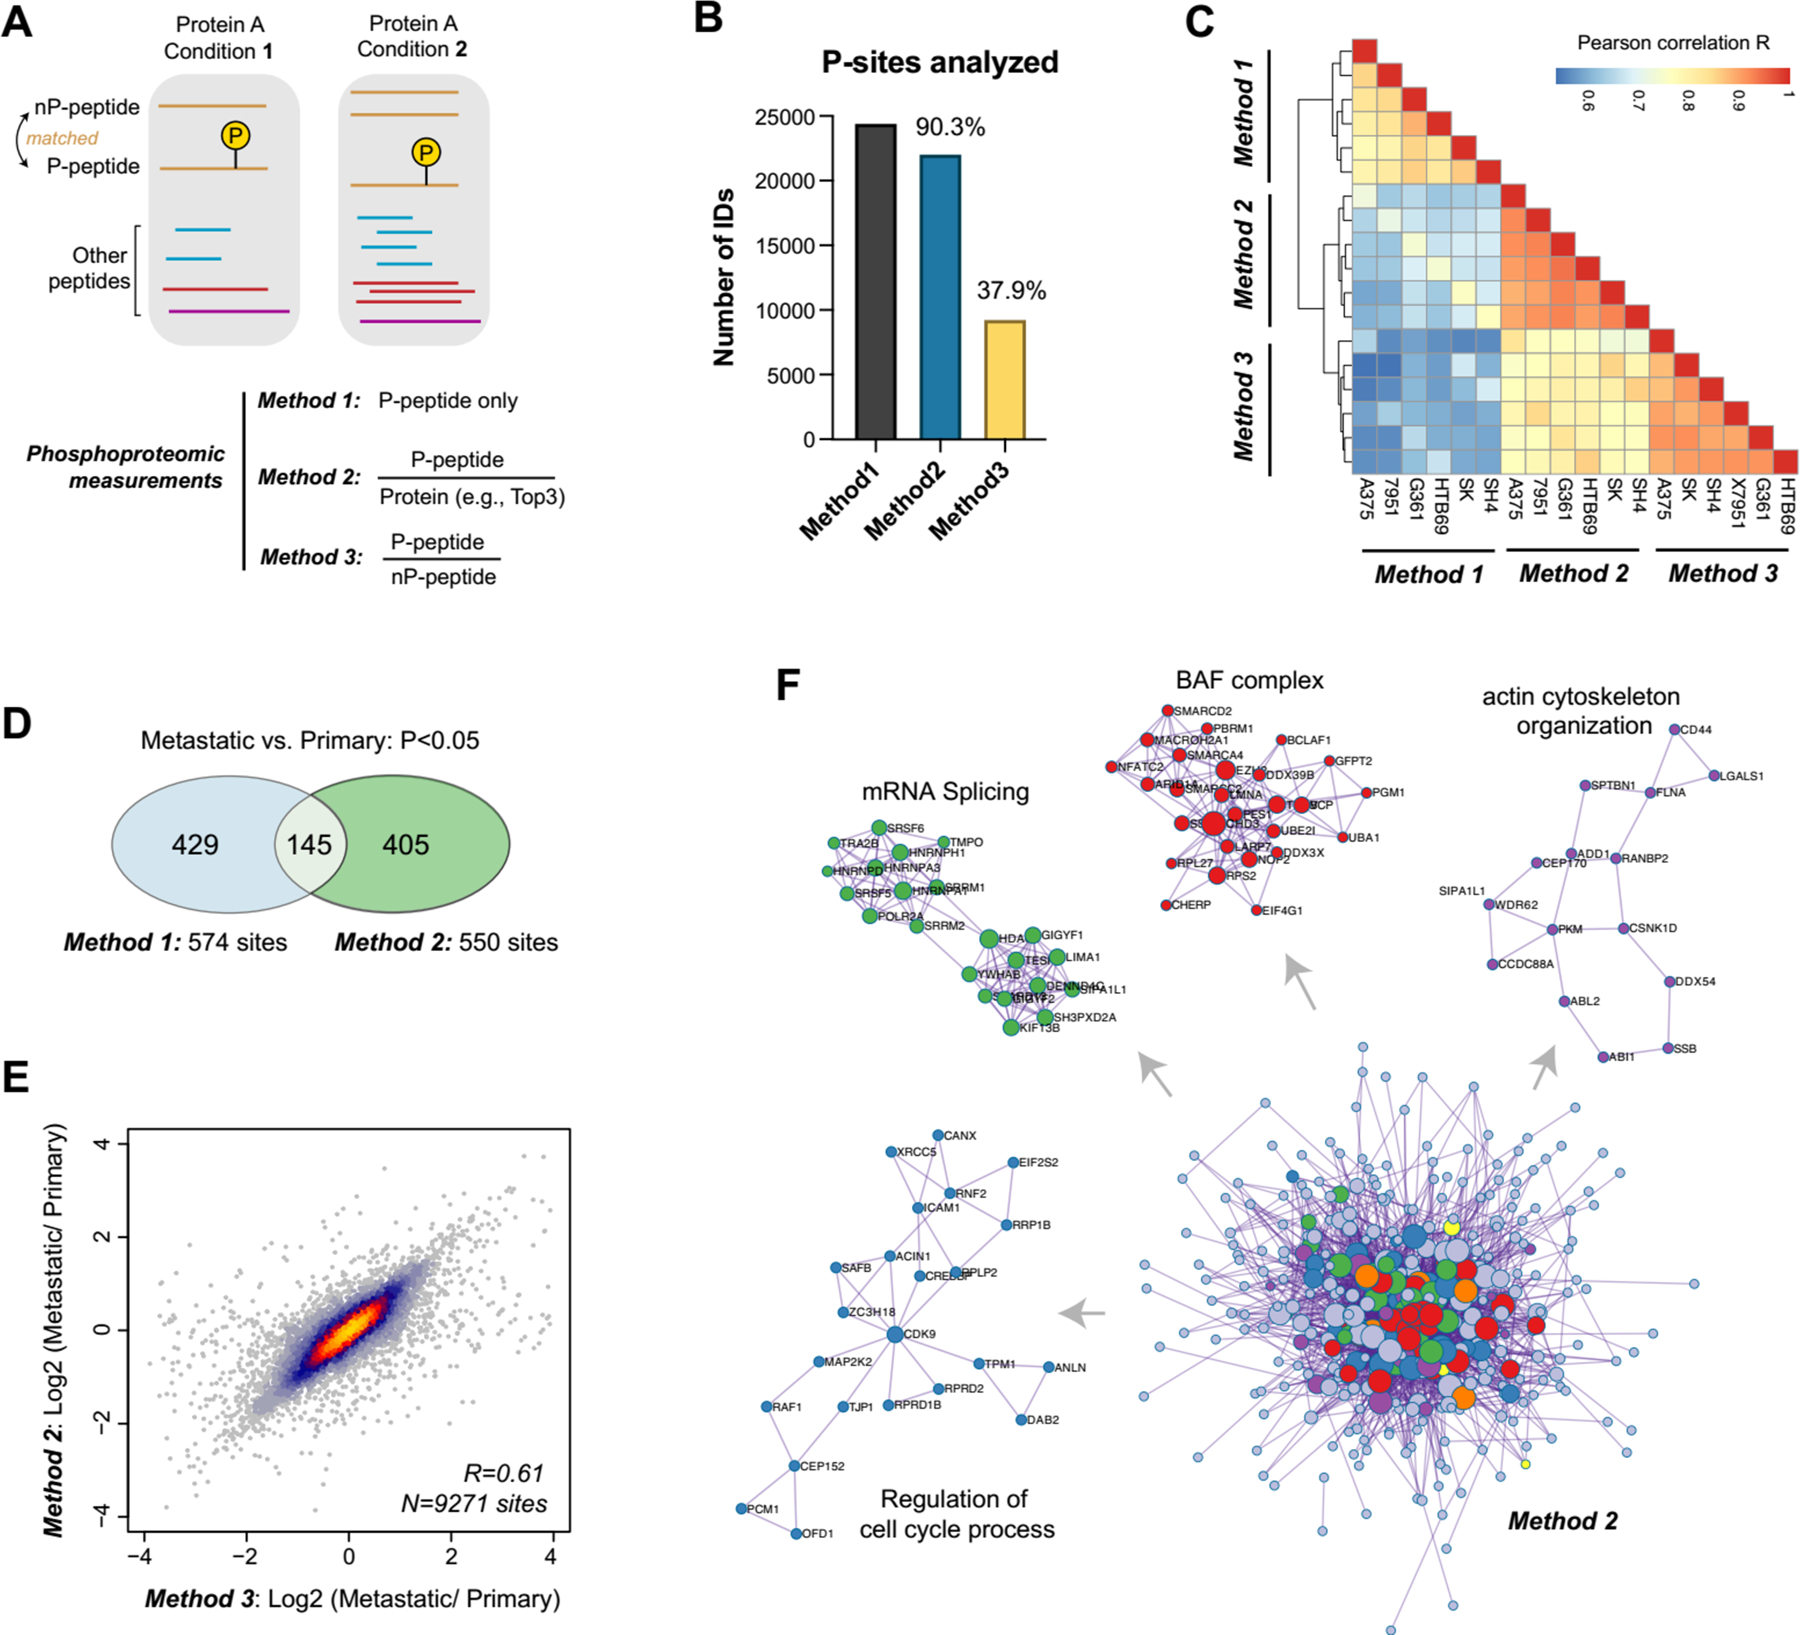
Human cancer cell lines are widely used in pharmacological and systems biological studies. The rapid documentation of the steady-state gene expression landscape of the cells used in a particular experiment may help to improve the reproducibility of scientific research. Here we applied a data-independent acquisition mass spectrometry (DIA-MS) method, coupled with a peptide spectral-library-free data analysis workflow, to measure both the proteome and phosphoproteome of a melanoma cell line panel with different metastatic properties. For each cell line, the single-shot DIA-MS detected 8100 proteins and almost 40 000 phosphopeptides in the respective measurements of two hours. Benchmarking the DIA-MS data towards the RNA-seq data and tandem mass tag (TMT)-MS results from the same set of cell lines demonstrated comparable qualitative coverage and quantitative reproducibility. Our data confirmed the high but complex mRNA-protein and protein-phospsite correlations. The results successfully established DIA-MS as a strong and competitive proteotyping approach for cell lines. The data further showed that all subunits of the glycosylphosphatidylinositol (GPI)-anchor transamidase complex were overexpressed in metastatic melanoma cells and identified altered phosphoprotein modules such as the BAF complex and mRNA splicing between metastatic and primary cells. This study provides a high-quality resource for calibrating DIA-MS performance, benchmarking DIA bioinformatic algorithms, and exploring the metastatic proteotypes in melanoma cells.


Conflict of interest statement

The authors declare no competing interests.

Figures

Figure 1 |
Figure 1 |
The numbers of unique peptides (left panel), protein groups (middle panel), and phosphopeptides (right panel) identified in the single-shot MS measurement of the six melanoma cell lines. A 2-hour measurement time was adopted for each DIA-MS analyzing one of the dish-replicates (i.e., 1 and 2). Both peptide and protein FDR were controlled at 1%.
Figure 2 |
Figure 2 |
Benchmarking the proteomic and phosphoproteomic results with the RNA-seq data. (A) The Venn diagram between the measured proteome, phosphoproteome and transcriptome of the cell lines. (B) Pearson correlation between dish-replicates, grouped by transcriptome, proteome and phosphoproteome. (C) The number of overlapped proteins measured across the six cell lines. (D) The number of overlapped Class-I phosphosites measured across the six cell lines. (E) Hierarchical clustering analysis of the transcript profiles in the six cell lines. (F) Hierarchical clustering analysis of the protein profiles measured in the six cell lines. (G) Hierarchical clustering analysis of the phosphopeptide (P-site) profiles measured in the six cell lines. (H) Principal component analysis of mRNA, protein and P-site profiles.
Figure 3 |
Figure 3 |
Benchmarking DIA-MS results in this study with the TMT data in Cancer Cell Line Encyclopedia (CCLE). (A) The overlapped proteins without any missing values measured by DIA-MS and TMT. (B) The overlapped proteins of SH4 and 7951 cells measured by DIA-MS and TMT. Note these two cell lines were measured in the same TMT-plex batch. (C) The scatter plot of the protein fold changes between SH4 and 7951 cells measured by DIA-MS and TMT.
Figure 4 |
Figure 4 |
Absolute and relative quantification relationships of mRNA vs. Protein and Protein vs. phosphosite. (A) The scatter plot of mRNA and protein quantities in the absolute (upper panel) and relative (lower panel) scales, separated by six individual six cells. (B) The Spearman correlation between mRNA and protein summarized. (C) The scatter plot of protein and phosphosite quantities in the absolute (upper panel) and relative (lower panel) scales, separated by six individual six cells. (D) The Spearman correlation between protein and phosphosite summarized.
Figure 5 |
Figure 5 |
The identification and functional annotation of the genes with low correlations across cells. (A) The histogram of the within-gene correlations between mRNA and protein. The genes with low correlation (ρ < 0.2, Spearman correlation) were marked in orange and functionally annotated by Meatscape. (B) The histogram of the within-phosphosite correlations between protein and phosphosite. The genes with low correlations (ρ < 0.2) were marked in red and functionally annotated by Meatscape.
Figure 6 |
Figure 6 |
The comparisons between different phosphoproteomic normalization strategies and phosphorylation-centric signaling alterations between metastatic and non-metastatic melanoma cell lines. (A) The overall scheme of three phosphoproteomic normalization strategies. (B) The number of P-sites analyzed by three methods. (C) The correlation analysis of P-sites analyzed by three methods. (D) The overlapped P-sites that were significantly changed between Method 1 and Method 2. (E) The scatter plot of the log-scale fold-changes of 9,271 P-sites between three metastatic cells and three primary cells determined by Method 2 or Method 3. (F) Following Method 2, 402 metastasis-associated genes were filtered (P<0.05 between metastatic and primary groups, student’s t-test) for functional annotation and the protein-protein interaction (PPI) network analysis by Metascape. The MCODE components were identified from the merged PPI network as core phosphoprotein modules and highlighted in different colors.

References

    1. Geiger T, Wehner A, Schaab C, Cox J and Mann M, Molecular & cellular proteomics : MCP, 2012, 11, M111 014050. - PMC - PubMed
    1. Barretina J, Caponigro G, Stransky N, Venkatesan K, Margolin AA, Kim S, Wilson CJ, Lehar J, Kryukov GV, Sonkin D, Reddy A, Liu M, Murray L, Berger MF, Monahan JE, Morais P, Meltzer J, Korejwa A, Jane-Valbuena J, Mapa FA, Thibault J, Bric-Furlong E, Raman P, Shipway A, Engels IH, Cheng J, Yu GK, Yu J, Aspesi P Jr., de Silva M, Jagtap K, Jones MD, Wang L, Hatton C, Palescandolo E, Gupta S, Mahan S, Sougnez C, Onofrio RC, Liefeld T, MacConaill L, Winckler W, Reich M, Li N, Mesirov JP, Gabriel SB, Getz G, Ardlie K, Chan V, Myer VE, Weber BL, Porter J, Warmuth M, Finan P, Harris JL, Meyerson M, Golub TR, Morrissey MP, Sellers WR, Schlegel R and Garraway LA, Nature, 2012, 483, 603–607. - PMC - PubMed
    1. Ghandi M, Huang FW, Jane-Valbuena J, Kryukov GV, Lo CC, McDonald ER 3rd, Barretina J, Gelfand ET, Bielski CM, Li H, Hu K, Andreev-Drakhlin AY, Kim J, Hess JM, Haas BJ, Aguet F, Weir BA, Rothberg MV, Paolella BR, Lawrence MS, Akbani R, Lu Y, Tiv HL, Gokhale PC, de Weck A, Mansour AA, Oh C, Shih J, Hadi K, Rosen Y, Bistline J, Venkatesan K, Reddy A, Sonkin D, Liu M, Lehar J, Korn JM, Porter DA, Jones MD, Golji J, Caponigro G, Taylor JE, Dunning CM, Creech AL, Warren AC, McFarland JM, Zamanighomi M, Kauffmann A, Stransky N, Imielinski M, Maruvka YE, Cherniack AD, Tsherniak A, Vazquez F, Jaffe JD, Lane AA, Weinstock DM, Johannessen CM, Morrissey MP, Stegmeier F, Schlegel R, Hahn WC, Getz G, Mills GB, Boehm JS, Golub TR, Garraway LA and Sellers WR, Nature, 2019, 569, 503–508. - PMC - PubMed
    1. Nusinow DP, Szpyt J, Ghandi M, Rose CM, McDonald ER 3rd, Kalocsay M, Jane-Valbuena J, Gelfand E, Schweppe DK, Jedrychowski M, Golji J, Porter DA, Rejtar T, Wang YK, Kryukov GV, Stegmeier F, Erickson BK, Garraway LA, Sellers WR and Gygi SP, Cell, 2020, 180, 387–402 e316. - PMC - PubMed
    1. Roumeliotis TI, Williams SP, Goncalves E, Alsinet C, Del Castillo Velasco-Herrera M, Aben N, Ghavidel FZ, Michaut M, Schubert M, Price S, Wright JC, Yu L, Yang M, Dienstmann R, Guinney J, Beltrao P, Brazma A, Pardo M, Stegle O, Adams DJ, Wessels L, Saez-Rodriguez J, McDermott U and Choudhary JS, Cell reports, 2017, 20, 2201–2214. - PMC - PubMed

Publication types

Substances