Comparative Study
. 2021 May 27;137(21):2869-2880.
doi: 10.1182/blood.2020009855.

Single-cell analysis can define distinct evolution of tumor sites in follicular lymphoma

Affiliations
Comparative Study

Single-cell analysis can define distinct evolution of tumor sites in follicular lymphoma

Sarah Haebe et al. Blood. .

Abstract

Tumor heterogeneity complicates biomarker development and fosters drug resistance in solid malignancies. In lymphoma, our knowledge of site-to-site heterogeneity and its clinical implications is still limited. Here, we profiled 2 nodal, synchronously acquired tumor samples from 10 patients with follicular lymphoma (FL) using single-cell RNA, B-cell receptor (BCR) and T-cell receptor sequencing, and flow cytometry. By following the rapidly mutating tumor immunoglobulin genes, we discovered that BCR subclones were shared between the 2 tumor sites in some patients, but in many patients, the disease had evolved separately with limited tumor cell migration between the sites. Patients exhibiting divergent BCR evolution also exhibited divergent tumor gene-expression and cell-surface protein profiles. While the overall composition of the tumor microenvironment did not differ significantly between sites, we did detect a specific correlation between site-to-site tumor heterogeneity and T follicular helper (Tfh) cell abundance. We further observed enrichment of particular ligand-receptor pairs between tumor and Tfh cells, including CD40 and CD40LG, and a significant correlation between tumor CD40 expression and Tfh proliferation. Our study may explain discordant responses to systemic therapies, underscores the difficulty of capturing a patient's disease with a single biopsy, and furthers our understanding of tumor-immune networks in FL.


Conflict of interest statement

Conflict-of-interest disclosure: The authors declare no competing financial interests.

Figures

None
Graphical abstract
Figure 1.
Figure 1.
Study overview. Workflow for sample processing and single-cell analyses of FL samples collected from 2 distinct lymph node tumor sites (tumor site A and tumor site B) from each patient. Fresh cell suspensions were processed in parallel for scBCR-seq, scRNA-seq, scTCR-seq, and flow cytometry.
Figure 2.
Figure 2.
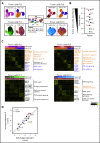
Interpatient heterogeneity in FL. (A) UMAP representation of dimensionally reduced scRNA-seq data from 20 tumor samples from 10 patients with FL following graph-based clustering. Clusters are assigned to indicated cell types by differentially expressed genes (see also supplemental Figure 1A-B) and cells are colored by patient identity (FL1-FL10). (B) Heatmap representing pathway activity of the top 30 MSigDB “Reactome” gene sets for each patient (FL1-FL10); analysis of variance with Tukey's honestly significant difference P < .05. Selected pathways are highlighted on the right of the heatmap. (C) Oncoprint showing mutations in genes known to be recurrently mutated in B-cell lymphomas, detected by targeted sequencing from archival tumor samples, available for indicated patients. The color coding delineates the type of alteration as indicated in the legend. The number of mutations in each tumor is plotted above.
Figure 3.
Figure 3.
Phylogenetic analysis of BCR-defined subclones reveals site-specific patterns. (A) Representative phylogenetic trees based on immunoglobulin heavy chain VDJ sequences from single-cell BCR sequencing of tumor samples from both sites from 2 patients with site-specific BCR subclones (FL2, FL8) and from 2 patients with shared BCR subclones (FL1, FL10). The sampled malignant lymph node sites (site A in orange, site B in purple) are visualized on the left for each patient. The bar below the phylogenetic tree reveals the site of origin for each BCR sequence in the tree. Similarity index (SI) according to Renkonen is given on the top right for each patient. (B) Representative trajectory analysis of tumor cells from scRNA-seq of tumor samples from both sites (site A and site B) from 2 patients with site-specific BCR subclones (FL2, FL8) and from 2 patients with shared BCR subclones (FL1, FL10). The cells are colored by tumor site.
Figure 4.
Figure 4.
Site-to-site heterogeneity in tumor cell gene expression. (A) Each patient`s tumor cells were subset from the main data set and reclustered as shown here for FL2, FL8, FL1, and FL10, with subgraphs colored by tumor subcluster (left) or by tumor site (right). (B) Jitter plot showing Renkonen SIs of tumor subpopulations for all 10 patients (FL1-FL10). (C) Heatmaps of the top differentially expressed genes (rows) between cells from each tumor subcluster (columns) for patients with the lowest and highest SI in panel B; the Wilcoxon test with Bonferroni correction was used. Genes and pathways upregulated in subclusters mainly found in site A are highlighted in orange, and those at site B in purple. Bars at the top indicate tumor subclusters and tumor site. (D) Pearson correlation between the degree of dissimilarity, based on SI, of tumor cells and BCR phylogeny between sites for each patient (FL1-FL10). Dots are colored by patient identity as in panel A.
Figure 5.
Figure 5.
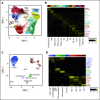
Characterization of the TME. (A) UMAP plot of all T cells from 20 tumors from 10 patients. Clusters are denoted by color and labeled according to phenotype. (B) Heatmap of the top 30 differentially expressed genes (rows) between T-cell subpopulations (columns; n = 3600 cells); the Wilcoxon test with Bonferroni correction was used. Selected canonical markers are highlighted on the right side. Bar above is colored by cluster as in panel A. (C) UMAP plot of non-T cells from 20 tumors from 10 patients. Clusters are denoted by color and labeled according to phenotype. (D) Heatmap of the top 30 differentially expressed genes (rows) between non-T subpopulations (columns; n = 2098 cells); the Wilcoxon test with Bonferroni correction was used. Selected canonical markers are highlighted on the right side. Bar above is colored by cluster as in panel C. FDC, follicular dendritic cell; pDC, plasmacytoid dendritic cell.
Figure 6.
Figure 6.
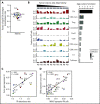
Site-to-site heterogeneity in the TME. (A) Fraction of 50 most abundant TCRβ clonotypes shared between tumor sites A and B. Dots are colored by patient identity as in Figure 2A. (B) Fraction of all T cells for each tumor site (tumor site A and site B) per patient (FL1-FL10), belonging to each T-cell subpopulation (left). Bars are colored by T-cell subpopulation as in Figure 5A. Spearman correlation between site-to-site abundance ratio of each T-cell subpopulation and tumor cell dissimilarity (quantified by Renkonen SI) (right). (C) Spearman correlation between site-to-site abundance ratio for Tfh cells and tumor cell dissimilarity (quantified by SI). Dots are colored by patient identity. (D) Spearman correlation of CD40 expression in tumor cells and MKI67 expression in Tfh cells of all 20 tumor samples. Dots are colored by patient identity.
Figure 7.
Figure 7.
Multiple orthogonal single-cell methods reveal site-to-site heterogeneity in FL. (A) Summary plot showing the degree of site-to-site dissimilarity for each single-cell method (symbols) for each patient (FL1-FL10). Site-to-site dissimilarity is quantified by Renkonen SI for scBCR-seq, scRNA-seq, and flow cytometry and by site-to-site abundance ratio for Tfh cells. (B) Model illustrating (I) cases with divergent clonal evolution and little cell migration leading to significant site-to-site heterogeneity, including in recruitment and co-option of Tfh cells, compared to (II) cases with high degree of tumor cell migration between sites, leading to increased sharing of evolving subclones.

Comment in

References

    1. Meacham CE, Morrison SJ. Tumour heterogeneity and cancer cell plasticity. Nature. 2013;501(7467):328-337. - PMC - PubMed
    1. Andor N, Graham TA, Jansen M, et al. . Pan-cancer analysis of the extent and consequences of intratumor heterogeneity. Nat Med. 2016;22(1):105-113. - PMC - PubMed
    1. Yachida S, Jones S, Bozic I, et al. . Distant metastasis occurs late during the genetic evolution of pancreatic cancer. Nature. 2010;467(7319):1114-1117. - PMC - PubMed
    1. Gerlinger M, Rowan AJ, Horswell S, et al. . Intratumor heterogeneity and branched evolution revealed by multiregion sequencing. N Engl J Med. 2012;366(10):883-892. - PMC - PubMed
    1. Tan D, Horning SJ, Hoppe RT, et al. . Improvements in observed and relative survival in follicular grade 1-2 lymphoma during 4 decades: the Stanford University experience. Blood. 2013;122(6):981-987. - PMC - PubMed

Publication types

MeSH terms