. 2021 Aug;48(4):479-494.
doi: 10.1007/s10928-021-09739-y. Epub 2021 Mar 16.

Population pharmacokinetic characteristics of cemiplimab in patients with advanced malignancies

Affiliations

Population pharmacokinetic characteristics of cemiplimab in patients with advanced malignancies

Feng Yang et al. J Pharmacokinet Pharmacodyn. 2021 Aug.

Abstract

Cemiplimab, a human monoclonal antibody targeting programmed cell death-1 (PD-1) receptor, demonstrated antitumor activity in patients with advanced malignancies and a safety profile comparable to other anti-PD-1 therapies. This population pharmacokinetics (PopPK) analysis of cemiplimab included 11,178 pharmacokinetics (PK) observations from 548 patients pooled from a first-in-human study (Study 1423; NCT02383212) in advanced malignancies and a Phase 2 study (Study 1540; NCT02760498) in advanced cutaneous squamous cell carcinoma (CSCC). Most patients (80.3%) received cemiplimab 3 mg/kg every 2 weeks (Q2W) intravenously (IV). A PopPK model was developed by evaluating two-compartment linear models with an empirical non-linear function describing time-varying change in cemiplimab clearance and covariates that improved goodness-of-fit. PopPK simulations were used to describe cemiplimab exposure generated by a fixed 350 mg every 3 weeks (Q3W) IV dose regimen. PopPK modeling showed that a two-compartment model with zero-order IV infusion rate and first-order elimination rate well described individual concentrations of cemiplimab. Although several covariates, including baseline body weight and albumin concentrations, had a modest impact on cemiplimab exposure, the magnitude of influence was within the typical observed PK variability of approximately 30%. Based on PopPK simulation results, the 350 mg Q3W dose regimen was selected for further studies in advanced malignancies, including advanced CSCC. Similarity in observed cemiplimab exposure at the fixed 350 mg Q3W and the weight-based 3 mg/kg Q2W dose regimens confirmed this fixed dose selection. A robust PopPK model was developed to describe cemiplimab concentrations and supported use of the fixed 350 mg Q3W IV dose regimen.

Keywords: Cemiplimab; Covariates; Fixed dose selection; Population modeling and simulations; Time-varying clearance.


Figures
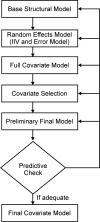
Fig. 1
Fig. 1
Overview of PopPK analysis. IIV, inter-individual variability; PopPK, population pharmacokinetics
Fig. 2
Fig. 2
Structural representation of a two-compartment model with linear elimination for IV administration. Plasma clearance was derived from ke × V2; inter–compartmental clearance between the central and peripheral compartments (Q) was derived from k23 and k32. A2, the amount of cemiplimab in the central compartment with a volume V2; A3, the amount of cemiplimab in the peripheral compartment with a volume V3; IV, intravenous; k23, k32, inter-compartmental rate constants; ke, elimination rate constant; V2, volumes of distribution (central compartment); V3, volume of distribution (peripheral compartment)
Fig. 3
Fig. 3
Tornado plots of post hoc steady-state AUC6wk,ss and Ctrough,ss by relevant covariates at 3 mg/kg Q2W. Dashed black lines represent the steady state median of AUC6wk,ss or Ctrough,ss at 3 mg/kg Q2W for a typical patient. Solid black lines represent relevant covariates, continuous variables or categorical variables. Black dots represent the relative exposure in sub-populations (either the top 90% percentile or bottom 10% of the relevant covariates) for continuous variables, or sub-populations indicated by categorical variables. The length of the bar from the black dashed line represents the fold change in relation to the reference exposure at 3 mg/kg Q2W. The blue and red lines represent the median exposures at 1 mg/kg Q2W and 10 mg/kg Q2W, respectively. The green lines represent 75% or 125% of the reference exposure. ADASTA, anti-drug antibody status; ALBBL, albumin concentration at baseline; ALPBL, alkaline phosphatase concentration at baseline; ALTBL, alanine aminotransferase concentration at baseline; ASTBL, aspartate aminotransferase concentration at baseline; AUC6wk,ss, area under curve over 6 weeks at steady state; BILIBL, total bilirubin concentration at baseline; BMIBL, body mass index at baseline; CORTFLN, corticosteroid (yes or no); CRCLBL, creatinine clearance at baseline; CREATBL, creatinine concentration at baseline; CSCCP2F, cutaneous squamous cell carcinoma (yes or no); Ctrough,ss minimum concentration at steady state; IGGBL, immunoglobulin G concentration at baseline; LDHBL, lactate dehydrogenase concentration at baseline; Q2W, every 2 weeks; WGTBL, body weight at baseline
Fig. 4
Fig. 4
Diagnostic plots of final covariate model. a, b Observed (DV) vs population/individual-predicted (PRED/IPRED) cemiplimab concentrations. c, d Conditional weighted residue (CWRES) vs time and PRED
Fig. 5
Fig. 5
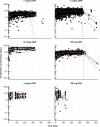
Visual predictive check plots for the PopPK model by dose groups in Studies 1423* and 1540. Black solid circles represent individually observed concentrations. Red and blue lines represent geometric mean (standard deviation) of individually predicted concentrations and geometric mean (standard deviation) of typical predicted concentrations, respectively. *One patient in the 10 mg/kg Q2W group of Study 1423 received the wrong dose (1 mg/kg) on Day 1; data from this patient are included in this figure. PopPK, population pharmacokinetics; Q2W, every 2 weeks; Q3W, every 3 weeks
Fig. 6
Fig. 6
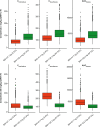
Boxplots of simulated cemiplimab exposure at steady state for BW extremes (N = 2000). AUC6wk,ss, area under curve over 6 weeks at steady state; BW, body weight; Cmax,6wk,ss, maximum concentration over 6 weeks at steady state; Cmin,6wk,ss, minimum concentration over 6 weeks at steady state; IV, intravenous; Q2W, every 2 weeks; Q3W, every 3 weeks
Fig. 7
Fig. 7
Overlay of observed and simulated cemiplimab concentration–time data at 350 mg Q3W. Plot shows the median (black line) and 95% CI (gray area) of simulated cemiplimab concentration–time data in 2000 patients with advanced malignancies overlaid with observed data points (dots) from 43 patients with advanced CSCC in Study 1540. Low pre-infusion concentrations were observed in two patients with missed doses (purple dots). CI, confidence interval; CSCC, cutaneous squamous cell carcinoma; Q3W, every 3 weeks

References

    1. Burova E, Hermann A, Waite J, Potocky T, Lai V, Hong S, Liu M, Allbritton O, Woodruff A, Wu Q, D'Orvilliers A, Garnova E, Rafique A, Poueymirou W, Martin J, Huang T, Skokos D, Kantrowitz J, Popke J, Mohrs M, MacDonald D, Ioffe E, Olson W, Lowy I, Murphy A, Thurston G. Characterization of the anti-PD-1 antibody REGN2810 and its antitumor activity in human PD-1 knock-in mice. Mol Cancer Ther. 2017;16(5):861–870. doi: 10.1158/1535-7163.MCT-16-0665. - DOI - PubMed
    1. Migden MR, Rischin D, Schmults CD, Guminski A, Hauschild A, Lewis KD, Chung CH, Hernandez-Aya L, Lim AM, Chang ALS, Rabinowits G, Thai AA, Dunn LA, Hughes BGM, Khushalani NI, Modi B, Schadendorf D, Gao B, Seebach F, Li S, Li J, Mathias M, Booth J, Mohan K, Stankevich E, Babiker HM, Brana I, Gil-Martin M, Homsi J, Johnson ML, Moreno V, Niu J, Owonikoko TK, Papadopoulos KP, Yancopoulos GD, Lowy I, Fury MG. PD-1 blockade with cemiplimab in advanced cutaneous squamous-cell carcinoma. N Engl J Med. 2018;379(4):341–351. doi: 10.1056/NEJMoa1805131. - DOI - PubMed
    1. Regeneron Pharmaceuticals, Inc. (2021) LIBTAYO® [cemiplimab-rwlc] injection full US prescribing information. Regeneron Pharmaceuticals, Inc. https://www.accessdata.fda.gov/drugsatfda_docs/label/2021/761097s007lbl.pdf. Accessed 23 Feb 2021
    1. European Medicines Agency (2019) LIBTAYO® EPAR. https://www.ema.europa.eu/en/medicines/human/EPAR/libtayo. Accessed 23 Feb 2021
    1. Fairman D, Narwal R, Liang M, Robbins PB, Schneider A, Chavez C, Lu H, Pak M, Blake-Haskins A, Vasselli J. Pharmacokinetics of MEDI4736, a fully human anti-PD-L1 monoclonal antibody, in patients with advanced solid tumors. J Clin Oncol. 2014;32(15_suppl):2602. doi: 10.1200/jco.2014.32.15_suppl.2602. - DOI

MeSH terms

Substances

LinkOut - more resources