. 2021 May 1;320(5):G864-G879.
doi: 10.1152/ajpgi.00453.2020. Epub 2021 Mar 17.

Coordinated signaling of activating transcription factor 6α and inositol-requiring enzyme 1α regulates hepatic stellate cell-mediated fibrogenesis in mice

Affiliations

Coordinated signaling of activating transcription factor 6α and inositol-requiring enzyme 1α regulates hepatic stellate cell-mediated fibrogenesis in mice

Fei Xue et al. Am J Physiol Gastrointest Liver Physiol. .

Abstract

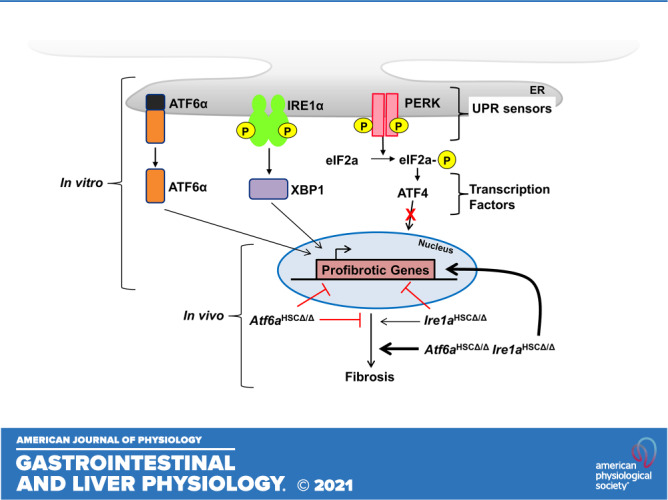
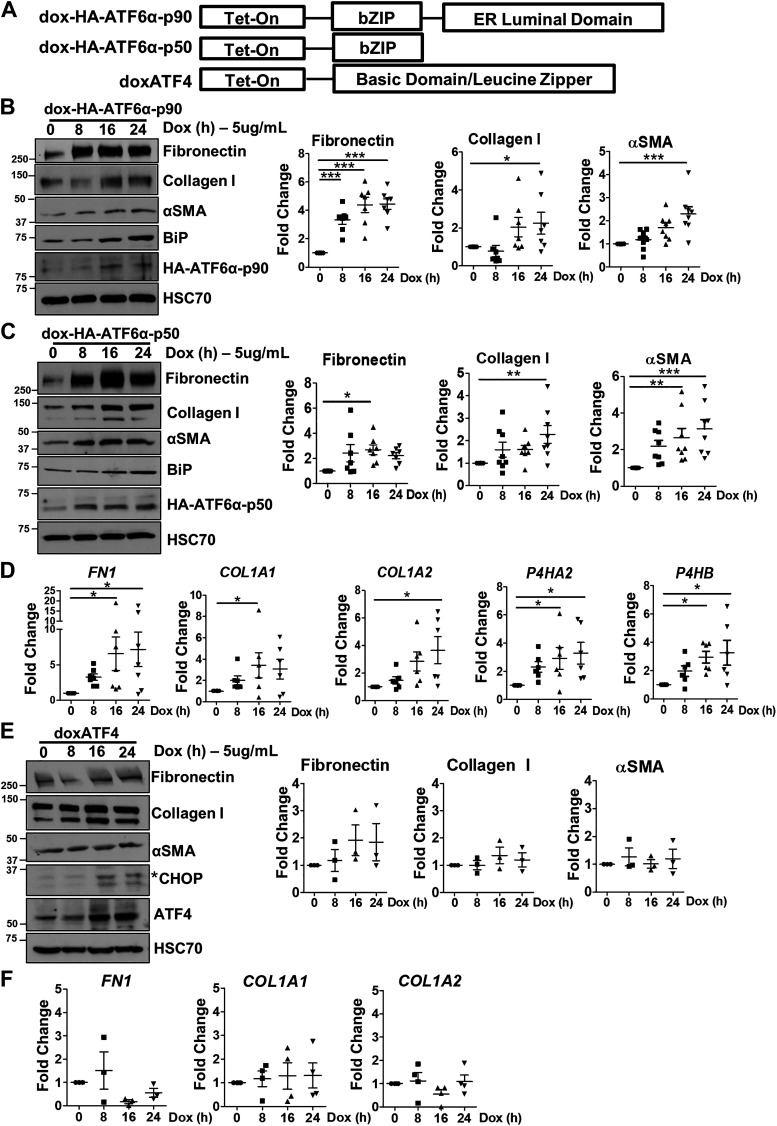
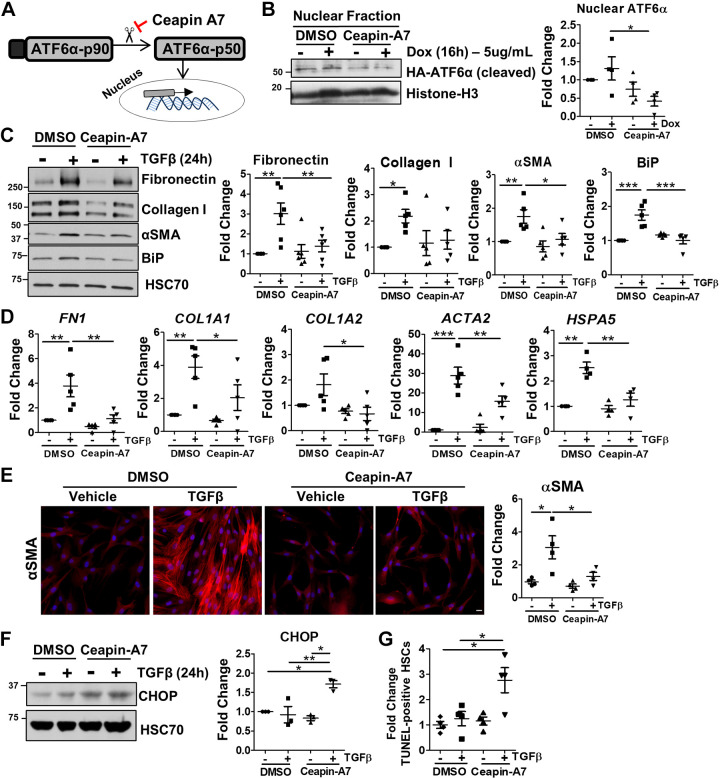
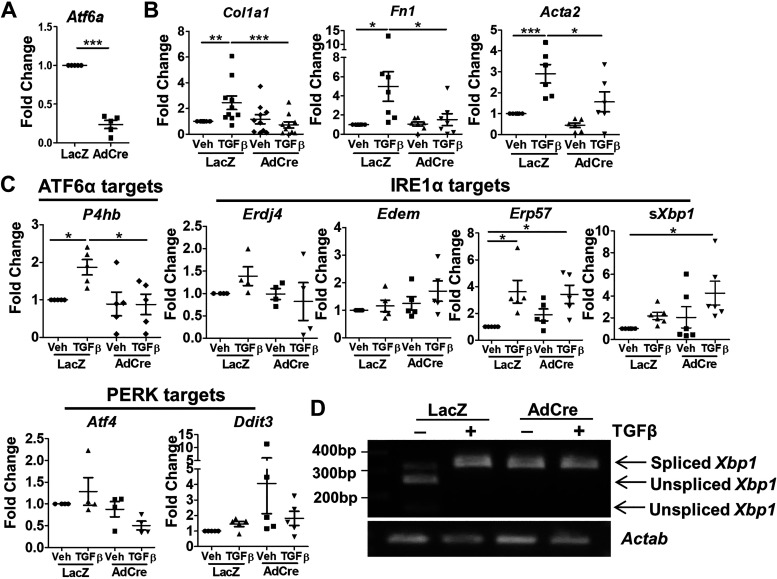
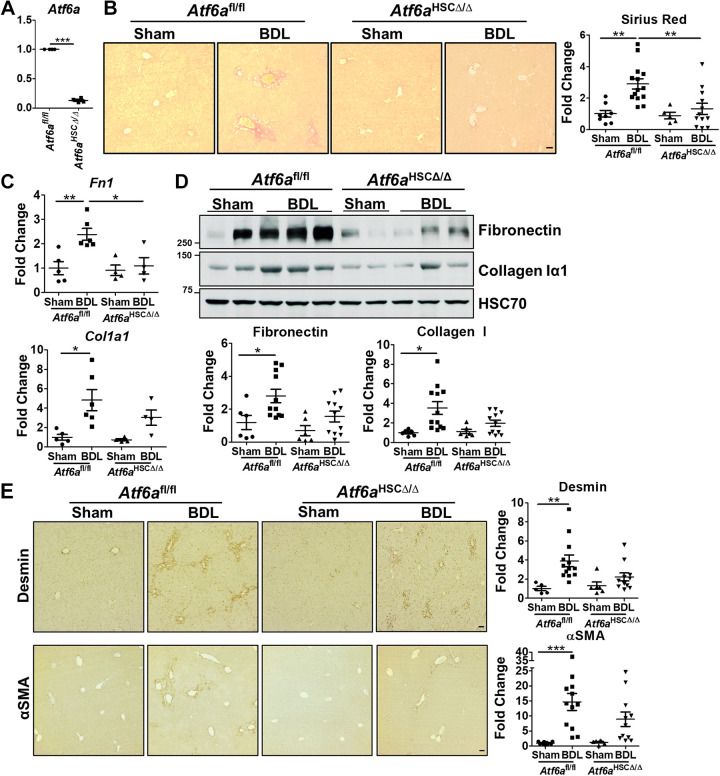
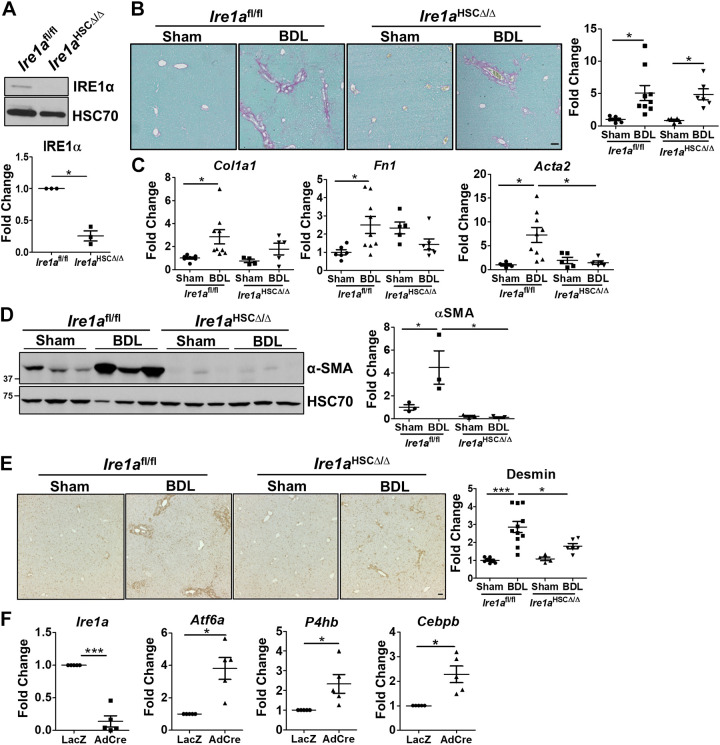
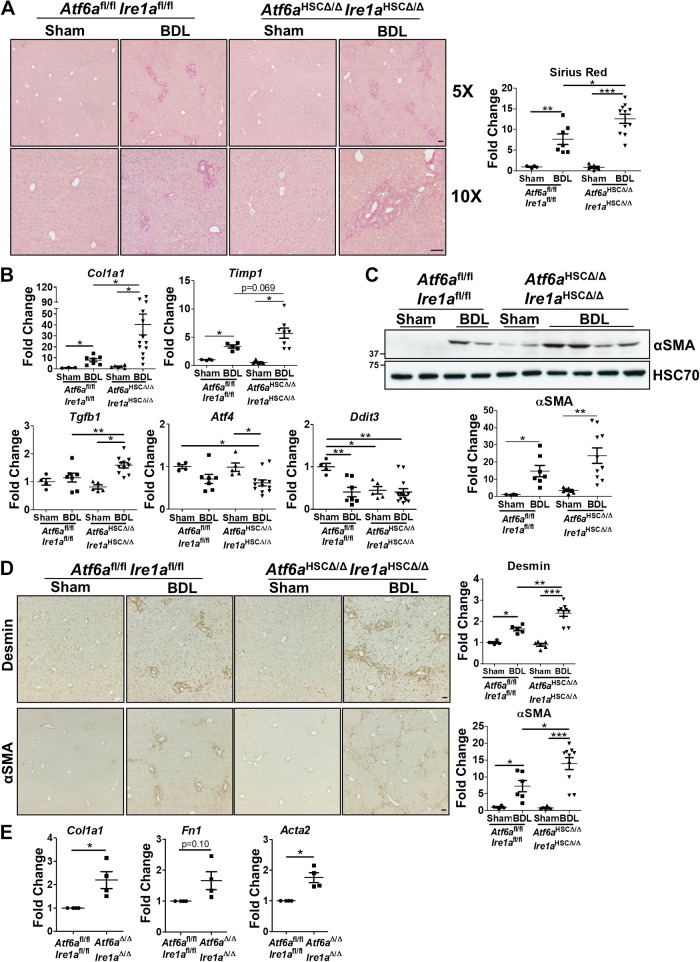
Liver injury and the unfolded protein response (UPR) are tightly linked, but their relationship differs with cell type and injurious stimuli. UPR initiation promotes hepatic stellate cell (HSC) activation and fibrogenesis, but the underlying mechanisms are unclear. Despite the complexity and overlap downstream of UPR transducers inositol-requiring protein 1α (IRE1α), activating transcription factor 6α (ATF6α), and protein kinase RNA-like ER kinase (PERK), previous research in HSCs primarily focused on IRE1α. Here, we investigated the fibrogenic role of ATF6α or PERK in vitro and HSC-specific UPR signaling in vivo. Overexpression of ATF6α, but not the PERK effector activating transcription factor 4 (ATF4), promoted HSC activation and fibrogenic gene transcription in immortalized HSCs. Furthermore, ATF6α inhibition through Ceapin-A7, or Atf6a deletion, disrupted transforming growth factor β (TGFβ)-mediated activation of primary human hepatic stellate cells (hHSCs) or murine hepatic stellate cells (mHSCs), respectively. We investigated the fibrogenic role of ATF6α in vivo through conditional HSC-specific Atf6a deletion. Atf6aHSCΔ/Δ mice displayed reduced fibrosis and HSC activation following bile duct ligation (BDL) or carbon tetrachloride (CCl4)-induced injury. The Atf6aHSCΔ/Δ phenotype differed from HSC-specific Ire1a deletion, as Ire1aHSCΔ/Δ mice showed reduced fibrogenic gene transcription but no changes in fibrosis compared with Ire1afl/fl mice following BDL. Interestingly, ATF6α signaling increased in Ire1aΔ/Δ HSCs, whereas IRE1α signaling was upregulated in Atf6aΔ/Δ HSCs. Finally, we asked whether co-deletion of Atf6a and Ire1a additively limits fibrosis. Unexpectedly, fibrosis worsened in Atf6aHSCΔ/ΔIre1aHSCΔ/Δ mice following BDL, and Atf6aΔ/ΔIre1aΔ/Δ mHSCs showed increased fibrogenic gene transcription. ATF6α and IRE1α individually promote fibrogenic transcription in HSCs, and ATF6α drives fibrogenesis in vivo. Unexpectedly, disruption of both pathways sensitizes the liver to fibrogenesis, suggesting that fine-tuned UPR signaling is critical for regulating HSC activation and fibrogenesis.NEW & NOTEWORTHY ATF6α is a critical driver of hepatic stellate cell (HSC) activation in vitro. HSC-specific deletion of Atf6a limits fibrogenesis in vivo despite increased IRE1α signaling. Conditional deletion of Ire1α from HSCs limits fibrogenic gene transcription without impacting overall fibrosis. This could be due in part to observed upregulation of the ATF6α pathway. Dual loss of Atf6a and Ire1a from HSCs worsens fibrosis in vivo through enhanced HSC activation.

Keywords: ER stress; endoplasmic reticulum; fibrosis; hepatic fibrosis; unfolded protein response.


Conflict of interest statement

No conflicts of interest, financial or otherwise, are declared by the authors.

Figures

None
Graphical abstract
Figure 1.
Figure 1.
ATF6α, but not ATF4, promotes HSC activation. A: to investigate the roles of either ATF6α or ATF4 in HSC activation, we utilize three constructs fused to doxycycline-inducible promoters: an HA-tagged full-length ATF6α (dox-HA-ATF6α-p90), an HA-tagged active form of ATF6α (dox-HA-ATF6α-p50), or an ATF4 construct (doxATF4). LX-2 cells were stably infected with one of the three constructs and underwent hygromycin selection to generate stable cell lines. B: dox-HA-ATF6α-p90 cells were treated with doxycycline (5 μg/mL) for 0, 8, 16, or 24 h. Cell lysates were harvested and analyzed by immunoblotting for fibronectin, collagen I, αSMA, HA-ATF6α, BiP (positive control), or HSC70 (loading control). Quantification located in adjacent graphs. n = 7. C and D: dox-HA-ATF6α-p50 cells were treated with doxycycline for 0, 8, 16, or 24h. Cell lysates or mRNA was harvested and analyzed by immunoblotting (C) or qPCR (D), respectively. Protein levels of fibronectin, collagen I, αSMA, HA-ATF6α, BiP (positive control), or HSC70 (loading control) were measured by immunoblotting (n = 8), whereas qPCR assessed expression of FN1, COL1A1, COL1A2, and prolyl-4-hydroxylase (P4H) subunits P4HA2 and P4HB (n = 6 or 7). GAPDH served as a housekeeping gene for qPCR. Immunoblot quantification located in adjacent graphs. E and F: doxATF4 cells were treated with doxycycline for 0, 8, 16, or 24 h. Cells were lysed, and protein expression of fibronectin, collagen I, αSMA, ATF4, CHOP (positive control, band indicated by *), and HSC70 (loading control) was analyzed (E, n = 3). Quantification located in adjacent graphs. F: mRNA was also harvested and analyzed by qPCR for expression of FN1, COL1A1, and COL1A2. GAPDH served as a housekeeping gene. n represents biological replicates for each panel. Statistics were performed using one-way ANOVA followed by Tukey’s post hoc analysis (*P < 0.05, **P < 0.01, ***P < 0.001). ATF4, activating transcription factor 4; ATF6α, activating transcription factor 6α; αSMA, α smooth muscle actin; BiP, binding immunoglobulin protein; CHOP, C/EBP homologous protein; doxATF4, doxycycline-inducible ATF4; HSC, hepatic stellate cell; qPCR, quantitative PCR.
Figure 2.
Figure 2.
ATF6α is critical in HSC activation and fibrogenesis. A: schematic of ATF6α activation and nuclear translocation. B: doxATF6αp90 cells were pretreated with 6μM Ceapin-A7 for 1 h to inhibit ATF6α nuclear translocation, followed by doxycycline treatment (5μg/mL) for 16 h. Nuclear fractions were harvested and analyzed by immunoblotting to assess nuclear ATF6α. Histone-H3 served as a loading control. Quantification located in adjacent graph (n = 4). C–E: hHSCs were treated with Ceapin-A7 for 1 h, followed by TGFβ treatment for 24 h. C and D: cell lysates or mRNA was harvested, respectively, and HSC activation markers (fibronectin, collagen I, and αSMA) were analyzed by immunoblotting or qPCR. BiP/HSPA5 served as positive controls, HSC70 served as a loading control and GAPDH as a housekeeping gene for C and D, respectively. Quantification for C is located in the adjacent graphs. n = 6 for C and n = 5 for D. E: hHSCs treated with TGFβ (or vehicle) ± Ceapin-A7 were fixed and stained for αSMA. Three images were analyzed per biological replicate, and results are quantified in the adjacent graph (n = 4) Scale bar = 40 μm. F: hHSCs were treated with TGFβ (or vehicle) ± Ceapin-A7 for 24 h. Cell lysates were harvested and analyzed for CHOP by immunoblotting. HSC70 served as a loading control. Quantification located in adjacent graph (n = 3). G: hHSCs received TGFβ (or vehicle) ± Ceapin-A7 for 24 h followed by fixation and permeabilization. TUNEL staining was performed to identify cells undergoing death, along with a DAPI costain to identify total nuclei (n = 4). n represents biological replicates for each panel. Statistics for C–G were performed using one-way ANOVA followed by Tukey’s post hoc analysis. For B, paired t tests were performed. *P < 0.05, **P < 0.01, ***P < 0.001. ATF6α, activating transcription factor 6α; αSMA, α smooth muscle actin; BiP, binding immunoglobulin protein; CHOP, C/EBP homologous protein; HSC, hepatic stellate cell; qPCR, quantitative PCR; TGFβ, transforming growth factor β; TUNEL, terminal deoxynucleotidyl transferase dUTP nick end labeling.
Figure 3.
Figure 3.
ATF6α loss limits primary mHSC activation. Primary mHSCs were isolated from Atf6afl/fl mice and transfected with adenovirus-expressing Cre recombinase (AdCre) or a LacZ control. A: mHSCs were lysed 24h postisolation, and Atf6a expression was analyzed by qPCR. mActab (β-actin) served as a housekeeping gene (n = 5). B–D: mHSCs isolated from Atf6afl/fl mice were infected with adenovirus-expressing AdCre or LacZ. Forty-eight hours after infection, cells were treated with TGFβ or vehicle for 24 h. mRNA was harvested and analyzed by qPCR. B: HSC activation was assessed by measuring expression of Col1a1, Fn1, and Acta2 (n = 6–9). C: downstream targets of ATF6α (P4hb), IRE1α signaling (spliced Xbp1, Erdj4, EDEM, and Erp57), or PERK (Atf4 and Ddit3) were analyzed in TGFβ-treated Atf6aΔ/Δ HSCs by qPCR. mActab served as a housekeeping gene (n = 4 or 5). D: mRNA was reverse transcribed, and PCR was performed to amplify Xbp1 cDNA. The PCR product was digested using the restriction enzyme pst1, which digests unspliced XBP1 but cannot digest spliced Xbp1. mActab served as a housekeeping gene (n = 3). n represents biological replicates for each panel. For A, a paired t test was performed. Statistics for B and C were performed using one-way ANOVA followed by Tukey’s post hoc analysis (*P < 0.05, **P < 0.01, ***P < 0.001). ATF6α, activating transcription factor 6α; Ddit3, DNA damage-inducible transcript 3; Edem, ER degradation enhancer mannosidase α; Erdj4, endoplasmic reticulum–localized DnaJ 4; HSC, hepatic stellate cell; IRE1α, inositol-requiring enzyme 1α; mHSC, murine hepatic stellate cells; PERK, protein kinase RNA-like ER kinase; PCR, polymerase chain reaction; P4H, prolyl 4-hydroxylase; qPCR, quantitative PCR; TGFβ, transforming growth factor β; Xbp1, X-box-binding protein 1.
Figure 4.
Figure 4.
HSC-specific loss of ATF6α limits fibrosis in a BDL model. Age- and gender-matched Atf6afl/fl and Atf6afl/flPdgfrbCreERT2 littermate mice received tamoxifen injection (75 mg/kg, 5 consecutive days) to delete Atf6a from HSCs in PdgfrbCreERT2-expressing mice (Atf6aHSCΔ/Δ). A: mHSCs were isolated from Atf6afl/fl and Atf6aHSCΔ/Δ mice to confirm Atf6a deletion by qPCR (n = 4 biological replicates). mActab (β-actin) served as a housekeeping gene. B–E: mice underwent BDL surgery or a sham operation, and livers were harvested after 3 wk. n = 6–14 mice per group. Livers were analyzed by Sirius red staining (B), qPCR analysis of whole liver mRNA (C), immunoblotting of whole liver lysate (D), and IHC of paraffin-embedded tissue (E). mActab or HSC70 served as a loading control for qPCR or immunoblotting, respectively. Quantification of immunoblotting and IHC were performed using ImageJ and are reported as fold change in the graphs either below (D) or adjacent (E). Statistical analysis for A was performed using a paired t test, and one-way ANOVA followed by Tukey’s post hoc analysis was used for B–E (*P < 0.05, **P < 0.01, ***P < 0.001). ATF6α, activating transcription factor 6α; BDL, bile duct ligation; HSC, hepatic stellate cell; IHC, immunohistochemistry; IRE1α, inositol-requiring enzyme 1α; mHSC, murine hepatic stellate cell; qPCR, quantitative PCR.
Figure 5.
Figure 5.
Loss of IRE1α limits fibrotic gene expression but fails to reduce fibrogenesis. Ire1afl/fl or Ire1afl/flPdgfrβCreERT2 mice received tamoxifen injection for 5 consecutive days to promote recombination of Ire1a in HSCs of PdgfrbCreERT2-expressing mice to yield Ire1afl/fl and Ire1aHSCΔ/Δ mice. A: mHSCs were isolated from these mice to confirm Ire1a loss using immunoblotting (n = 3 biological replicates). HSC70 served as a loading control. Quantification located below. B–E: age- and gender-matched Ire1afl/fl and Ire1aHSCΔ/Δ mice underwent BDL or a sham surgery (n = 5–10 mice per group) and livers were harvested 3 wk postsurgery. B: Sirius red staining was performed on paraffin-embedded tissues. Percent area of Sirius red staining was quantified using ImageJ and presented in the adjacent graph. Scale bar = 50 μm. C: mRNA was harvested from whole tissue and analyzed by qPCR for Col1a1, Fn1, and Acta2. mActab served as a housekeeping gene. D: whole liver lysates were separated by SDS-PAGE and immunoblotted for αSMA, or HSC70 (loading control). Densitometry was performed by ImageJ and is quantified in the graphs below. n = 3 mice/treatment group. E: IHC was performed on paraffin-embedded sections using an antibody against desmin to mark total HSCs. Stained tissue was quantified using ImageJ and fold change is presented in the adjacent graphs. Scale bar = 50 μm. F: mHSCs were isolated from Ire1afl/fl mice and infected with adenovirus-expressing Cre recombinase (AdCre) or LacZ (as a control). Forty-eight hours after infection, mRNA was harvested and analyzed by qPCR. mActab served as a control. n = 5 biological replicates. Statistics for A and F were performed using a paired t test, and one-way ANOVA followed by Tukey’s post hoc analysis was used for B–E (*P < 0.05, ***P < 0.001). αSMA, α smooth muscle actin; BDL, bile duct ligation; HSC, hepatic stellate cell; IHC, immunohistochemistry; IRE1α, inositol-requiring enzyme 1α; mHSCs, murine hepatic stellate cells; qPCR, quantitative PCR.
Figure 6.
Figure 6.
HSC-specific loss of ATF6α/IRE1α exacerbates fibrosis in a BDL model. Age- and gender-matched Atf6afl/flIre1afl/fl and Atf6afl/flIre1afl/flPdgrfbCreERT2 littermates received tamoxifen injections (75 mg/kg, 5 consecutive days) to delete Atf6a and Ire1a from HSCs in PdgfrbCreERT2-expressing mice (Atf6aHSCΔ/ΔIre1aHSCΔ/Δ). n = 4–13 mice per group. Mice underwent BDL surgery or a sham operation, and livers were harvested after 3 wk. Livers were analyzed by Sirius red staining (A), qPCR analysis of whole liver mRNA (B), immunoblotting of whole liver lysate (C), and IHC of paraffin-embedded tissue (D). mActab (β-actin) or HSC70 served as a loading control for qPCR or immunoblotting, respectively. Quantification is located in graphs below (C) or adjacent (D). Scale bars for A and D = 50 μm. E: mHSCs were isolated from Atf6afl/flIre1afl/fl or Atf6aHSCΔ/ΔIre1aHSCΔ/Δ mice, and gene expression of Col1a1, Fn1, or Acta2 was analyzed by qPCR. mActab served as a housekeeping gene. n = 4 biological replicates. Statistics were performed using one-way ANOVA followed by Tukey’s post hoc analysis (*P < 0.05, **P < 0.01, ***P < 0.001) or Student’s t test (E). ATF6α, activating transcription factor 6α; BDL, bile duct ligation; HSC, hepatic stellate cell; IHC, immunohistochemistry; IRE1α, inositol-requiring enzyme 1α; mHSC, murine hepatic stellate cell; qPCR, quantitative PCR; TGFβ, transforming growth factor β.

Similar articles

Cited by

References

    1. Berumen J, Baglieri J, Kisseleva T, Mekeel K. Liver fibrosis: pathophysiology and clinical implications. Wiley Interdiscip Rev Syst Biol Med 13: e1499, 2021. - PMC - PubMed
    1. Pellicoro A, Ramachandran P, Iredale JP, Fallowfield JA. Liver fibrosis and repair: immune regulation of wound healing in a solid organ. Nat Rev Immunol 14: 181–194, 2014. doi:10.1038/nri3623. - DOI - PubMed
    1. Hernandez-Gea V, Friedman SL. Pathogenesis of liver fibrosis. Annu Rev Pathol 6: 425–456, 2011. doi:10.1146/annurev-pathol-011110-130246. - DOI - PubMed
    1. Iwaisako K, Jiang C, Zhang M, Cong M, Moore-Morris TJ, Park TJ, Liu X, Xu J, Wang P, Paik YH, Meng F, Asagiri M, Murray LA, Hofmann AF, Iida T, Glass CK, Brenner DA, Kisseleva T. Origin of myofibroblasts in the fibrotic liver in mice. Proc Natl Acad Sci USA 111: E3297–E3305, 2014. doi:10.1073/pnas.1400062111. - DOI - PMC - PubMed
    1. Kisseleva T. The origin of fibrogenic myofibroblasts in fibrotic liver. Hepatology 65: 1039–1043, 2017. doi:10.1002/hep.28948. - DOI - PMC - PubMed

Publication types

MeSH terms

Substances

LinkOut - more resources