

Neighborhood Disadvantage Measures and COVID-19 Cases in Boston, 2020
- PMID: 33729070
- PMCID: PMC8580391
- DOI: 10.1177/00333549211002837
Neighborhood Disadvantage Measures and COVID-19 Cases in Boston, 2020
Abstract
Objective: Understanding the pattern of population risk for coronavirus disease 2019 (COVID-19) is critically important for health systems and policy makers. The objective of this study was to describe the association between neighborhood factors and number of COVID-19 cases. We hypothesized an association between disadvantaged neighborhoods and clusters of COVID-19 cases.
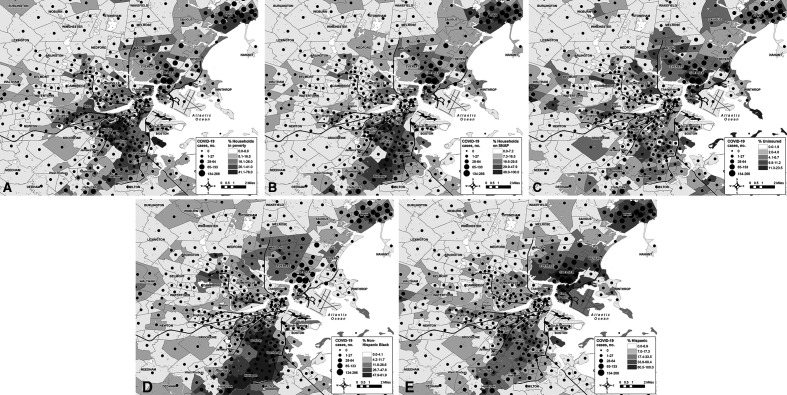
Methods: We analyzed data on patients presenting to a large health care system in Boston during February 5-May 4, 2020. We used a bivariate local join-count procedure to determine colocation between census tracts with high rates of neighborhood demographic characteristics (eg, Hispanic race/ethnicity) and measures of disadvantage (eg, health insurance status) and COVID-19 cases. We used negative binomial models to assess independent associations between neighborhood factors and the incidence of COVID-19.
Results: A total of 9898 COVID-19 patients were in the cohort. The overall crude incidence in the study area was 32 cases per 10 000 population, and the adjusted incidence per census tract ranged from 2 to 405 per 10 000 population. We found significant colocation of several neighborhood factors and the top quintile of cases: percentage of population that was Hispanic, non-Hispanic Black, without health insurance, receiving Supplemental Nutrition Assistance Program benefits, and living in poverty. Factors associated with increased incidence of COVID-19 included percentage of population that is Hispanic (incidence rate ratio [IRR] = 1.25; 95% CI, 1.23-1.28) and percentage of households living in poverty (IRR = 1.25; 95% CI, 1.19-1.32).
Conclusions: We found a significant association between neighborhoods with high rates of disadvantage and COVID-19. Policy makers need to consider these health inequities when responding to the pandemic and planning for subsequent health needs.
Keywords: COVID-19; geospatial analysis; social determinants of health.
Conflict of interest statement
Figures

Similar articles
-
Race, Ethnicity, Neighborhood Characteristics, and In-Hospital Coronavirus Disease-2019 Mortality.Med Care. 2021 Oct 1;59(10):888-892. doi: 10.1097/MLR.0000000000001624. Med Care. 2021. PMID: 34334737 Free PMC article.
-
Time-varying associations between COVID-19 case incidence and community-level sociodemographic, occupational, environmental, and mobility risk factors in Massachusetts.BMC Infect Dis. 2021 Jul 16;21(1):686. doi: 10.1186/s12879-021-06389-w. BMC Infect Dis. 2021. PMID: 34271870 Free PMC article.
-
Racial and Neighborhood-Level Disparities in COVID-19 Incidence among Patients on Hemodialysis in New York City.J Am Soc Nephrol. 2021 Aug;32(8):2048-2056. doi: 10.1681/ASN.2020111606. Epub 2021 Jun 3. J Am Soc Nephrol. 2021. PMID: 34083409 Free PMC article.
-
Neighborhood Ecologies, Cases, and Deaths during the Beginning of the COVID-19 Pandemic: Lessons for Current and Future Epidemics?South Med J. 2024 Nov;117(11):640-645. doi: 10.14423/SMJ.0000000000001757. South Med J. 2024. PMID: 39486448
-
The role of neighborhood characteristics in racial/ethnic disparities in type 2 diabetes: results from the Boston Area Community Health (BACH) Survey.Soc Sci Med. 2015 Apr;130:79-90. doi: 10.1016/j.socscimed.2015.01.041. Epub 2015 Feb 4. Soc Sci Med. 2015. PMID: 25687243 Free PMC article.
Cited by
-
Supplemental Nutrition Assistance Program Education reductions during COVID-19 may have exacerbated health inequities.SSM Popul Health. 2023 Jul 23;23:101471. doi: 10.1016/j.ssmph.2023.101471. eCollection 2023 Sep. SSM Popul Health. 2023. PMID: 37560088 Free PMC article.
-
Multimorbidity and social determinants of health in the US prior to the COVID-19 pandemic and implications for health outcomes: a cross-sectional analysis based on NHANES 2017-2018.BMC Public Health. 2023 May 15;23(1):887. doi: 10.1186/s12889-023-15768-8. BMC Public Health. 2023. PMID: 37189096 Free PMC article.
-
Associations of Individual and Neighborhood Factors with Disparities in COVID-19 Incidence and Outcomes.West J Emerg Med. 2025 Mar;26(2):315-325. doi: 10.5811/westjem.18526. West J Emerg Med. 2025. PMID: 40145927 Free PMC article.
-
The impact of historical redlining policies on community composition and the COVID-19 pandemic in Boston.PLoS One. 2025 Jun 18;20(6):e0324020. doi: 10.1371/journal.pone.0324020. eCollection 2025. PLoS One. 2025. PMID: 40531809 Free PMC article.
-
Area-Level Social Vulnerability and Severe COVID-19: A Case-Control Study Using Electronic Health Records from Multiple Health Systems in the Southeastern Pennsylvania Region.J Urban Health. 2024 Aug;101(4):845-855. doi: 10.1007/s11524-024-00876-6. Epub 2024 May 13. J Urban Health. 2024. PMID: 38740710 Free PMC article.
References
-
- Center for Systems Science and Engineering . COVID-19 dashboard. Accessed April 11, 2020. https://gisanddata.maps.arcgis.com/apps/opsdashboard/index.html#/bda7594...
Publication types
MeSH terms
Grants and funding
LinkOut - more resources
Full Text Sources
Other Literature Sources
Medical
