. 2021 Jun;42(3):252-265.
doi: 10.1080/13816810.2021.1888132. Epub 2021 Mar 17.

Bardet-Biedl syndrome-7 (BBS7) shows treatment potential and a cone-rod dystrophy phenotype that recapitulates the non-human primate model

Affiliations

Bardet-Biedl syndrome-7 (BBS7) shows treatment potential and a cone-rod dystrophy phenotype that recapitulates the non-human primate model

Tomas S Aleman et al. Ophthalmic Genet. 2021 Jun.

Abstract

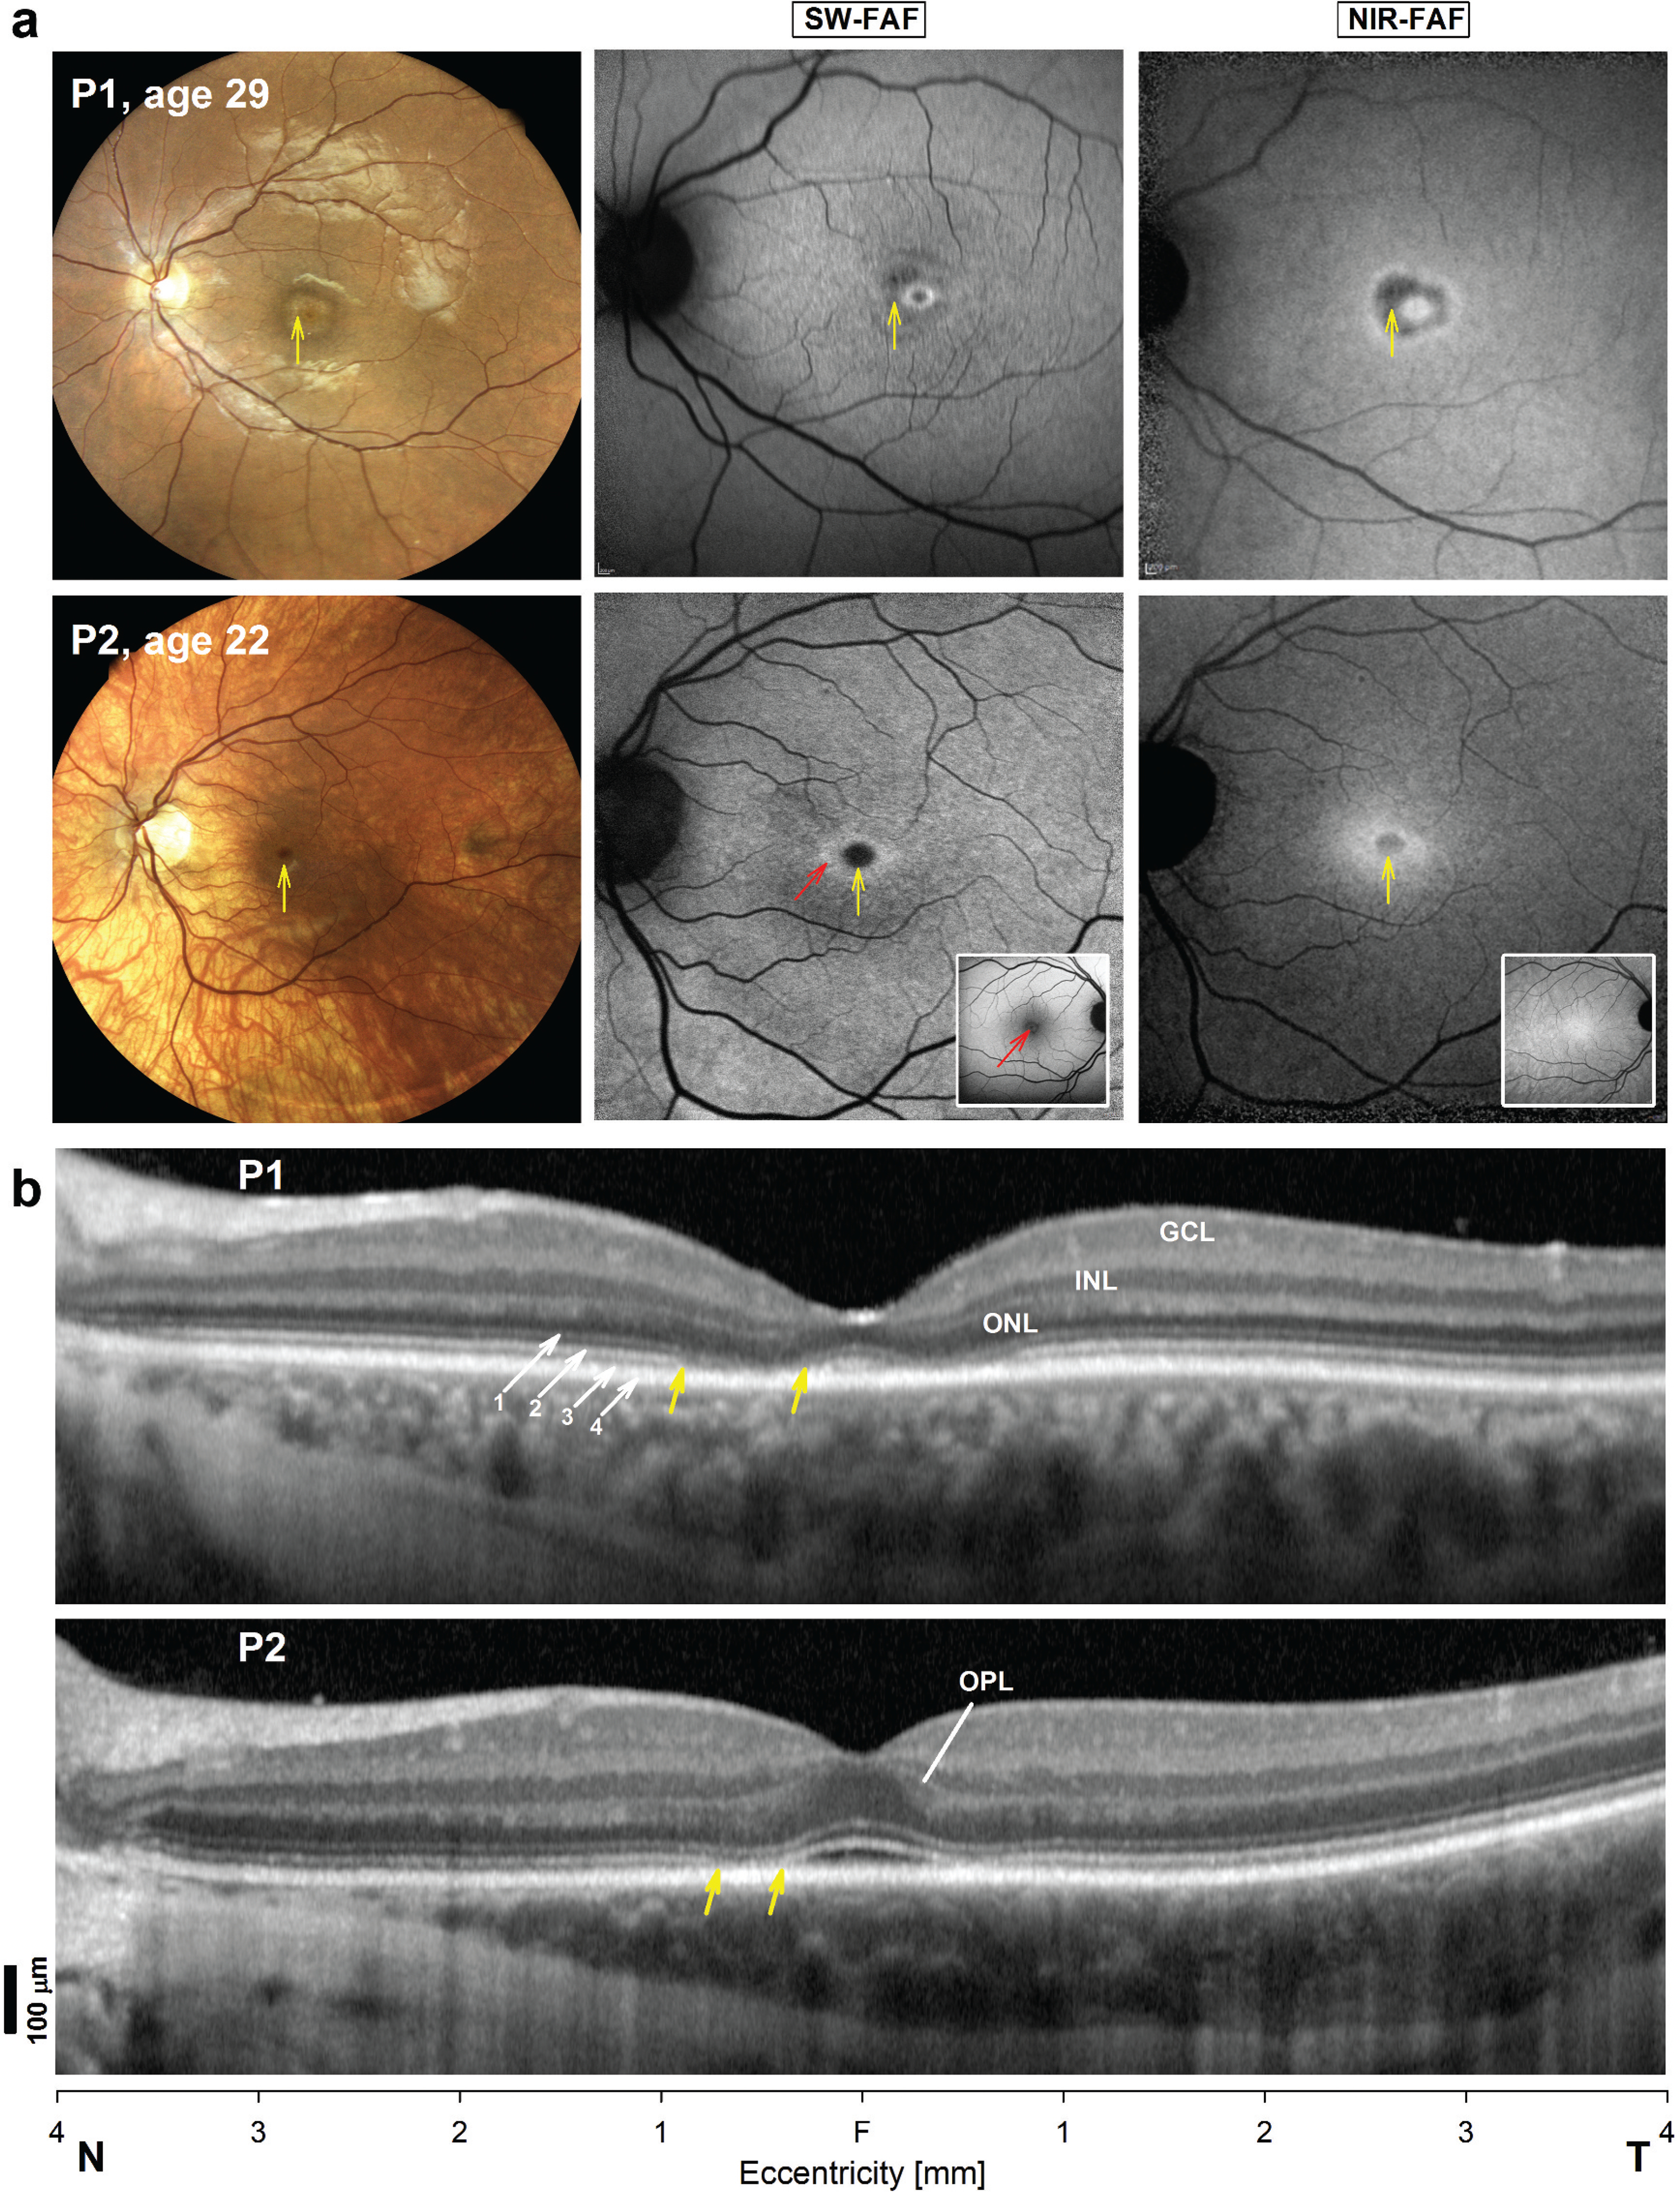
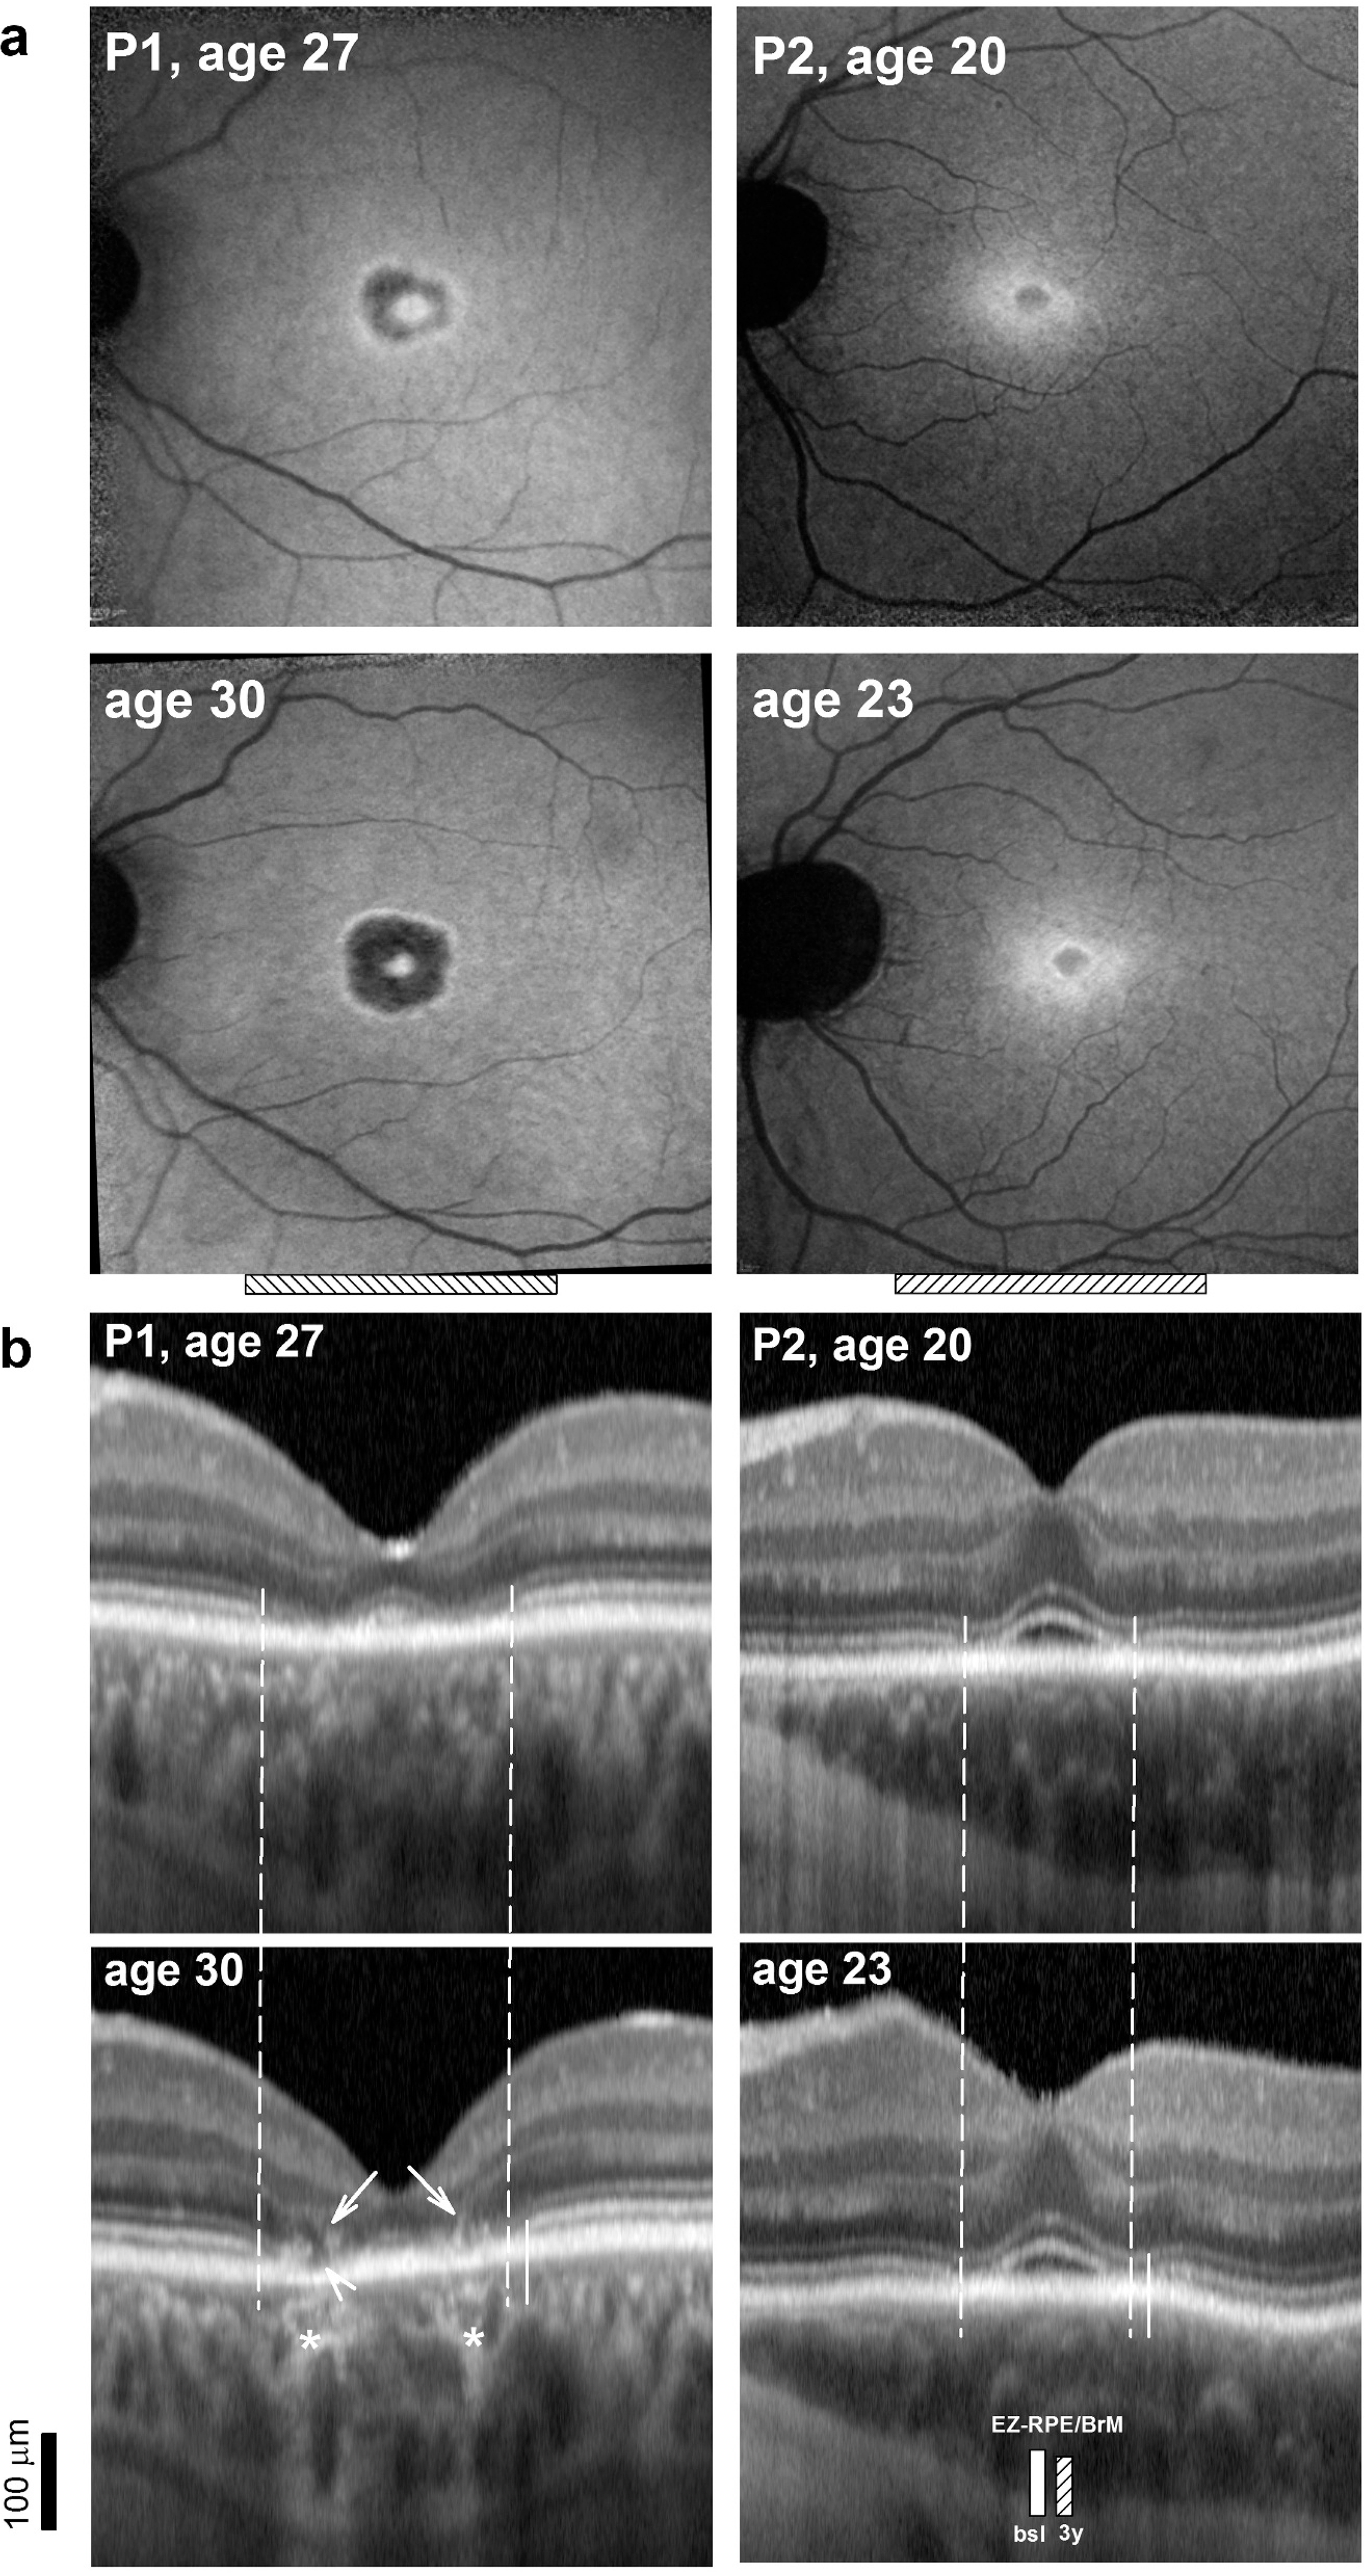
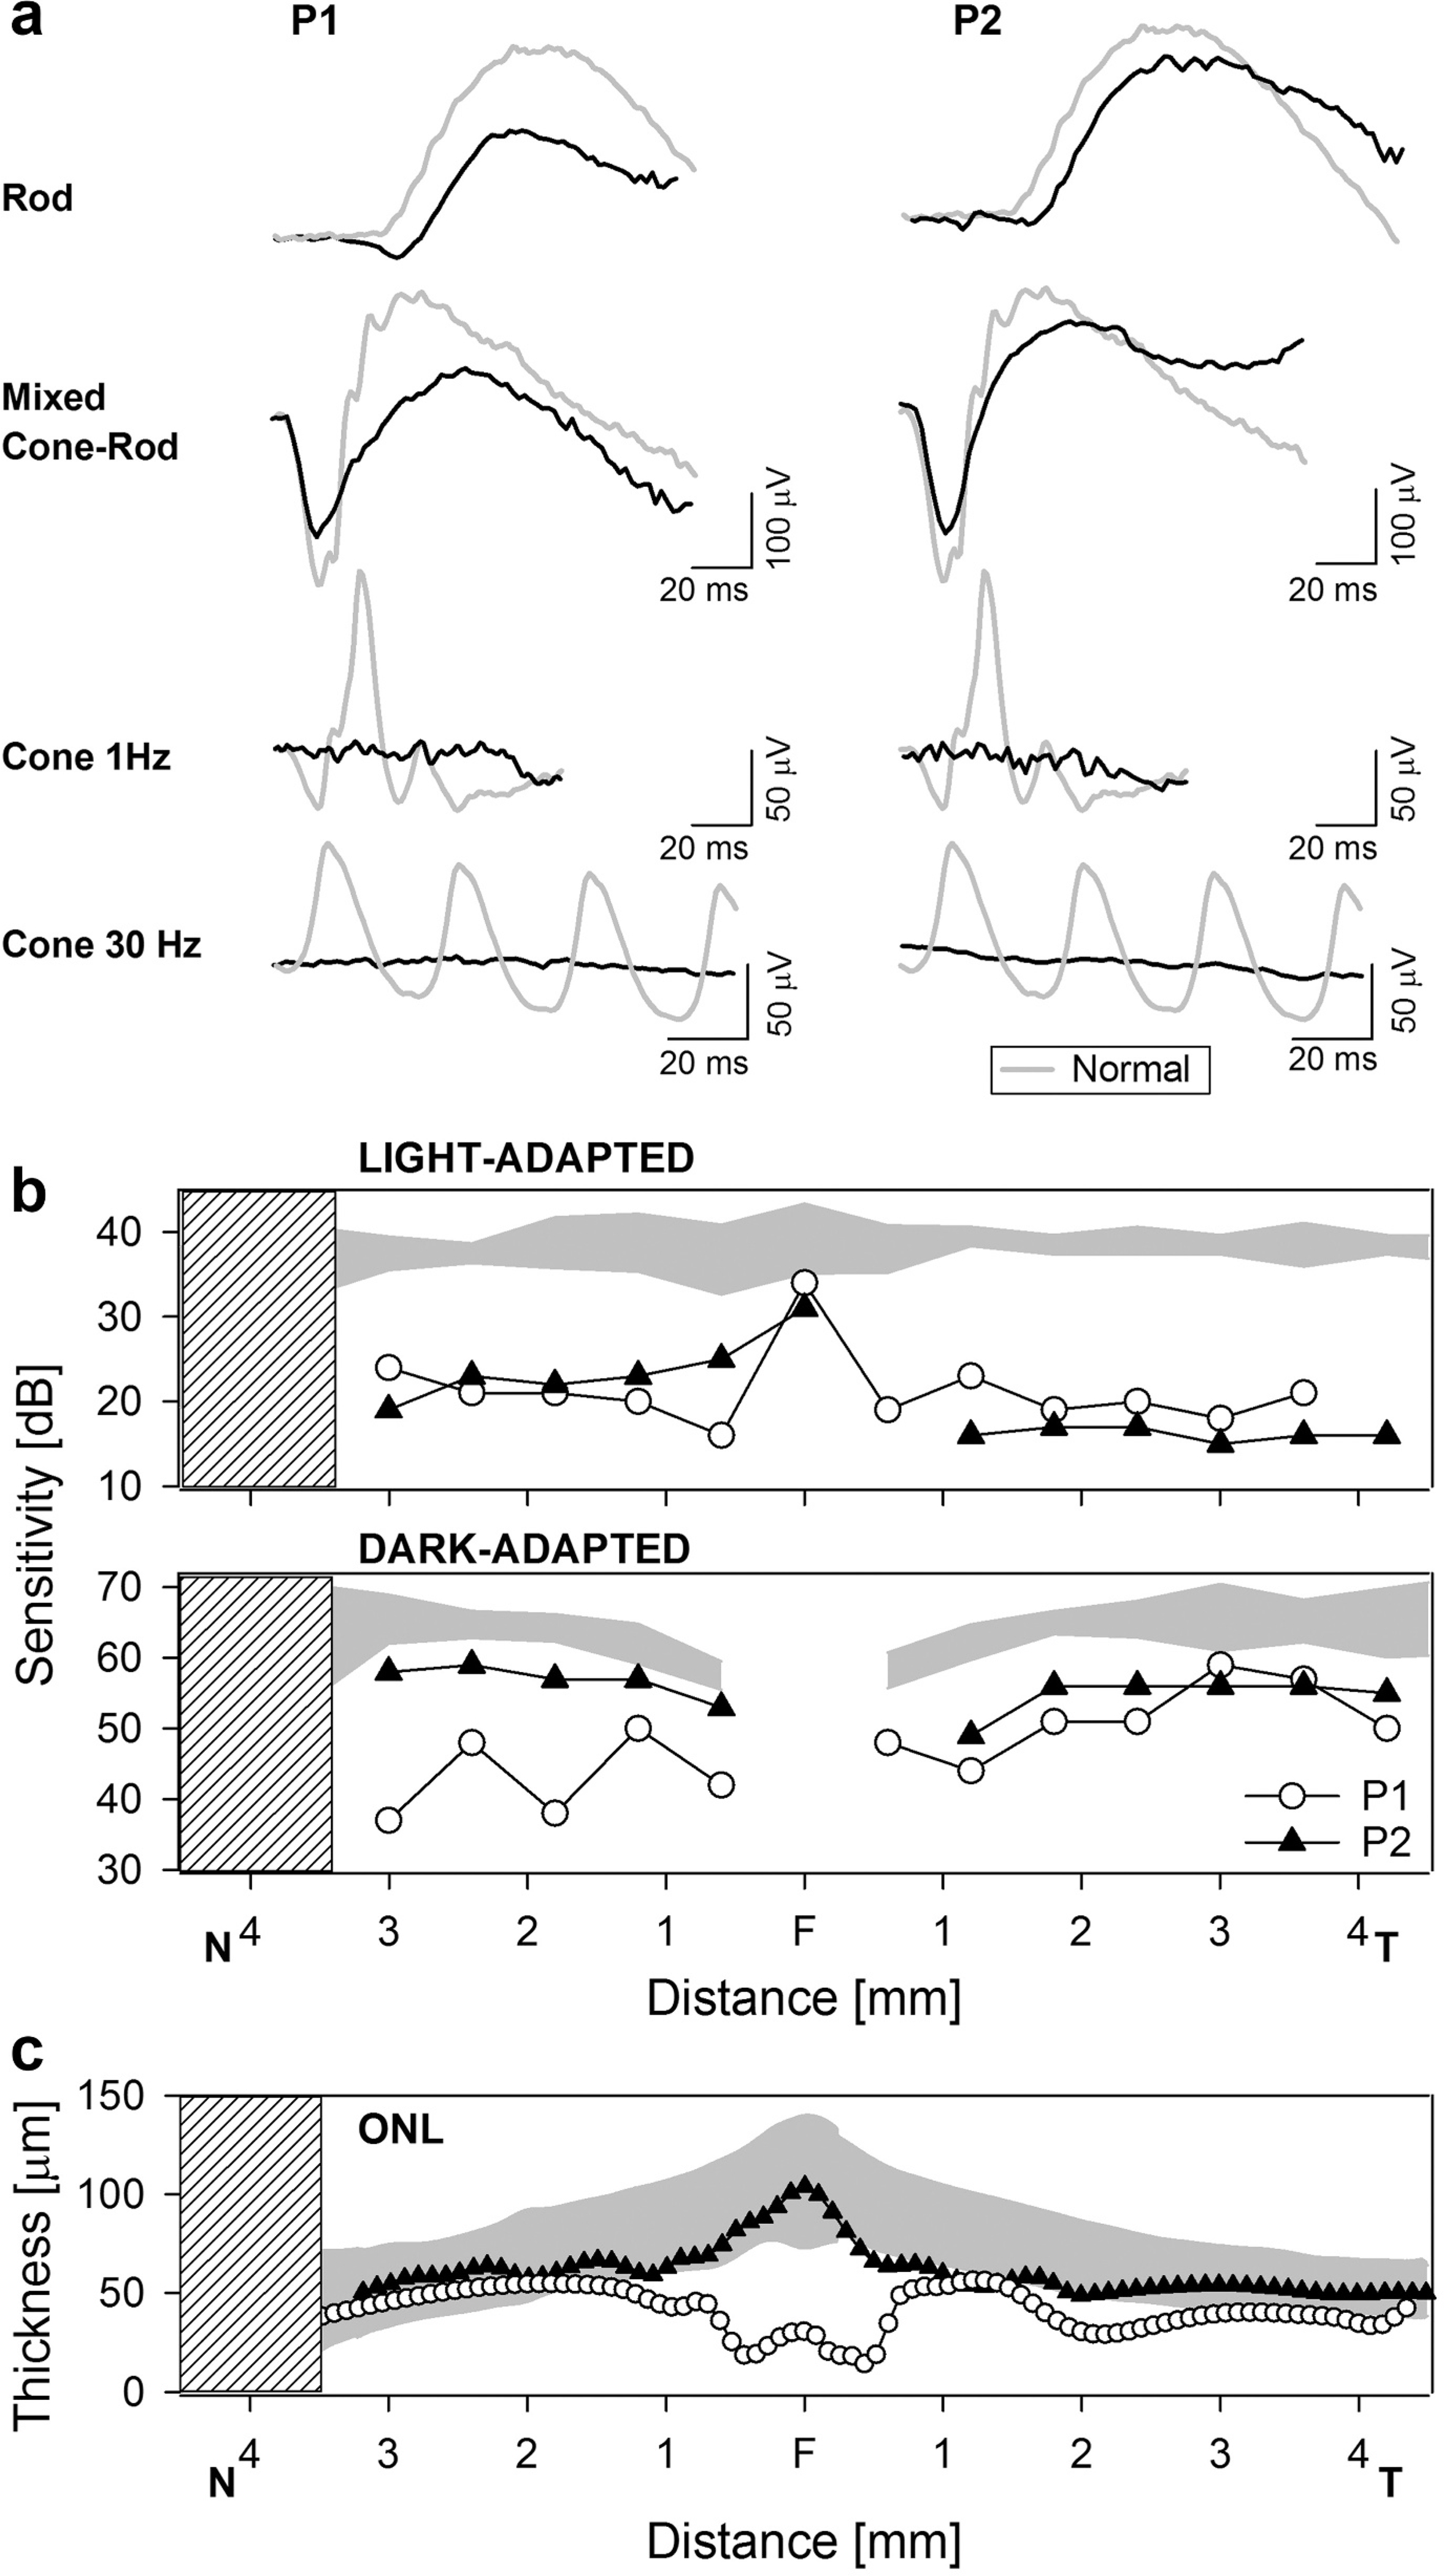
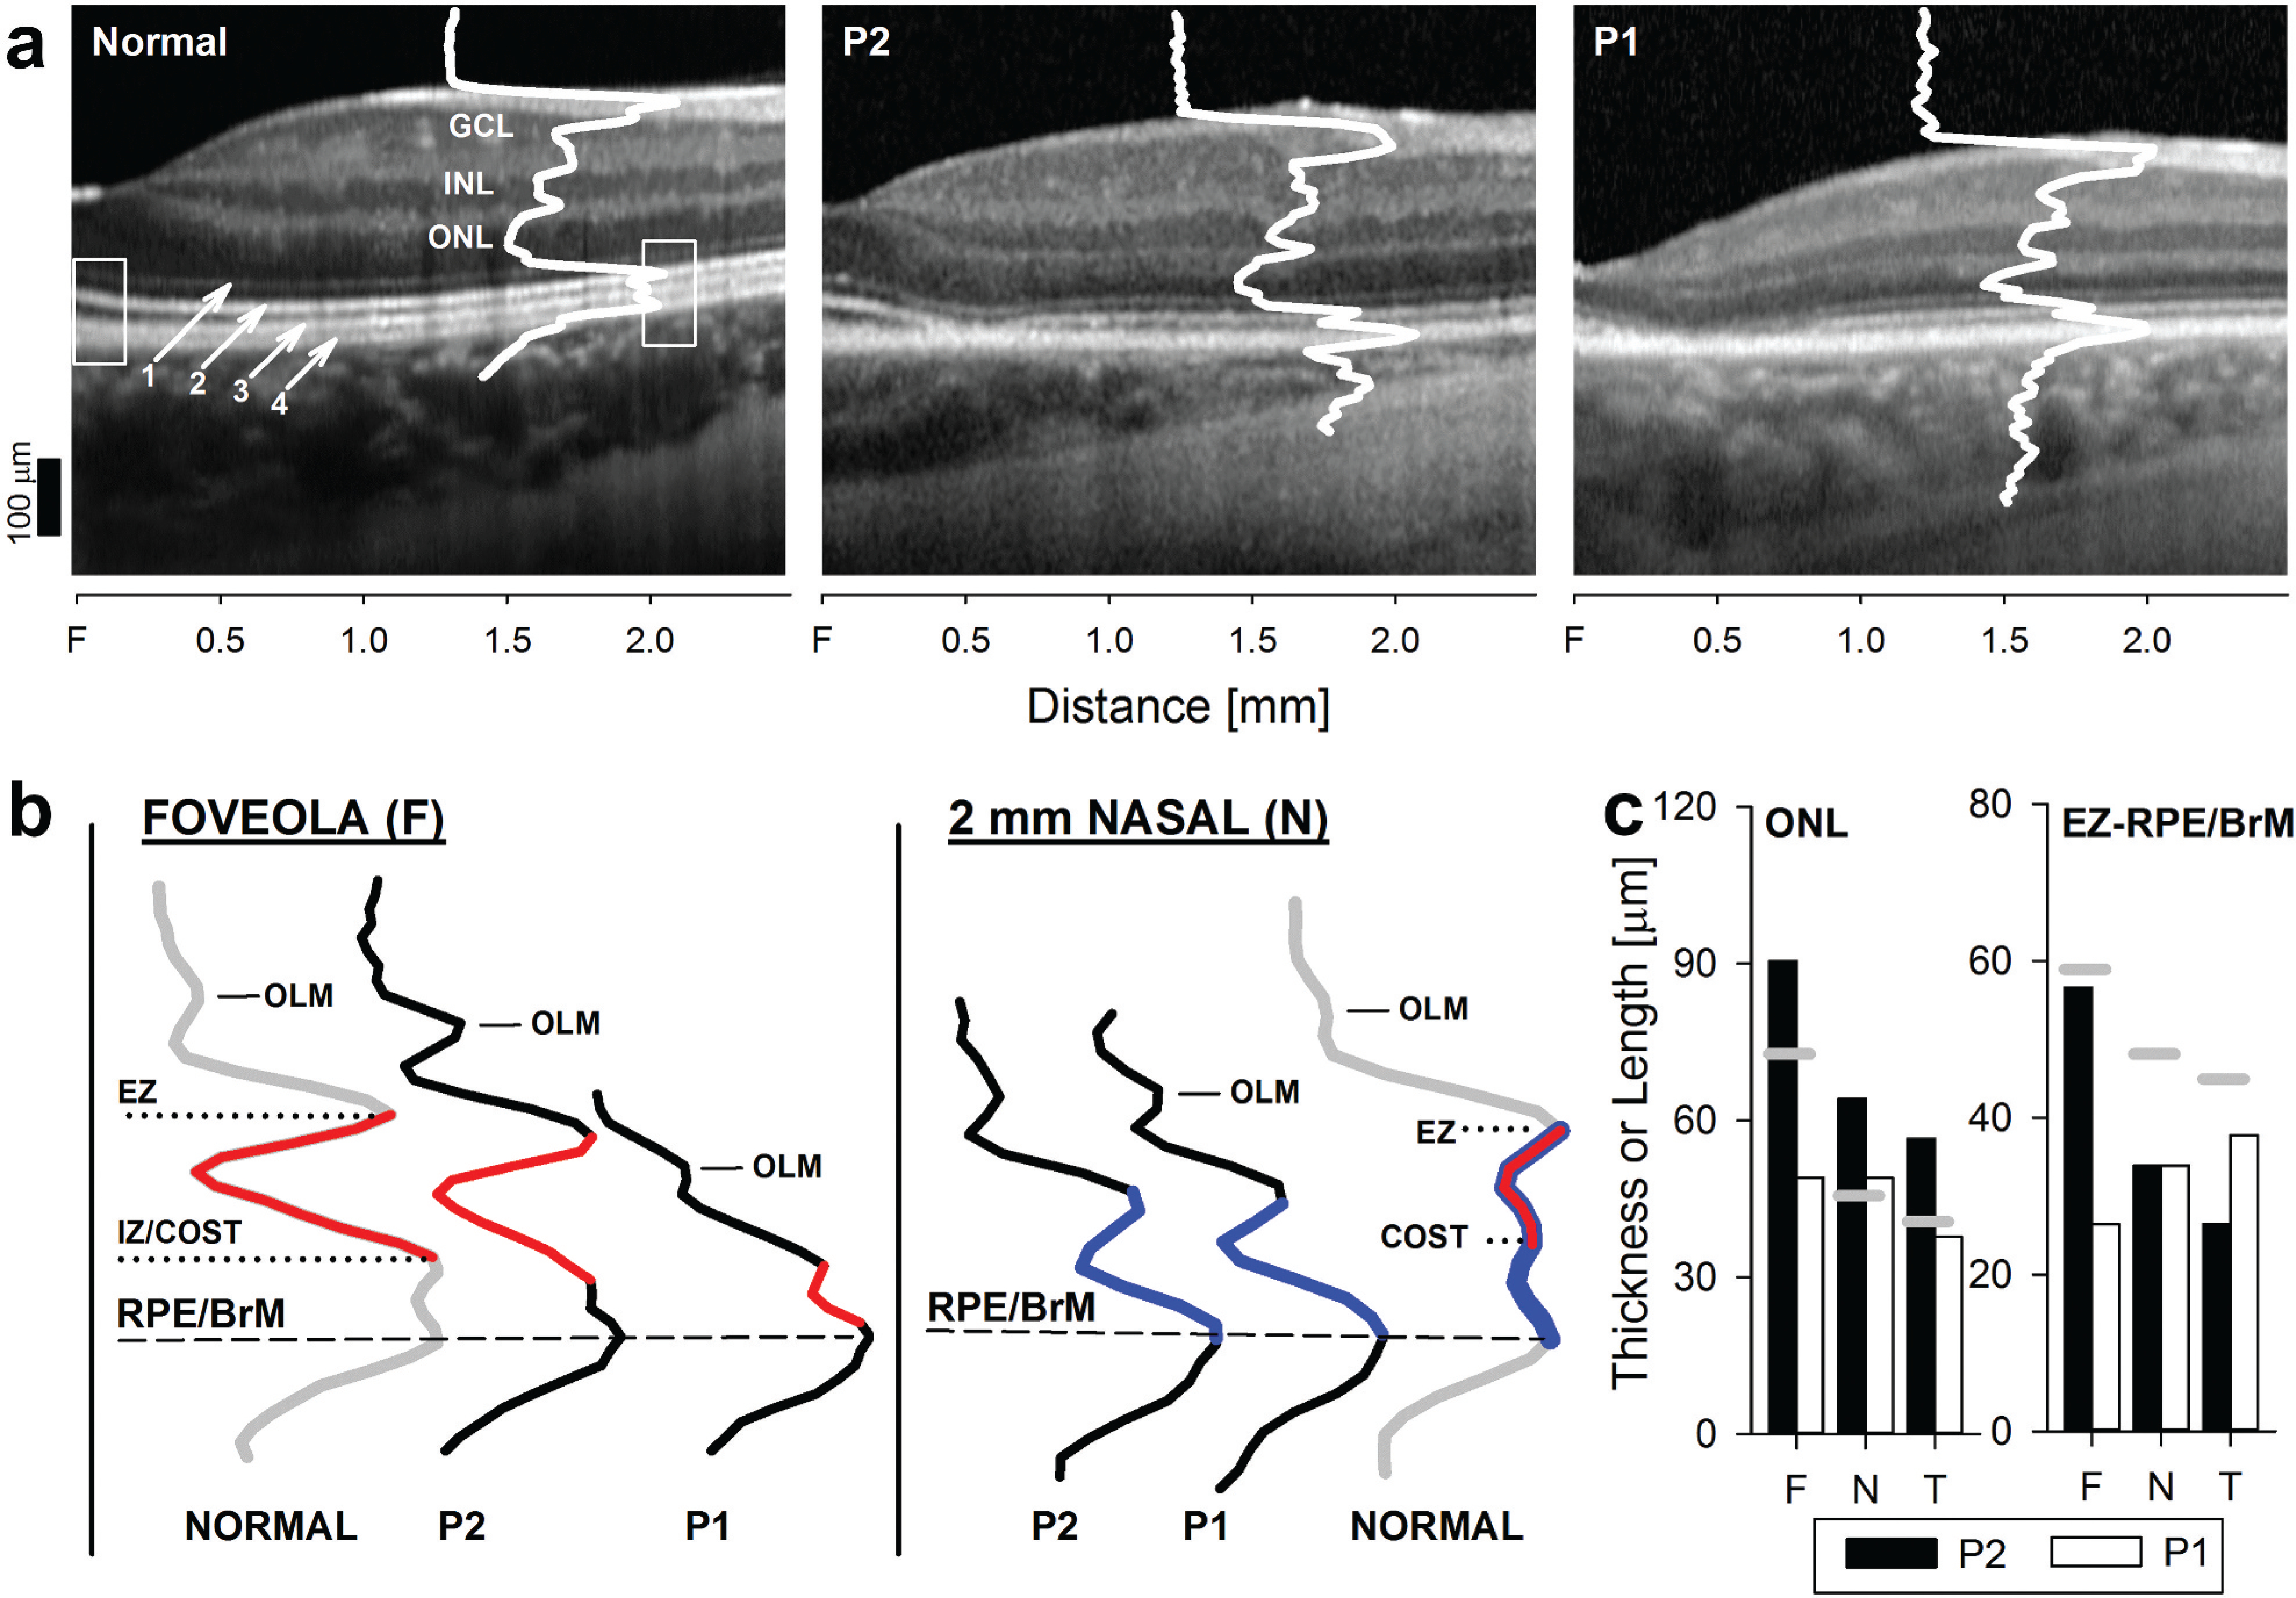
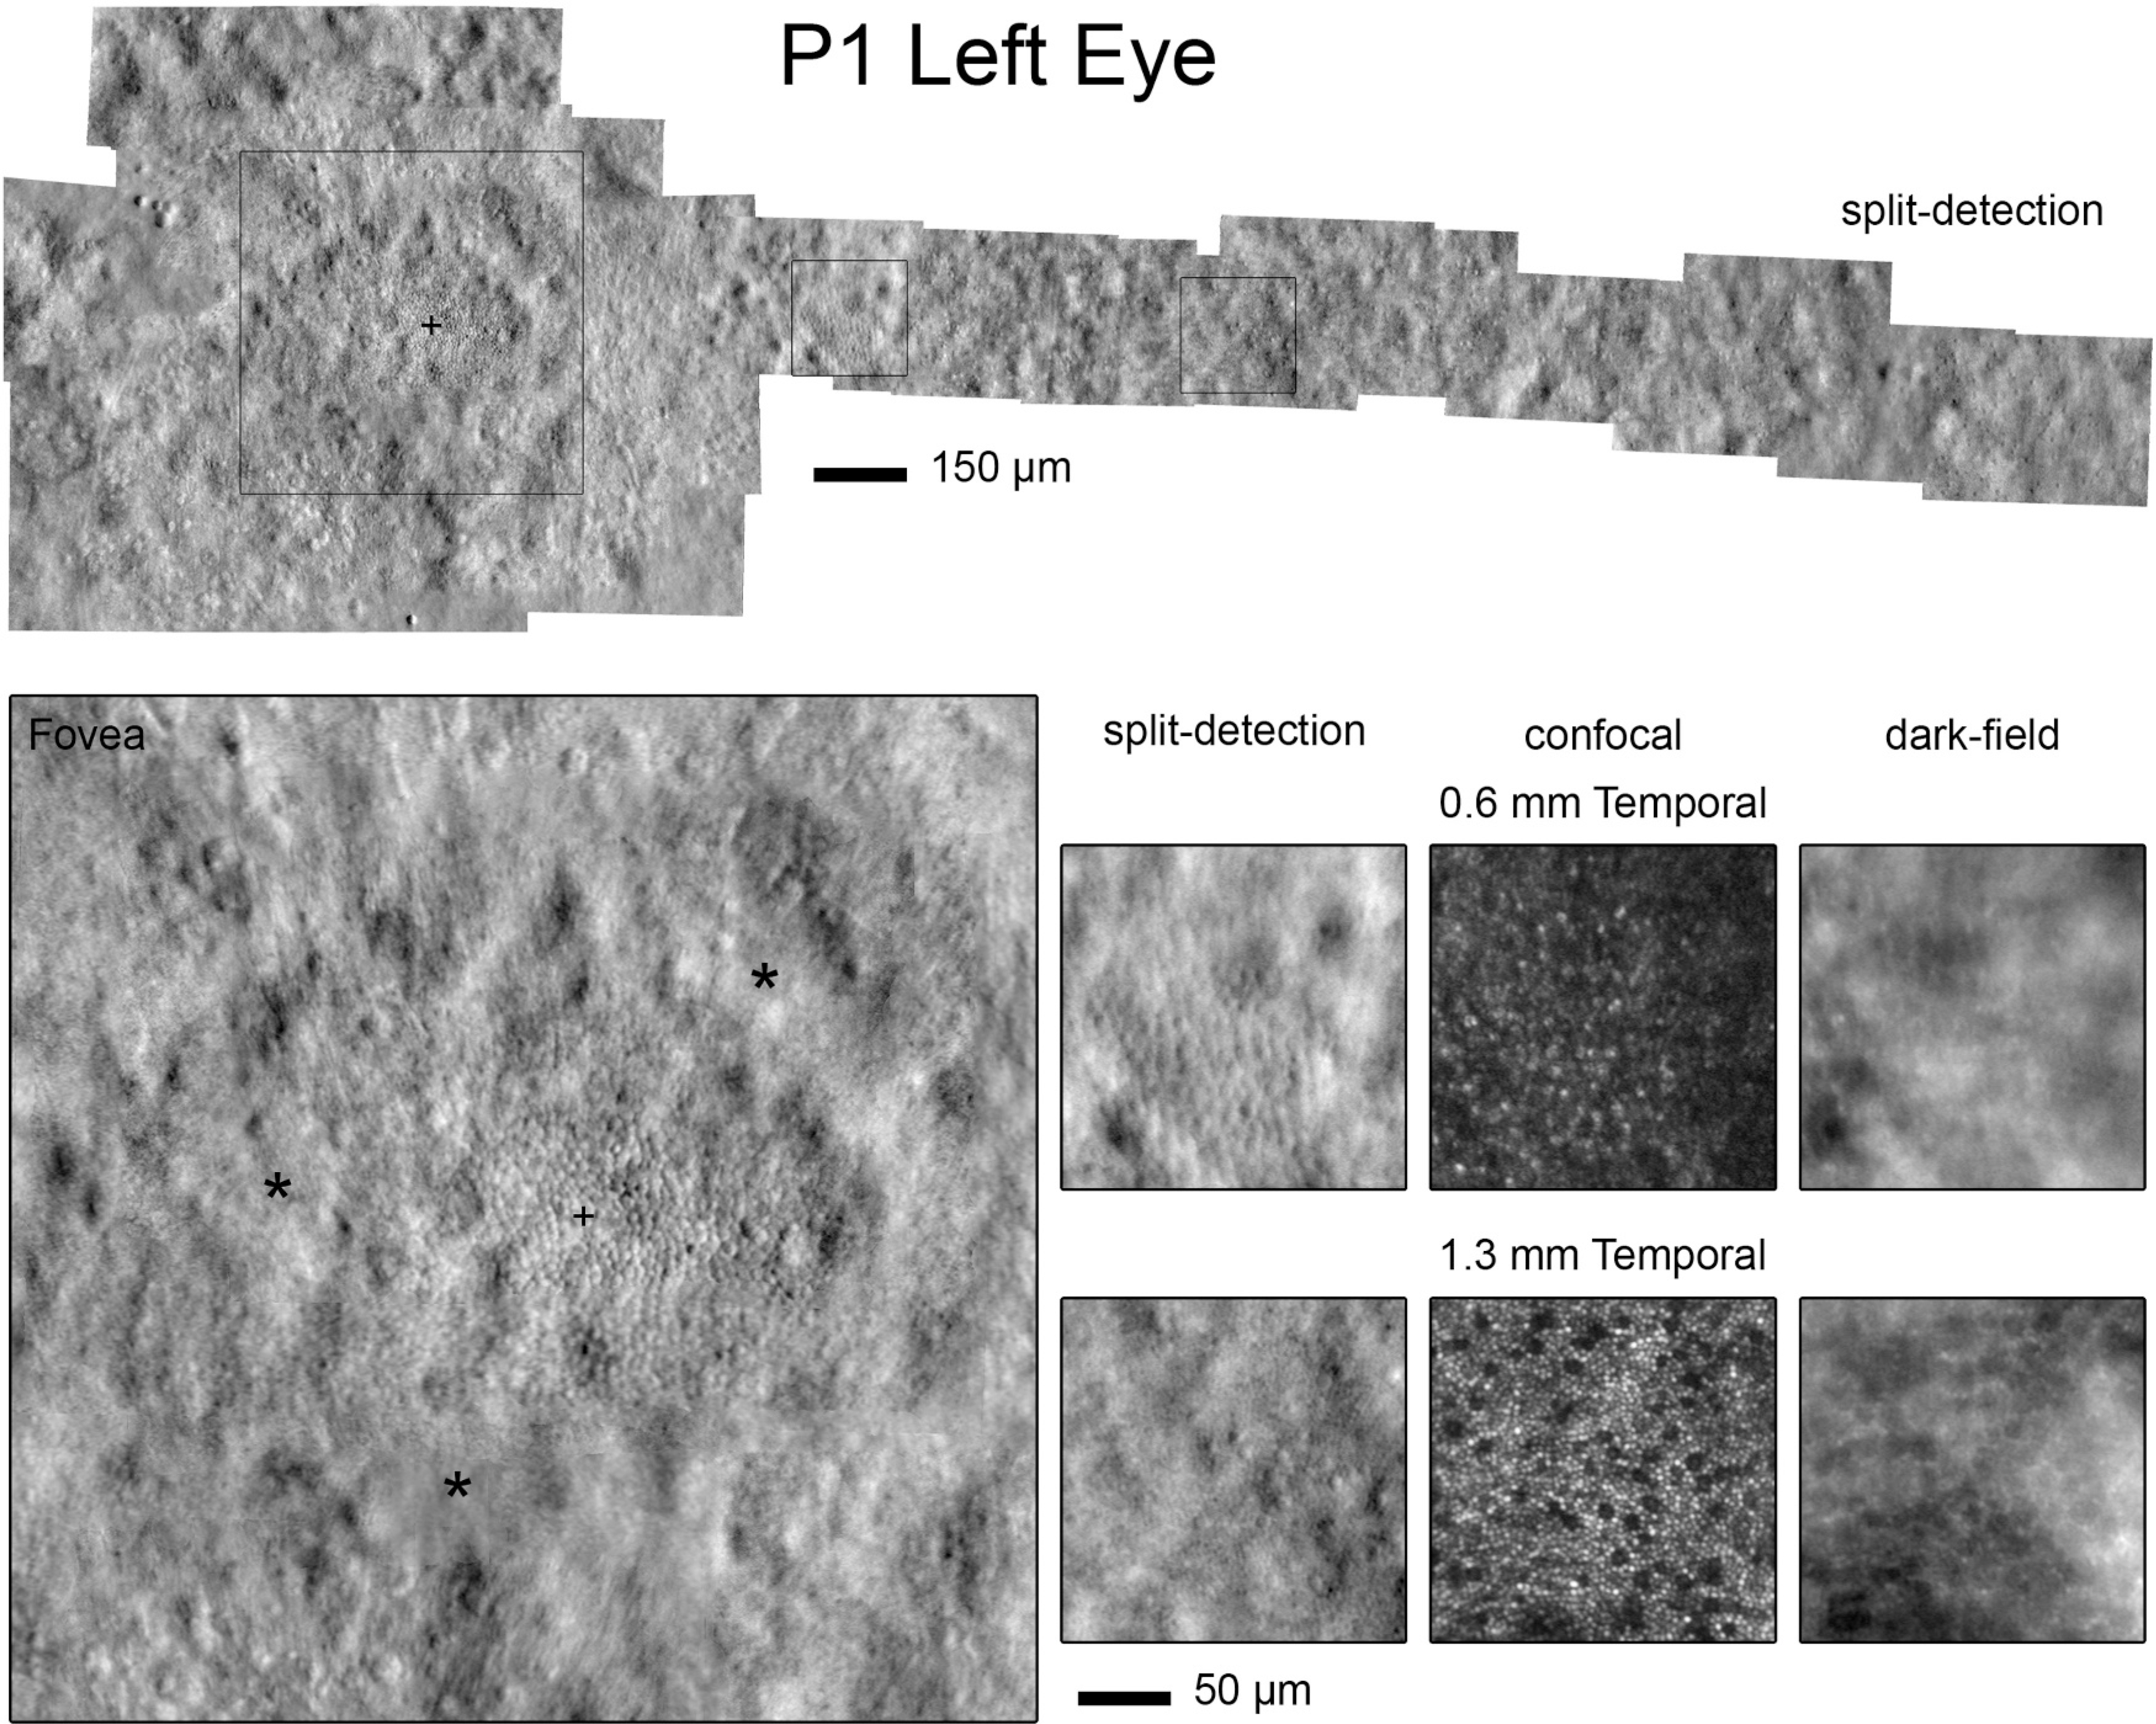
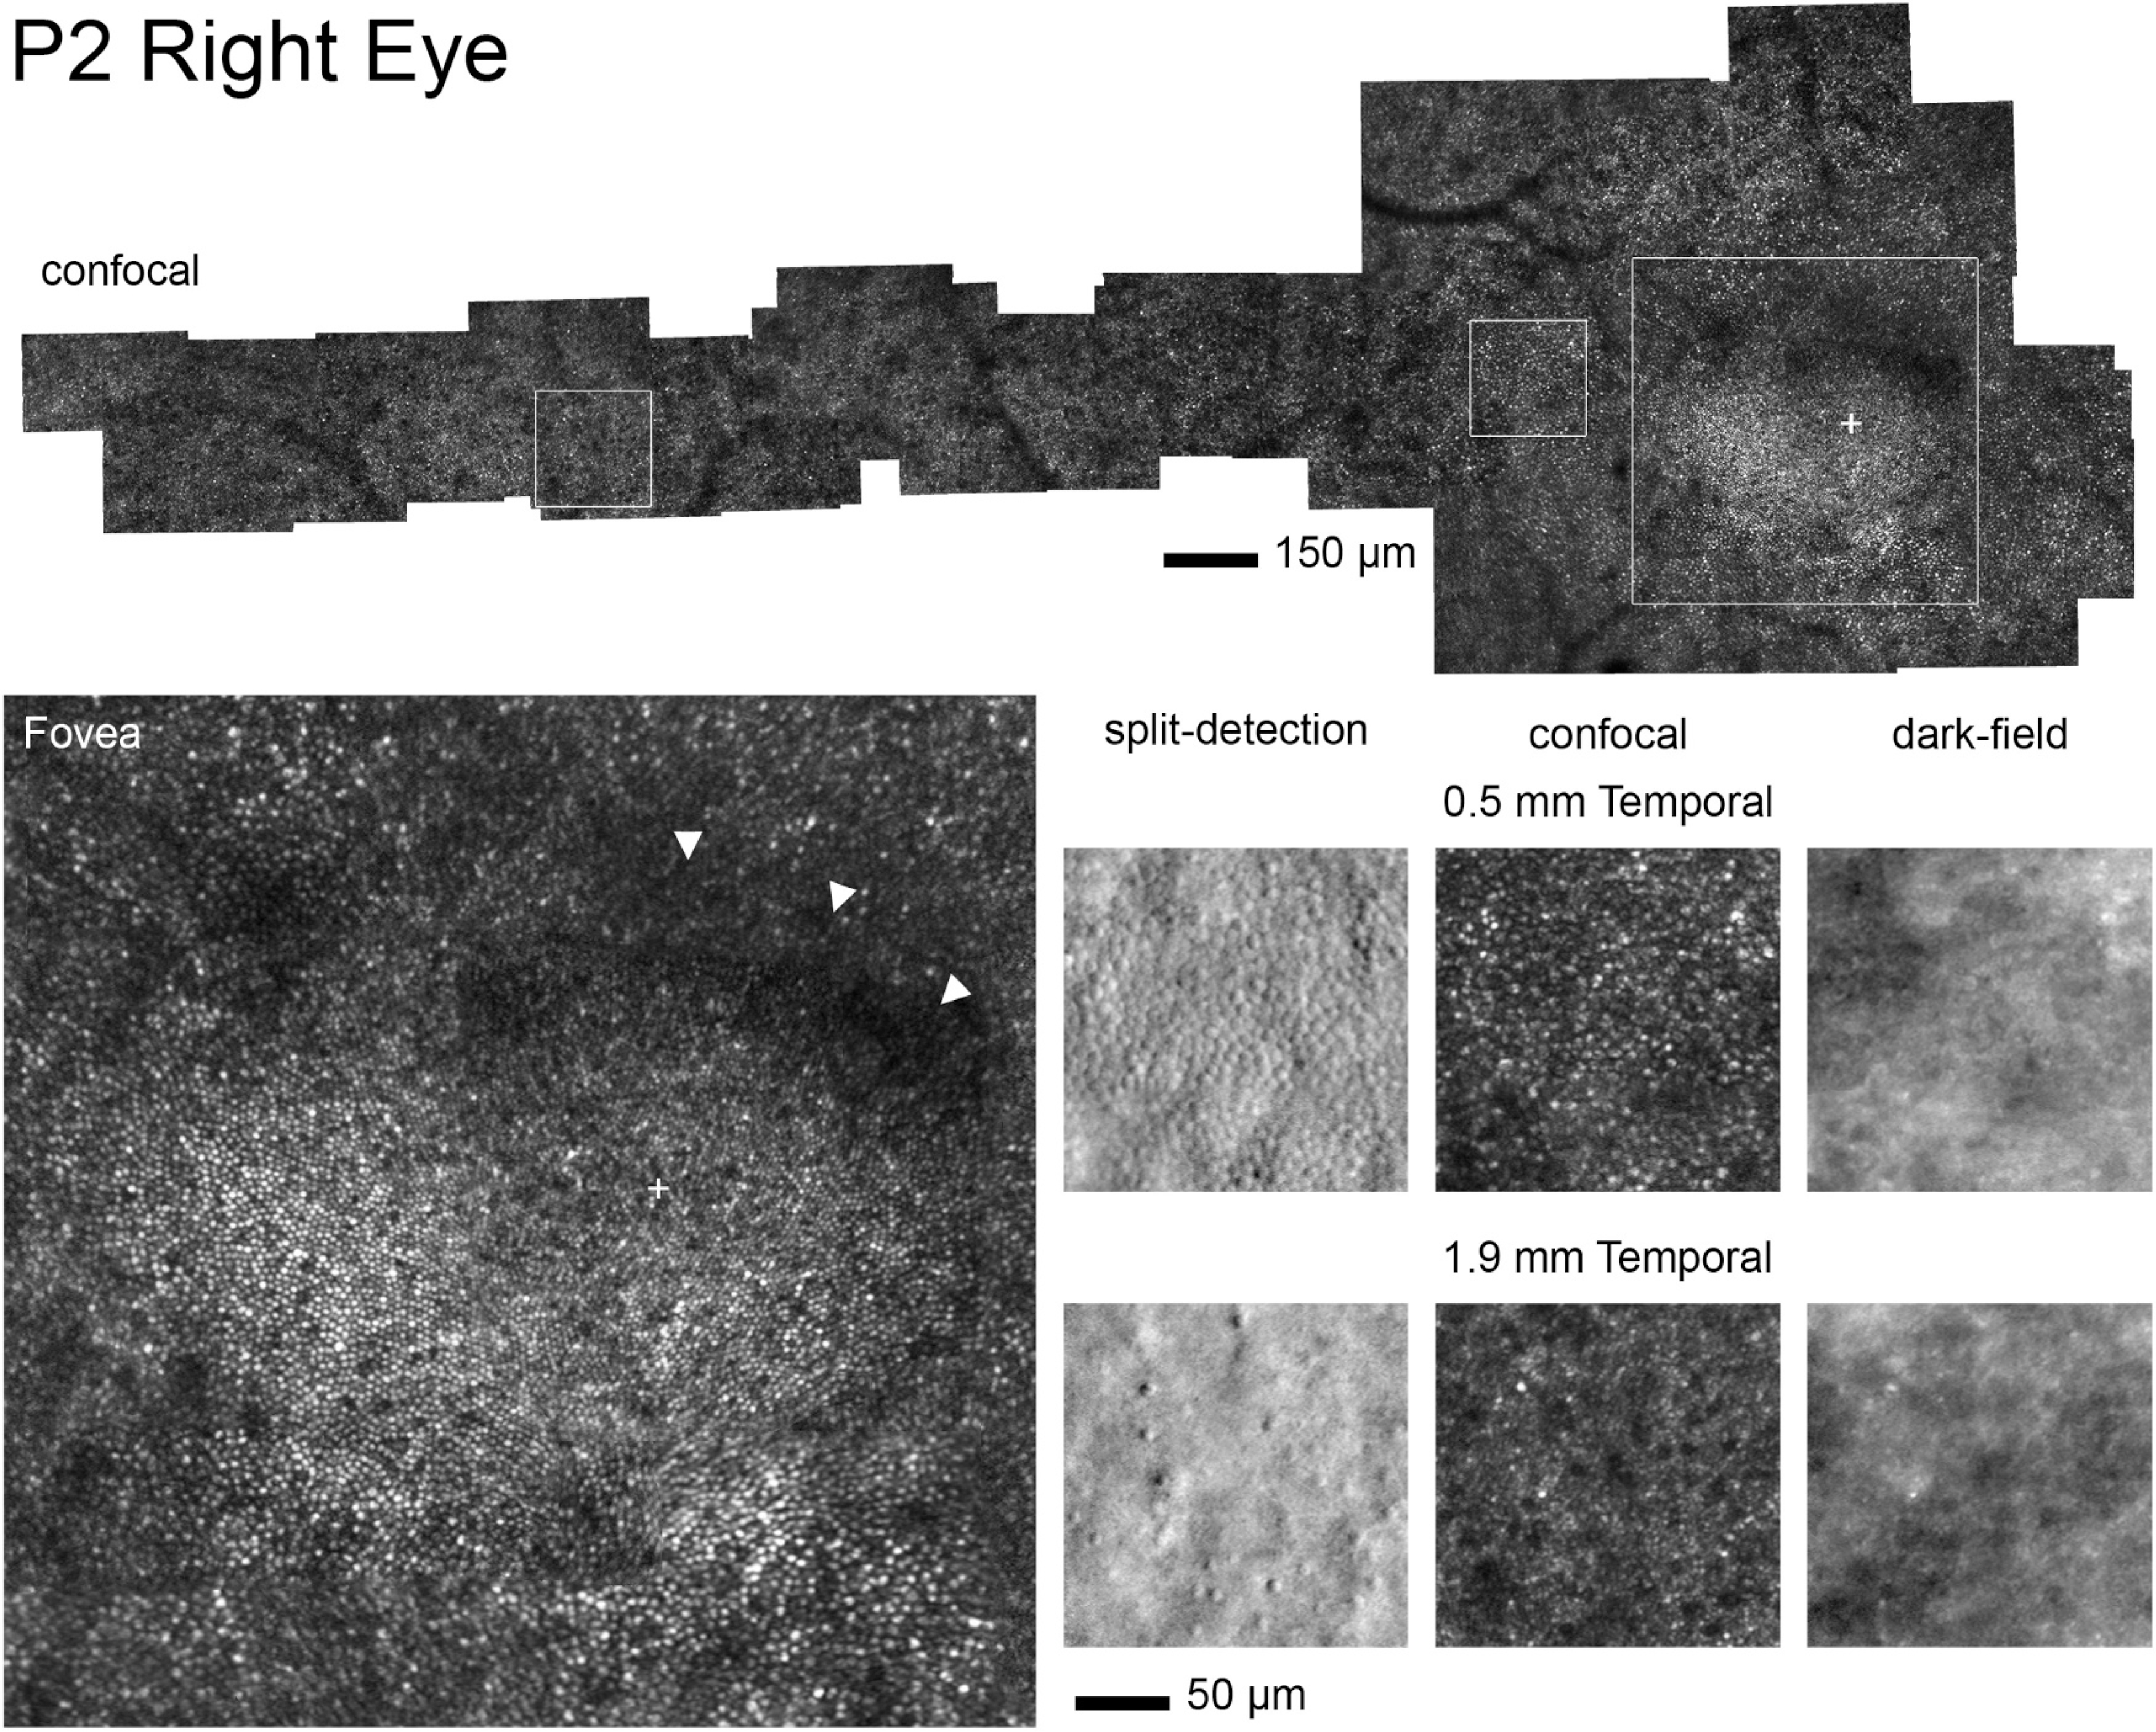
Purpose: To provide a detailed ophthalmic phenotype of two male patients with Bardet-Biedl Syndrome (BBS) due to mutations in the BBS7 geneMethods: Two brothers ages 26 (Patient 1, P1) and 23 (P2) underwent comprehensive ophthalmic evaluations over three years. Visual function was assessed with full-field electroretinograms (ffERGs), kinetic and chromatic perimetry, multimodal imaging with spectral domain optical coherence tomography (SD-OCT), fundus autofluorescence (FAF) with short- (SW) and near-infrared (NIR) excitation lights and adaptive optics scanning light ophthalmoscopy (AOSLO).Results: Both siblings had a history of obesity and postaxial polydactyly; P2 had diagnoses of type 1 Diabetes Mellitus, Addison's disease, high-functioning autism-spectrum disorder and -12D myopia. Visual acuities were better than 20/30. Kinetic fields were moderately constricted. Cone-mediated ffERGs were undetectable, rod ERGs were ~80% of normal mean. Static perimetry showed severe central cone and rod dysfunction. Foveal to parafoveal hypoautofluorescence, most obvious on NIR-FAF, co-localized with outer segment shortening/loss and outer nuclear layer thinning by SD-OCT, and with reduced photoreceptors densities by AOSLO. A structural-functional dissociation was confirmed for cone- and rod-mediated parameters. Worsening of the above abnormalities was documented by SD-OCT and FAF in P2 at 3 years. Gene screening identified compound heterozygous mutations in BBS7 (p.Val266Glu: c.797 T > A of maternal origin; c.1781_1783delCAT, paternal) in both patients.Conclusions: BBS7-associated retinal degeneration may present as a progressive cone-rod dystrophy pattern, reminiscent of both the murine and non-human primate models of the disease. Predominantly central retinal abnormalities in both cone and rod photoreceptors showed a structural-functional dissociation, an ideal scenario for gene augmentation treatments.

Keywords: BBS; BBS7; Bardet-Biedl; OCT; RP; adaptive optics ophthalmoscopy; cone dystrophy; cone-rod dystrophy; retinitis pigmentosa.


Conflict of interest statement

Declaration of interest

The authors report no conflicts of interest. The authors alone are responsible for the content and writing of this article.

Figures

Figure 1.
Figure 1.
En-face multimodal imaging in BBS7 patients. (a) Wide angle color fundus photography and fundus autofluorescence elicited with short-wavelength (SW-FAF) and near-infrared (NIR-FAF) excitation lights in both patients. The images correspond to an intermediate visit on their follow up (P1, age 29; P2, age 22) with the highest quality, wide-angle color fundus photography available. Normal appearance of SW-FAF and NIR-FAF imaging are shown as insets of P2. Vertical yellow arrows point to depigmented halo around the foveal center in P1 and to a darker than the surrounding center in P2. Diagonal red arrow on the SW-FAF image of P2 points to juxtafoveal region of increased SW-FAF, which is close to the normal ring of increased autofluorescence caused in the normal subject by a local reduction of the macular pigment optical density in the juxtafovea (shoulder of the macular pigment) in a large proportion of otherwise normal subjects. Representative normal FAF images are shown as insets forcomparison. (b) SD-OCT horizontal, 8 mm cross sections through the fovea of the patients. Nuclear layers are labeled in P1: outer nuclear layer = ONL, inner nuclear layer = INL, ganglion cell layer = GCL. Outer retinal sublaminae are labelled (diagonal arrows) according to conventional nomenclature: 1. Outer limiting membrane (OLM), 2. Inner segment ellipsoid region (ISe or EZ), 3. The contact cylinder between the apical RPE microvilli and the photoreceptor outer segments tips, or interdigitation zone (IZ), 4. Basal RPE and Bruch’s membrane (RPE/BrM). The outer plexiform layer (OPL) is also labelled in P2. Vertical yellow arrows in the patients denote juxtafoveal segment with abrupt outer retinal (OLM, EZ and IZ) changes where the retina transitions from a near normal appearance on SW- and SW-FAF imaging to deep hypoautofluorescence in (a). Scale bars to the left. T, temporal, N, nasal retina.
Figure 2.
Figure 2.
Longitudinal changes in retinal structure over a three-year interval in BBS7. (a) NIR-FAF images in both patients at two visits. (b) Magnified 2 mm-long SD-OCT cross-sections from the two visits. Horizontal dashed bar at the bottom of NIR-FAF panels in (a) delimit the horizontal extent sampled by the OCT scans. Vertical dashed lines define the peripheral boundary of the juxtafoveal area hypoautofluorescence on NIR-FAF at the first visit that corresponds with a juxtafoveal segment where the EZ band is interrupted. Vertical short solid line parallel to the dashed lines in temporal retina denotes the location of the re-emergence of the EZ band at 3 years which corresponds with the centrifugal movement of this transitional zone. Asterisks = juxtafoveal increased posterior signal scattering due to RPE depigmentation. Arrows point to linear intraretinal hyperreflectivities that may reflect both intraretinal pigment migration and/or Muller cell hypertrophy. Arrowhead points to an hyporreflective area apical to the basal RPE/BrM that appears on follow up in P1. Vertical bars in P2 compared the length of the distance between the EZ and the RPE/BrM at baseline compared to 3 years of follow up.
Figure 3.
Figure 3.
(a) Standard full-field ERGs in the patients compared with a representative normal subject (gray traces). (b) Light-adapted achromatic and dark-adapted chromatic (500 nm) horizontal sensitivity profiles in the patients compared with the normal range (gray bands, normal mean ± 2SD). Sensitivities to the 500-nm stimulus are confirmed mediated by rods through the use of spectral sensitivity (500 nm – 650 nm) differences. Hatched bar denotes the location of the blind spot. N, nasal. T, Temporal. (c) Thickness of the outer nuclear layer (ONL) along the horizontal meridian at eccentricities that co-localize with the sensitivities measured with static perimetry in (B). Gray bands: normal limits (mean ± 2SD).
Figure 4.
Figure 4.
(a) Magnified 2.5 mm horizontal SD-OCT cross-sections from the fovea into the nasal retina in the two patients on their first visit are compared with a representative normal subject. Overlaid white traces are LRPs from a location ~2 mm nasal from the foveola. (b) LRPs segments distal to the outer limiting membrane (OLM) are magnified to explore changes in the outer retinal sublaminae. LRPs from the foveola and 2 mm nasal [white boxes overlaid on OCT scans in (A)] are compared with normal LRPs (gray traces). The various peaks that correspond with the different outer retinal sublaminae are labelled as in Figure 1. At the foveola, LRP segments colored red denote the signal between the ellipsoid region of photoreceptor inner segments (ISe or EZ) and the contact cylinder between the apical RPE microvilli and the cone outer segment tips (COST), which relates to the length of the foveolar cone outer segment length. LRP segments in blue at the 2 mm location denote the signal that bridges the distance between the ISe and the apical RPE/BRM, which relates to the distance spanned by rod, and intermingled cone (overlapping red segment) outer segments. (c) Thickness of the ONL and the length of the ISe-to-RPE/BrM in patients compared to the lower limit of normal (mean – 2SD) for both parameters (gray horizontal bars). F, foveola. N and T are measures from 2 mm nasal and 3.6 mm temporal to the fovea, respectively.
Figure 5.
Figure 5.
Adaptive optics images in P1. Top. Split-detection adaptive optics montage of the inner segment mosaic. Widespread loss of cone inner segments is observed. Bottom. Magnified regions of interest. Split-detection adaptive optics imaging at the fovea (large image) reveals an intact mosaic, cross-hair located at the reduced peak cone density of 31,736 cones/mm2. Asteriskscorrespond to the bull’s eye lesion where the cone mosaic is no longer visible. Split-detection, confocal and dark-field adaptive optics images at 0.6 mm Temporal () show a pocket of retained cone inner and waveguiding outer segments and retinal pigment epithelium, respectively. At 1.3 mm Temporal (eccentricity of) cone and rod densities are reduced, cones do not normally waveguide while rods do and retinal pigment epithelial cell density is normal.
Figure 6.
Figure 6.
Adaptive optics images in P2. Top. Confocal adaptive optics montage of the photoreceptor mosaic. Widespread loss of cone waveguiding is observed albeit with abnormally retained waveguiding in the temporal parafovea and normal-appearing waveguiding in the foveal center. Bottom. Magnified regions of interest. Confocal adaptive optics imaging at the fovea (large) reveals an intact and waveguiding mosaic, cross-hair located at the reduced peak cone density of 97,814 cones/mm2. Arrowheads identify a region of dimly waveguiding cones, perhaps a precursor to a bull’s eye lesion. Split-detection and confocal adaptive optics images at 0.5 mm Temporal again show the cone inner segment mosaic with mottled but retained waveguiding. At 1.9 mm Temporal cone and rod densities are reduced and cones do not normally waveguide while the rods do. Dark-field images show the RPE mosaic.

References

    1. Krill AE, Folk E, Rosenthal IM. Electroretinography in the Laurence-Moon-Biedl syndrome. An aid in diagnosis of the atypical case. Am J Dis Child. 1961;102:205–09. doi: 10.1001/archpedi.1961.02080010207009. - DOI - PubMed
    1. Green JS, Parfrey PS, Harnett JD, Farid NR, Cramer BC, Johnson G, Heath O, McManamon PJ, O’Leary E, Pryse-Phillips W, et al. The cardinal manifestations of Bardet-Biedl syndrome, a form of Laurence-Moon-Biedl syndrome. N Engl J Med. 1989;321:1002–09. - PubMed
    1. Forsyth RL, Gunay-Aygun M. Bardet-Biedl Syndrome Overview. 2003. July 14 [Updated 2020 Jul 23]. In: Adam MP, Ardinger HH, Pagon RA, et al. , editors. GeneReviews® [Internet]. Seattle (WA): University of Washington, Seattle; 1993–2021. Available from: https://www-ncbi-nlm-nih-gov.proxy.library.upenn.edu/books/NBK1363/.
    1. Badano JL, Ansley SJ, Leitch CC, Lewis RA, Lupski JR, Katsanis N. Identification of a novel Bardet-Biedl syndrome protein, BBS7, that shares structural features with BBS1 and BBS2. Am J Hum Genet. 2003;72:650–58. doi: 10.1086/368204. - DOI - PMC - PubMed
    1. Weihbrecht K, Goar WA, Pak T, Garrison JE, DeLuca AP, Stone EM, Scheetz TE, Sheffield VC. Keeping an eye on bardet-biedl syndrome: a comprehensive review of the role of bardet-biedl syndrome genes in the eye. Med Res Arch. 2017;5. doi: 10.18103/mra.v18105i18109.11526. - DOI - PMC - PubMed

Publication types

MeSH terms

Substances

Supplementary concepts

LinkOut - more resources