

The Impact of COVID-19 Management Policies Tailored to Airborne SARS-CoV-2 Transmission: Policy Analysis
- PMID: 33729168
- PMCID: PMC8061894
- DOI: 10.2196/20699
The Impact of COVID-19 Management Policies Tailored to Airborne SARS-CoV-2 Transmission: Policy Analysis
Erratum in
-
Correction: The Impact of COVID-19 Management Policies Tailored to Airborne SARS-CoV-2 Transmission: Policy Analysis.JMIR Public Health Surveill. 2021 May 3;7(5):e30007. doi: 10.2196/30007. JMIR Public Health Surveill. 2021. PMID: 33939626 Free PMC article.
Abstract
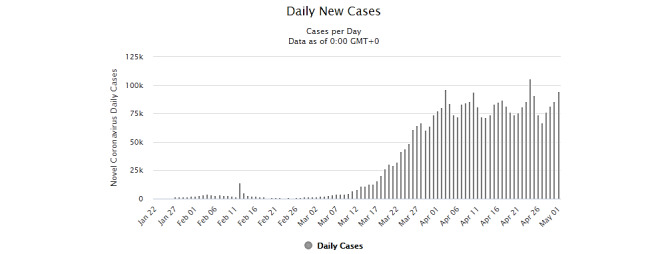
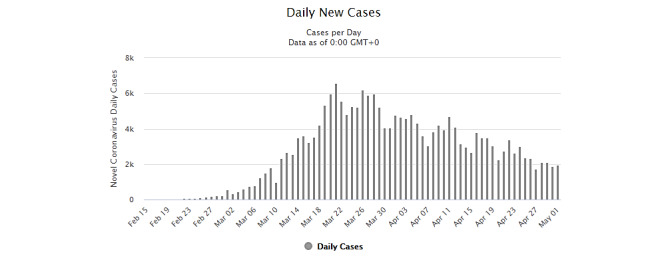
Background: Daily new COVID-19 cases from January to April 2020 demonstrate varying patterns of SARS-CoV-2 transmission across different geographical regions. Constant infection rates were observed in some countries, whereas China and South Korea had a very low number of daily new cases. In fact, China and South Korea successfully and quickly flattened their COVID-19 curve. To understand why this was the case, this paper investigated possible aerosol-forming patterns in the atmosphere and their relationship to the policy measures adopted by select countries.
Objective: The main research objective was to compare the outcomes of policies adopted by countries between January and April 2020. Policies included physical distancing measures that in some cases were associated with mask use and city disinfection. We investigated whether the type of social distancing framework adopted by some countries (ie, without mask use and city disinfection) led to the continual dissemination of SARS-CoV-2 (daily new cases) in the community during the study period.
Methods: We examined the policies used as a preventive framework for virus community transmission in some countries and compared them to the policies adopted by China and South Korea. Countries that used a policy of social distancing by 1-2 m were divided into two groups. The first group consisted of countries that implemented social distancing (1-2 m) only, and the second comprised China and South Korea, which implemented distancing with additional transmission/isolation measures using masks and city disinfection. Global daily case maps from Johns Hopkins University were used to provide time-series data for the analysis.
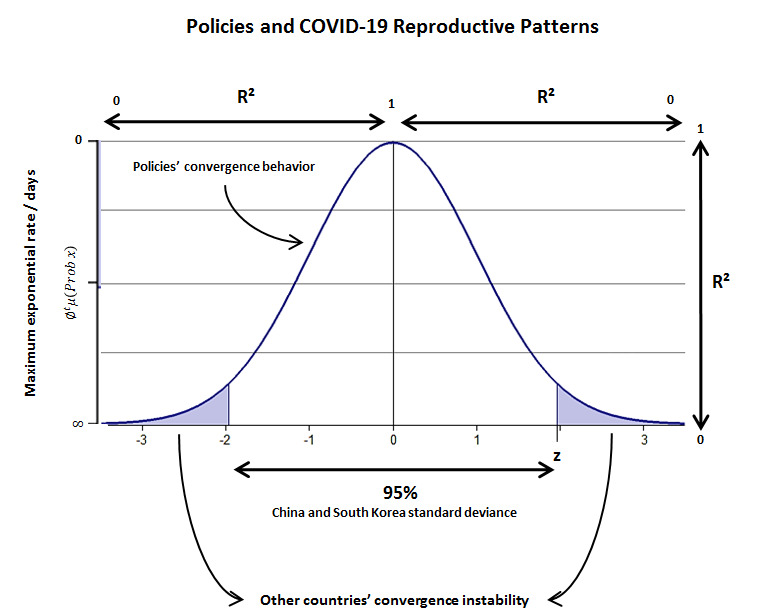
Results: The results showed that virus transmission was reduced due to policies affecting SARS-CoV-2 propagation over time. Remarkably, China and South Korea obtained substantially better results than other countries at the beginning of the epidemic due to their adoption of social distancing (1-2 m) with the additional use of masks and sanitization (city disinfection). These measures proved to be effective due to the atmosphere carrier potential of SARS-CoV-2 transmission.
Conclusions: Our findings confirm that social distancing by 1-2 m with mask use and city disinfection yields positive outcomes. These strategies should be incorporated into prevention and control policies and be adopted both globally and by individuals as a method to fight the COVID-19 pandemic.
Keywords: COVID-19; airborne transmission; convergence and stability properties; social distancing policies.
©Charles Roberto Telles, Archisman Roy, Mohammad Rehan Ajmal, Syed Khalid Mustafa, Mohammad Ayaz Ahmad, Juan Moises de la Serna, Elisandro Pires Frigo, Manuel Hernández Rosales. Originally published in JMIR Public Health and Surveillance (https://publichealth.jmir.org), 21.04.2021.
Conflict of interest statement
Conflicts of Interest: None declared.
Figures
References
-
- Morawska L, Milton DK. It Is Time to Address Airborne Transmission of Coronavirus Disease 2019 (COVID-19) Clin Infect Dis. 2020 Dec 03;71(9):2311–2313. doi: 10.1093/cid/ciaa939. http://europepmc.org/abstract/MED/32628269 - DOI - PMC - PubMed
-
- Coronavirus disease 2019 (COVID-19) Situation Report – 68. World Health Organization. 2020. Mar 28, [2021-04-08]. https://www.who.int/docs/default-source/coronaviruse/situation-reports/2....
MeSH terms
LinkOut - more resources
Full Text Sources
Other Literature Sources
Medical
Miscellaneous
