Cecal microbial transplantation attenuates hyperthyroid-induced thermogenesis in Mongolian gerbils
- PMID: 33729663
- PMCID: PMC8913869
- DOI: 10.1111/1751-7915.13793
Cecal microbial transplantation attenuates hyperthyroid-induced thermogenesis in Mongolian gerbils
Abstract
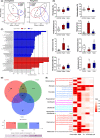
Endothermic mammals have a high energy cost to maintain a stable and high body temperature (Tb , around 37°C). Thyroid hormones are a major regulator for energy metabolism and Tb . The gut microbiota is involved in modulating host energy metabolism. However, whether the interaction between the gut microbiota and thyroid hormones is involved in metabolic and thermal regulations is unclear. We hypothesized that thyroid hormones via an interaction with gut microbiota orchestrate host thermogenesis and Tb . l-thyroxine-induced hyperthyroid Mongolian gerbils (Meriones unguiculatus) increased resting metabolic rate (RMR) and Tb , whereas Methimazole-induced hypothyroid animals decreased RMR. Both hypothyroid and hyperthyroid animals differed significantly in faecal bacterial community. Hyperthyroidism increased the relative abundance of pathogenic bacteria, such as Helicobacter and Rikenella, and decreased abundance of beneficial bacteria Butyricimonas and Parabacteroides, accompanied by reduced total bile acids and short-chain fatty acids. Furthermore, the hyperthyroid gerbils transplanted with the microbiota from control donors increased type 2 deiodinase (DIO2) expression in the liver and showed a greater rate of decline of both serum T3 and T4 levels and, consequently, a more rapid recovery of normal RMR and Tb . These findings indicate that thyroid hormones regulate thermogenesis depending on gut microbiota and colonization with normal microbiota by caecal microbial transplantation attenuates hyperthyroid-induced thermogenesis. This work reveals the functional consequences of the gut microbiota-thyroid axis in controlling host metabolic physiology and Tb in endotherms.
© 2021 The Authors. Microbial Biotechnology published by John Wiley & Sons Ltd and Society for Applied Microbiology.
Conflict of interest statement
The authors disclose no conflicts.
Figures


Similar articles
-
Gut Microbial Community and Host Thermoregulation in Small Mammals.Front Physiol. 2022 Apr 11;13:888324. doi: 10.3389/fphys.2022.888324. eCollection 2022. Front Physiol. 2022. PMID: 35480035 Free PMC article.
-
Thyroid hormones mediate metabolic rate and oxidative, anti-oxidative balance at different temperatures in Mongolian gerbils (Meriones unguiculatus).Comp Biochem Physiol C Toxicol Pharmacol. 2019 Feb;216:101-109. doi: 10.1016/j.cbpc.2018.11.016. Epub 2018 Nov 23. Comp Biochem Physiol C Toxicol Pharmacol. 2019. PMID: 30476595
-
Huddling remodels gut microbiota to reduce energy requirements in a small mammal species during cold exposure.Microbiome. 2018 Jun 8;6(1):103. doi: 10.1186/s40168-018-0473-9. Microbiome. 2018. PMID: 29884232 Free PMC article.
-
Gut Microbiota and Host Thermoregulation in Response to Ambient Temperature Fluctuations.mSystems. 2020 Oct 20;5(5):e00514-20. doi: 10.1128/mSystems.00514-20. mSystems. 2020. PMID: 33082280 Free PMC article.
-
Thyroid hormones and the mechanisms of adaptation to cold.Hormones (Athens). 2020 Sep;19(3):329-339. doi: 10.1007/s42000-020-00200-2. Epub 2020 May 12. Hormones (Athens). 2020. PMID: 32399937 Review.
Cited by
-
New Animal Models for Understanding FMRP Functions and FXS Pathology.Cells. 2022 May 12;11(10):1628. doi: 10.3390/cells11101628. Cells. 2022. PMID: 35626665 Free PMC article. Review.
-
Activation of the gut microbiota-kynurenine-liver axis contributes to the development of nonalcoholic hepatic steatosis in nondiabetic adults.Aging (Albany NY). 2021 Sep 2;13(17):21309-21324. doi: 10.18632/aging.203460. Epub 2021 Sep 2. Aging (Albany NY). 2021. PMID: 34473644 Free PMC article.
-
Alterations of the gut microbiota in type 2 diabetics with or without subclinical hypothyroidism.PeerJ. 2023 Apr 13;11:e15193. doi: 10.7717/peerj.15193. eCollection 2023. PeerJ. 2023. PMID: 37073275 Free PMC article.
-
Differences in gut microbes in captive pangolins and the effects of captive breeding.Front Microbiol. 2022 Dec 6;13:1053925. doi: 10.3389/fmicb.2022.1053925. eCollection 2022. Front Microbiol. 2022. PMID: 36560954 Free PMC article.
-
Gut Microbial Community and Host Thermoregulation in Small Mammals.Front Physiol. 2022 Apr 11;13:888324. doi: 10.3389/fphys.2022.888324. eCollection 2022. Front Physiol. 2022. PMID: 35480035 Free PMC article.
References
-
- Ahmed, O.M. , Ahmed, R.G. , El‐Gareib, A.W. , El‐Bakry, A.M. , and El‐Tawab, S.A. (2012) Effects of experimentally induced maternal hypothyroidism and hyperthyroidism on the development of rat offspring: II—The developmental pattern of neurons in relation to oxidative stress and antioxidant defense system. Int J Dev Neurosci 30: 517–537. - PubMed
-
- Barrett, E. , Ross, R.P. , O'Toole, P.W. , Fitzgerald, G.F. , and Stanton, C. (2012) γ‐Aminobutyric acid production by culturable bacteria from the human intestine. J Appl Microbiol 113: 411–417. - PubMed
Publication types
MeSH terms
Substances
LinkOut - more resources
Full Text Sources
Other Literature Sources
Medical

