Observational Study
. 2021 Apr 20;39(12):1339-1348.
doi: 10.1200/JCO.20.02602. Epub 2021 Mar 17.

Persistent Disparity: Socioeconomic Deprivation and Cancer Outcomes in Patients Treated in Clinical Trials

Affiliations
Observational Study

Persistent Disparity: Socioeconomic Deprivation and Cancer Outcomes in Patients Treated in Clinical Trials

Joseph M Unger et al. J Clin Oncol. .

Abstract

Purpose: Patients with cancer living in socioeconomically disadvantaged areas have worse cancer outcomes. The association between socioeconomic deprivation and outcomes among patients with cancer participating in clinical trials has not been systematically examined.

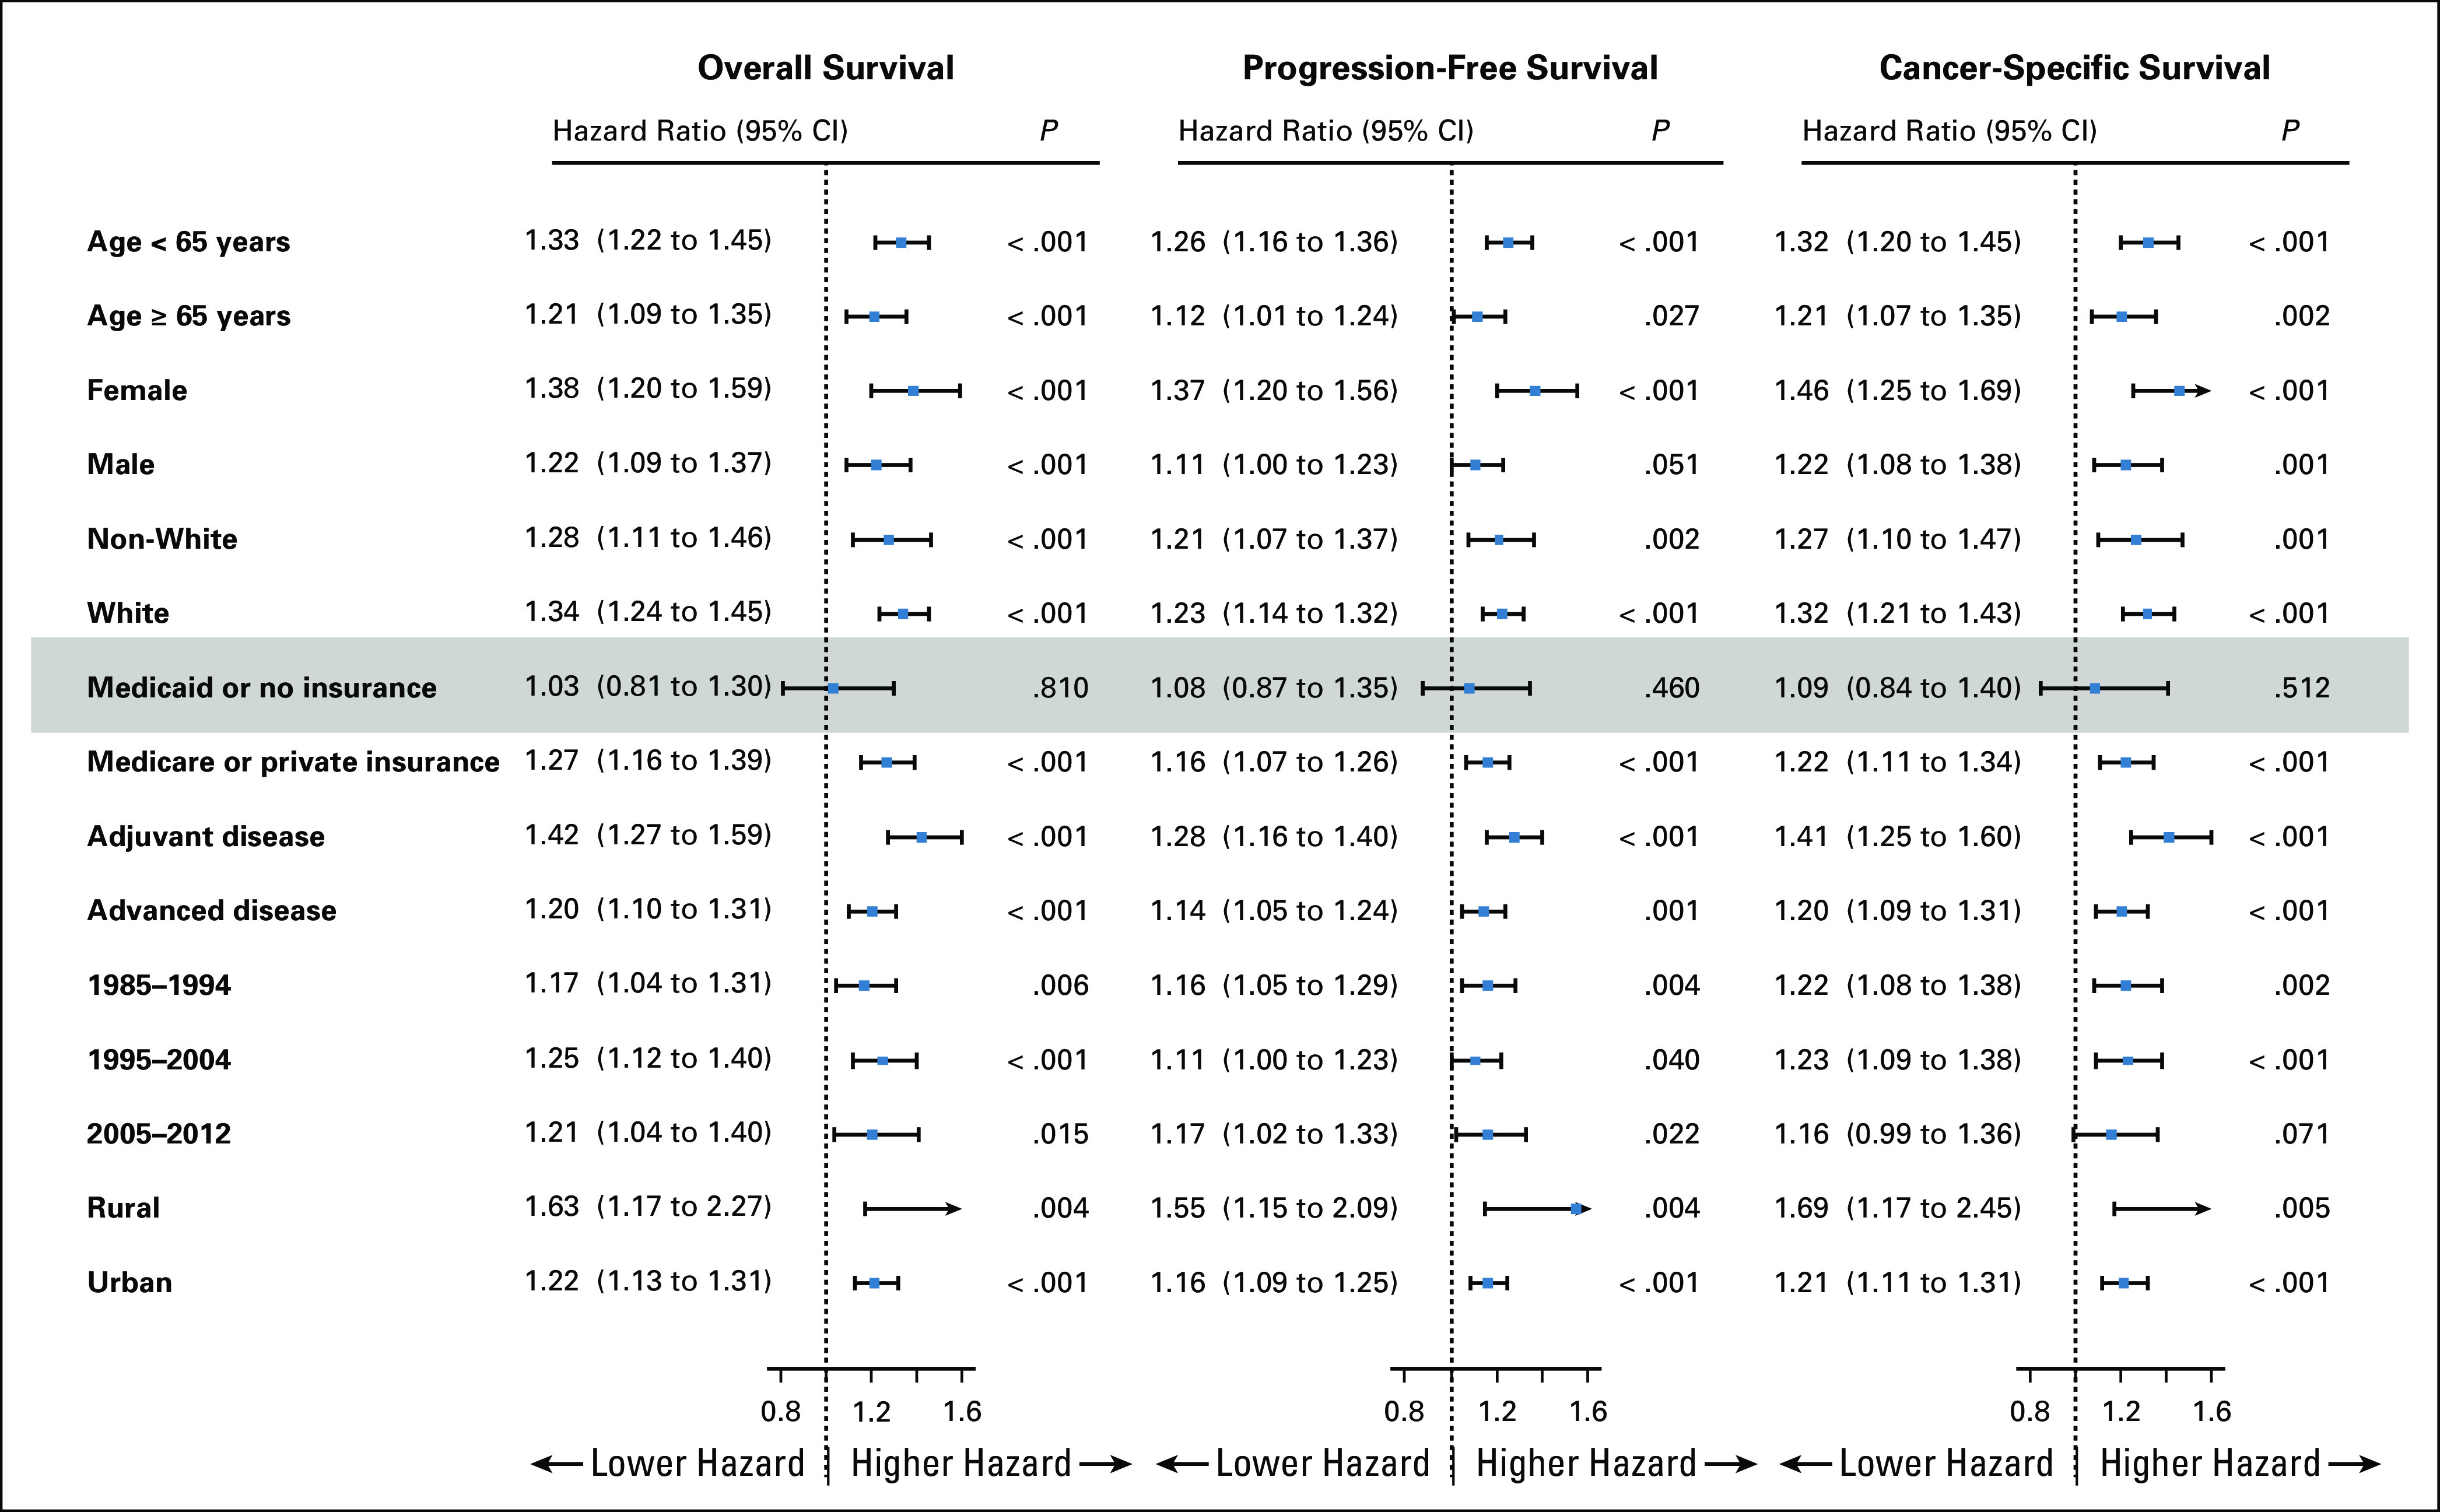
Methods: We examined survival outcomes for patients enrolled in phase III and large phase II clinical trials for major cancers conducted by the SWOG Cancer Research Network from 1985 to 2012. Socioeconomic deprivation was measured using trial participants' residential zip codes linked to the Area Deprivation Index (ADI). Five-year overall survival, progression-free survival, and cancer-specific survival were examined using Cox regression frailty models, adjusting for age, sex, and race, and separately for insurance status, prognostic risk, and rural or urban residency.

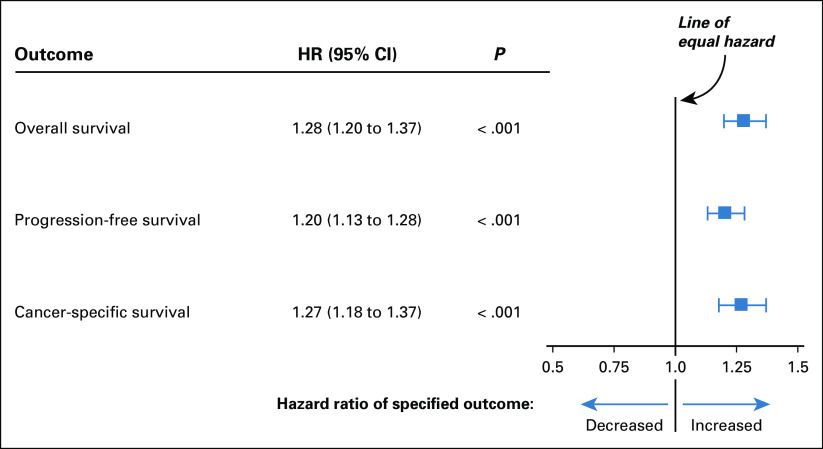
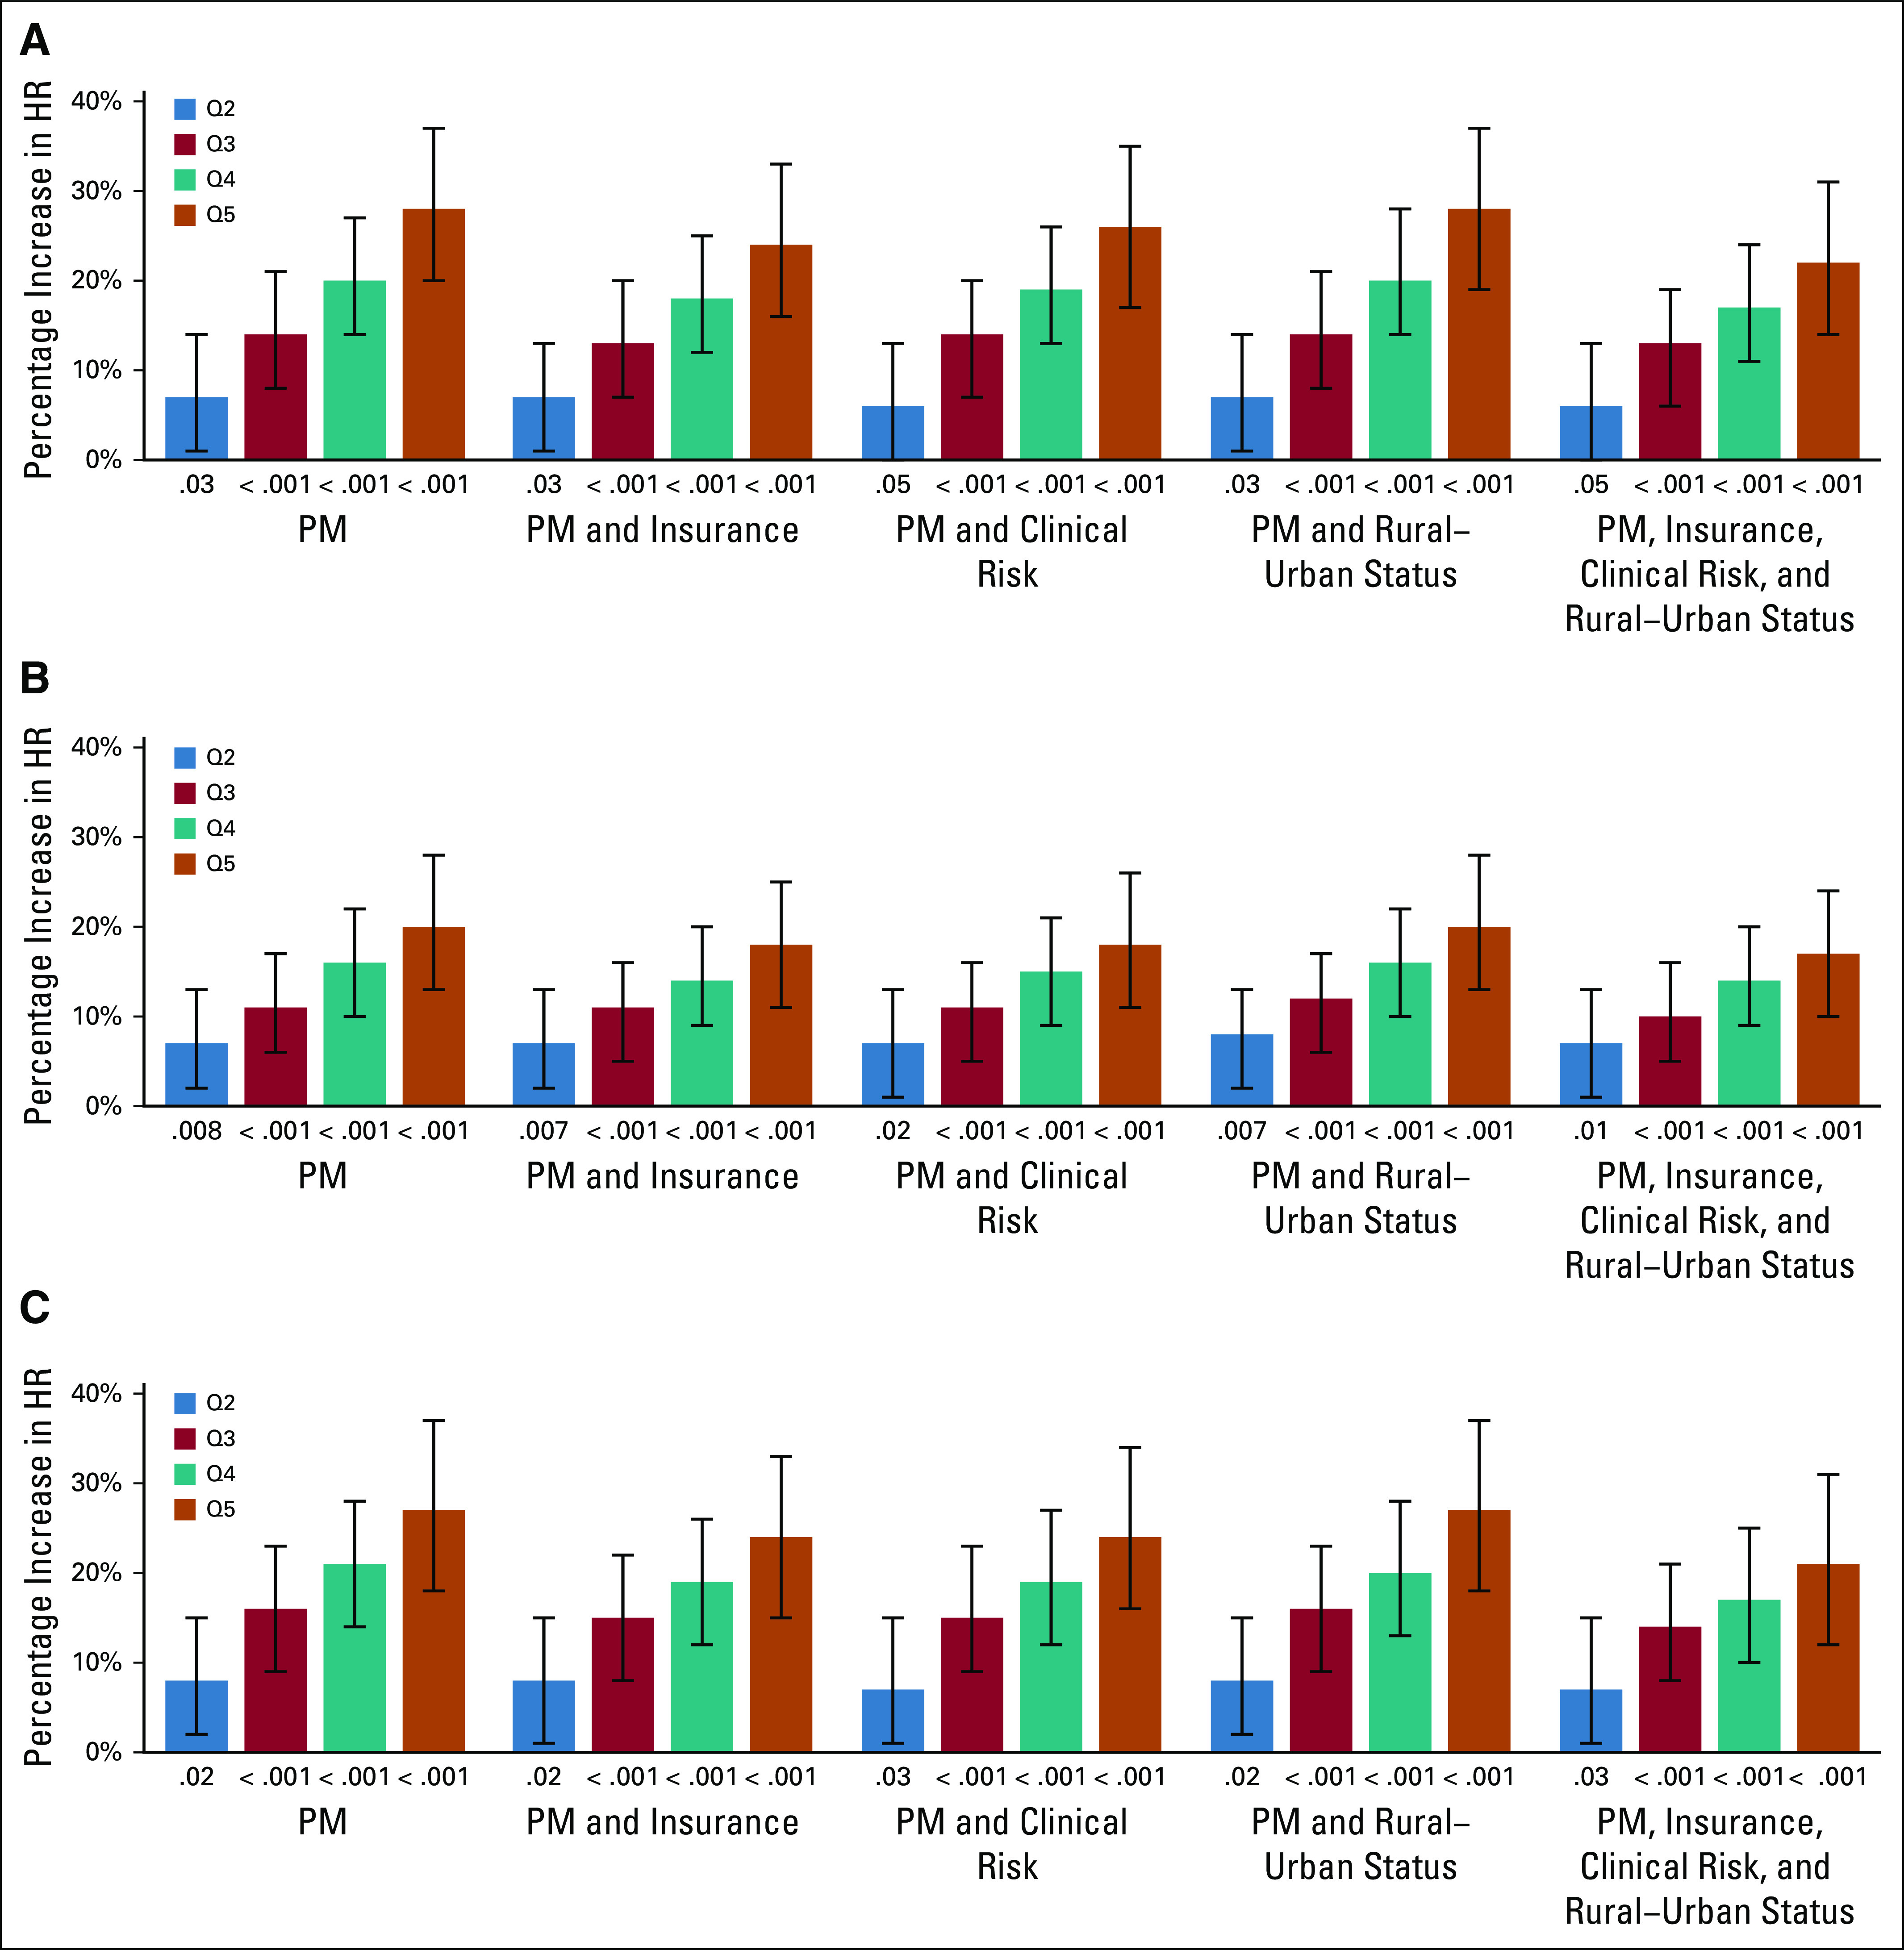
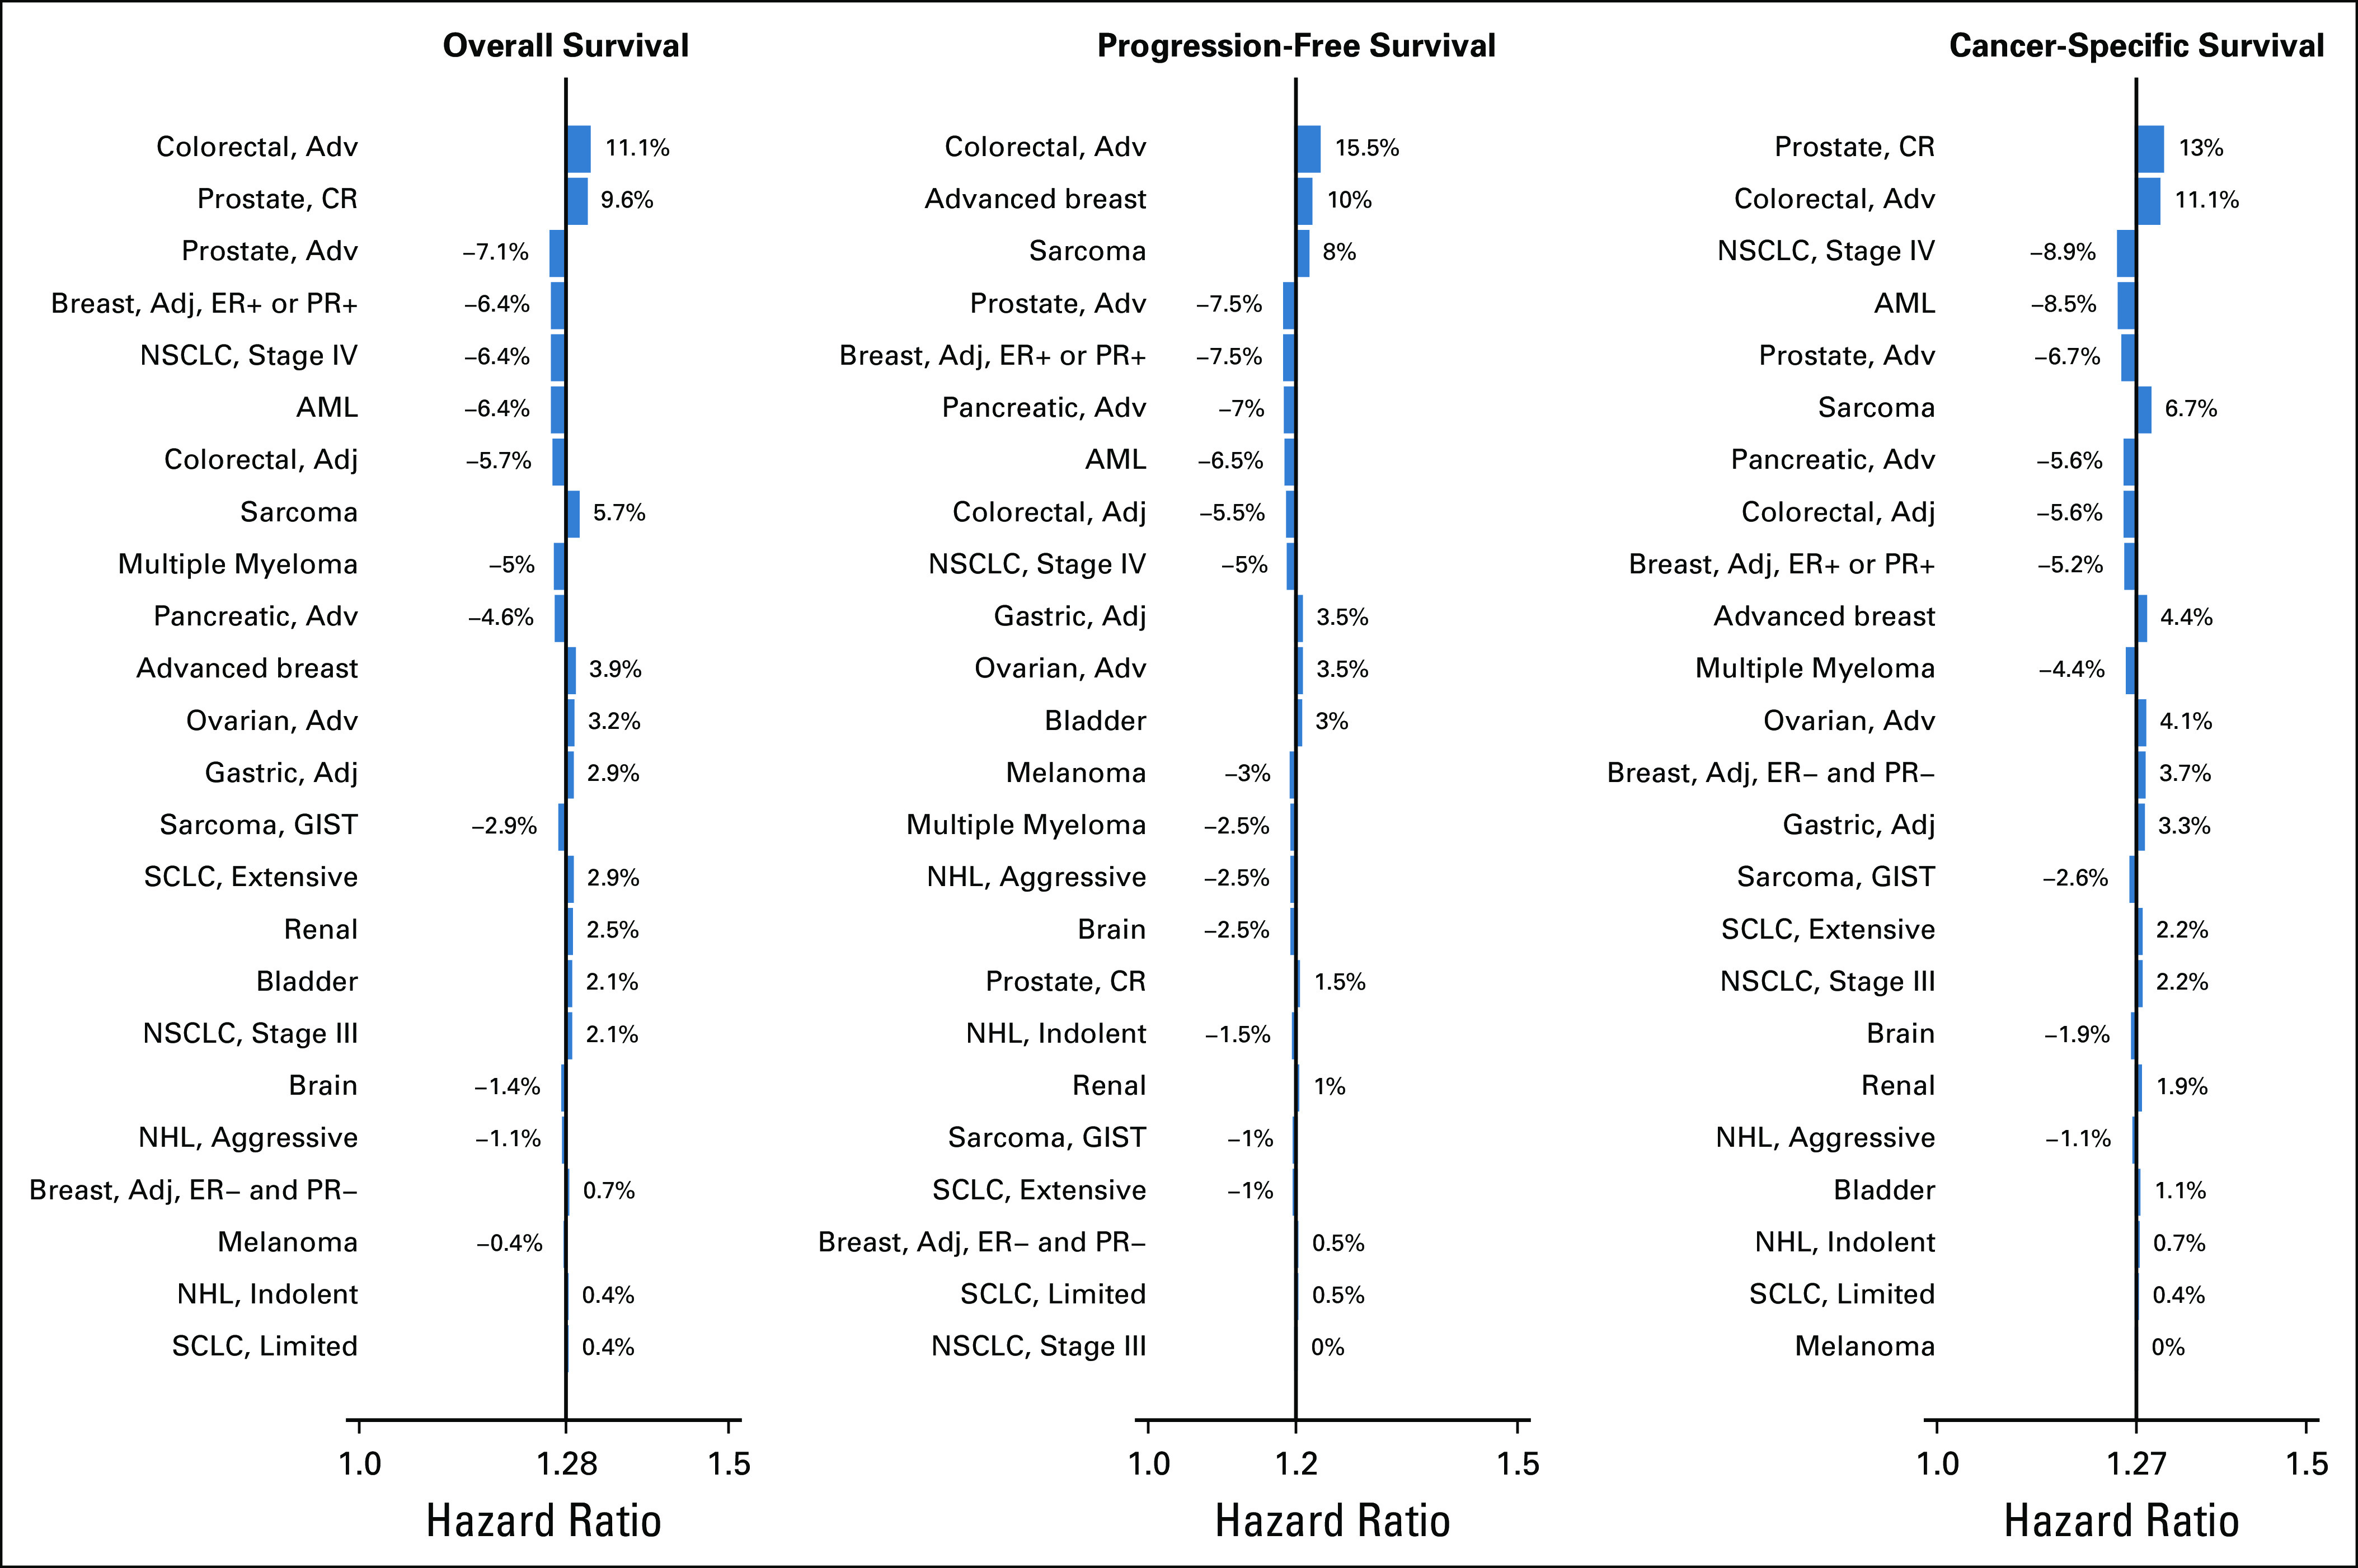
Results: We examined 41,109 patients from 55 trials comprising 24 cancer histology and stage-specific cohorts. Compared with trial participants in the most affluent areas (ADI, 0%-20%), trial participants from areas with the highest socioeconomic deprivation (ADI, 80%-100%) had worse overall (hazard ratio [HR] = 1.28, 95% CI, 1.20 to 1.37, P < .001), progression-free (HR = 1.20, 95% CI, 1.13 to 1.28, P < .001), and cancer-specific survival (HR = 1.27, 95% CI, 1.18 to 1.37, P < .001). The results were similar after adjusting for insurance status, prognostic risk, and rural or urban residency. There was a continuous increase in risk of all outcomes as the ADI quintile increased.

Conclusion: In patients with cancer with access to protocol-directed care in clinical trials, high area-level socioeconomic deprivation was associated with worse survival. Future research should examine whether the etiology of this residual disparity is related to reduced access to supportive care or postprotocol therapy and/or to differences in health status not reflected by protocol selection criteria.


Conflict of interest statement

Raymond U. OsarogiagbonStock and Other Ownership Interests: Lilly, Pfizer, Gilead SciencesHonoraria: BiodesConsulting or Advisory Role: Association of Community Cancer Centers (ACCC), AstraZeneca, American Cancer Society, Triptych Health PartnersPatents, Royalties, Other Intellectual Property: 2 US and 1 China patents for lymph node specimen collection kit and method of pathologic evaluationOther Relationship: Oncobox Scott D. RamseyEmployment: Flatiron HealthConsulting or Advisory Role: Bayer, Genentech, Bristol-Myers Squibb, AstraZeneca, Merck, GRAIL, Pfizer, Seattle Genetics, BiovicaResearch Funding: Bayer, Bristol-Myers Squibb, MicrosoftTravel, Accommodations, Expenses: Bayer Schering Pharma, Bristol-Myers Squibb, Flatiron Health, Bayer, GRAIL Dawn L. HershmanConsulting or Advisory Role: AIM Specialty HealthNo other potential conflicts of interest were reported.

Figures

FIG 1.
FIG 1.
Forest plot of hazard ratio comparing highest deprivation quintile versus lowest deprivation quintile. The results are from primary modeling approach, adjusting for age, race, and sex in frailty model with cancer type as random effect. The boxes in the forest plot represent the hazard ratios, and the horizontal lines are the 95% CIs; the vertical line is the line of equal hazard. HR, hazard ratio.
FIG 2.
FIG 2.
Percentage increase in HR by end point, model, and ADI quintile. (A) Overall survival, (B) progression-free survival, and (C) cancer-specific survival. The results are shown by quintile, defined as Q2, ADI 21%-40%; Q3, ADI 41%-60%; Q4, ADI 61%-80%; and Q5, ADI-81%-100%, most disadvantaged. The P value below each bar represents the comparison for the given quintile of area level deprivation with the lowest area-level deprivation quintile (Q1, ADI 0%-20%, most affluent). Analyses were conducted using Cox regression frailty models; in each model, the cancer type (Data Supplement) was considered a random effect. The vertical lines indicate the 95% CIs. ADI, Area Deprivation Index; HR, hazard ratio; PM, Primary Model.
FIG 3.
FIG 3.
Forest plot of hazard ratio comparing highest deprivation quintile versus lowest deprivation quintile within patient groups. The results are from primary modeling approach, adjusting for age, race, and sex in frailty model with cancer type as random effect. The boxes in the forest plot represent the hazard ratios, and the horizontal lines are the 95% CIs; the vertical line is the line of equal hazard. Findings are statistically significant for all groups except patients with Medicaid or no insurance.
FIG 4.
FIG 4.
Change in overall frailty regression model results due to excluding individual cancer cohorts (eg, leave one out analysis). For overall survival, progression-free survival, and cancer-specific survival, the difference between the primary model adjusted hazard ratio and the adjusted hazard ratio excluding the specified cancer cohort is shown by the bars. The percentage difference is also shown. Adj, adjuvant; Adv, advanced; AML, acute myeloid leukemia; CR, castration-resistant; ER, estrogen-receptor; GIST, GI stromal tumor; NHL, non-Hodgkin's lymphoma; NSCLC, non–small-cell lung cancer; PR, progesterone receptor; SCLC, small-cell lung cancer.

References

    1. Link BG, Phelan J: Social conditions as fundamental causes of disease. J Health Soc Behav 80-94, 1995 - PubMed
    1. Butler DC Petterson S Phillips RL, et al. : Measures of social deprivation that predict health care access and need within a rational area of primary care service delivery. Health Serv Res 48:539-559, 2013 - PMC - PubMed
    1. Chen E, Miller GE: Socioeconomic status and health: Mediating and moderating factors. Annu Rev Clin Psychol 9:723-749, 2013 - PubMed
    1. Cutler DM, Lleras-Muney A, Vogl T: Socioeconomic status and health: Dimensions and mechanisms. NBER Working Paper No. 14333. 2008.
    1. Hines R Markossian T Johnson A, et al. : Geographic residency status and census tract socioeconomic status as determinants of colorectal cancer outcomes. Am J Public Health 104:e63-71, 2014 - PMC - PubMed

Publication types