. 2021 Mar 17:10:e63329.
doi: 10.7554/eLife.63329.

Cortical astrocytes independently regulate sleep depth and duration via separate GPCR pathways

Affiliations

Cortical astrocytes independently regulate sleep depth and duration via separate GPCR pathways

Trisha V Vaidyanathan et al. Elife. .

Abstract

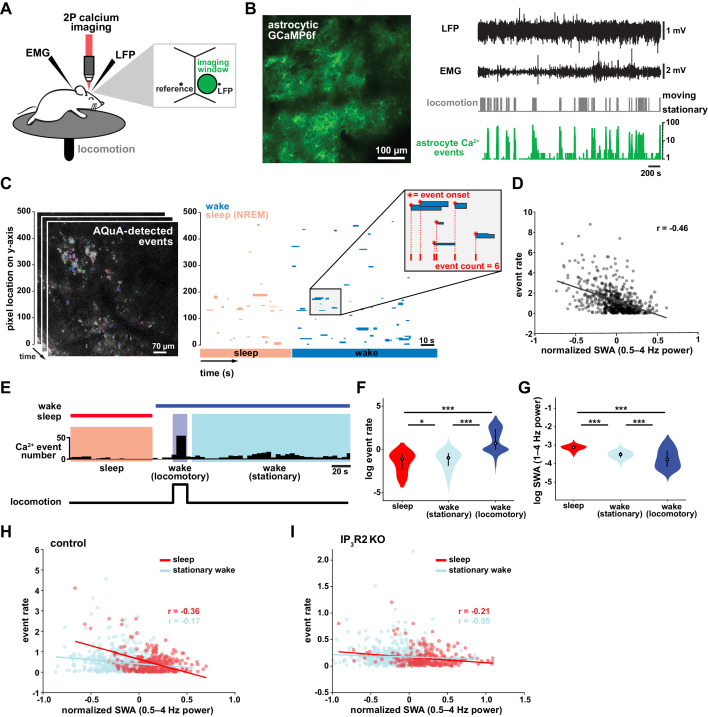
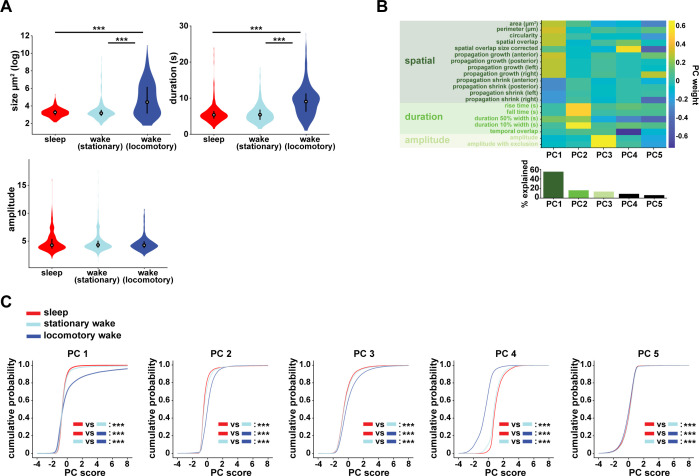
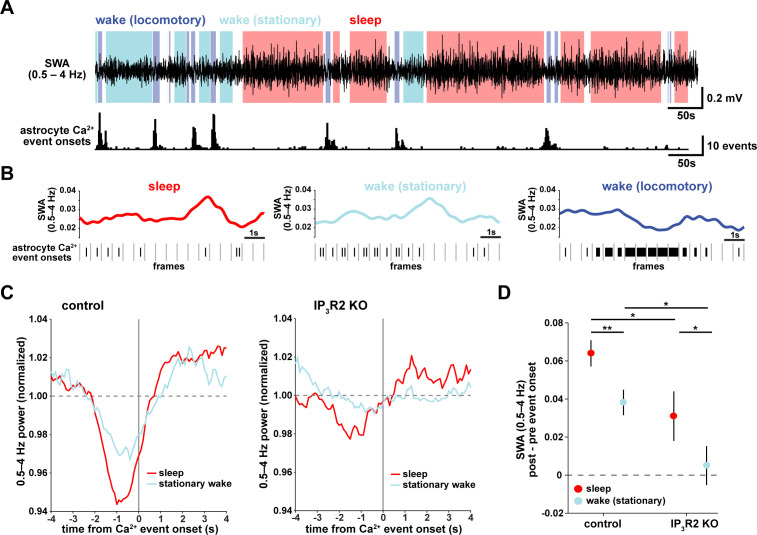
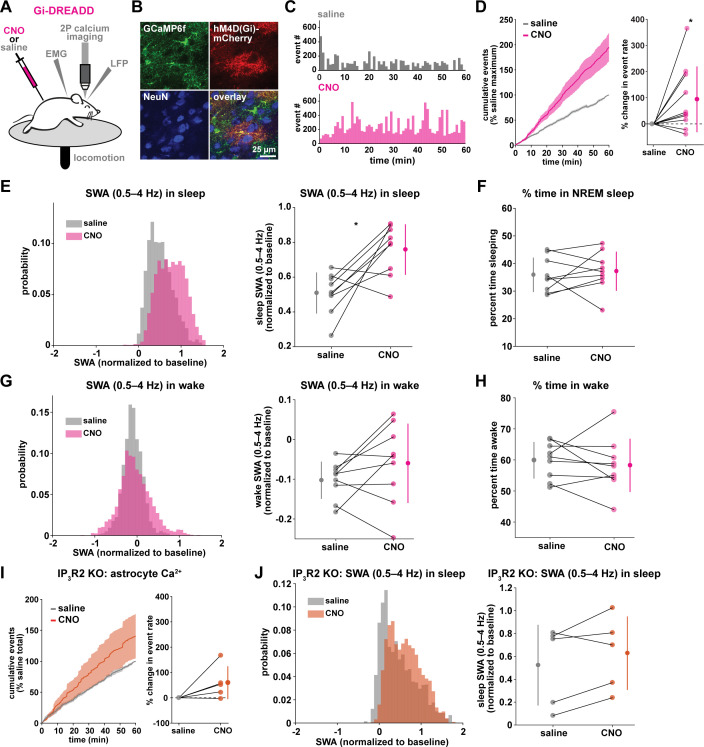
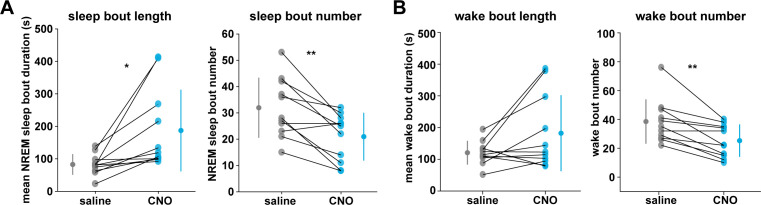
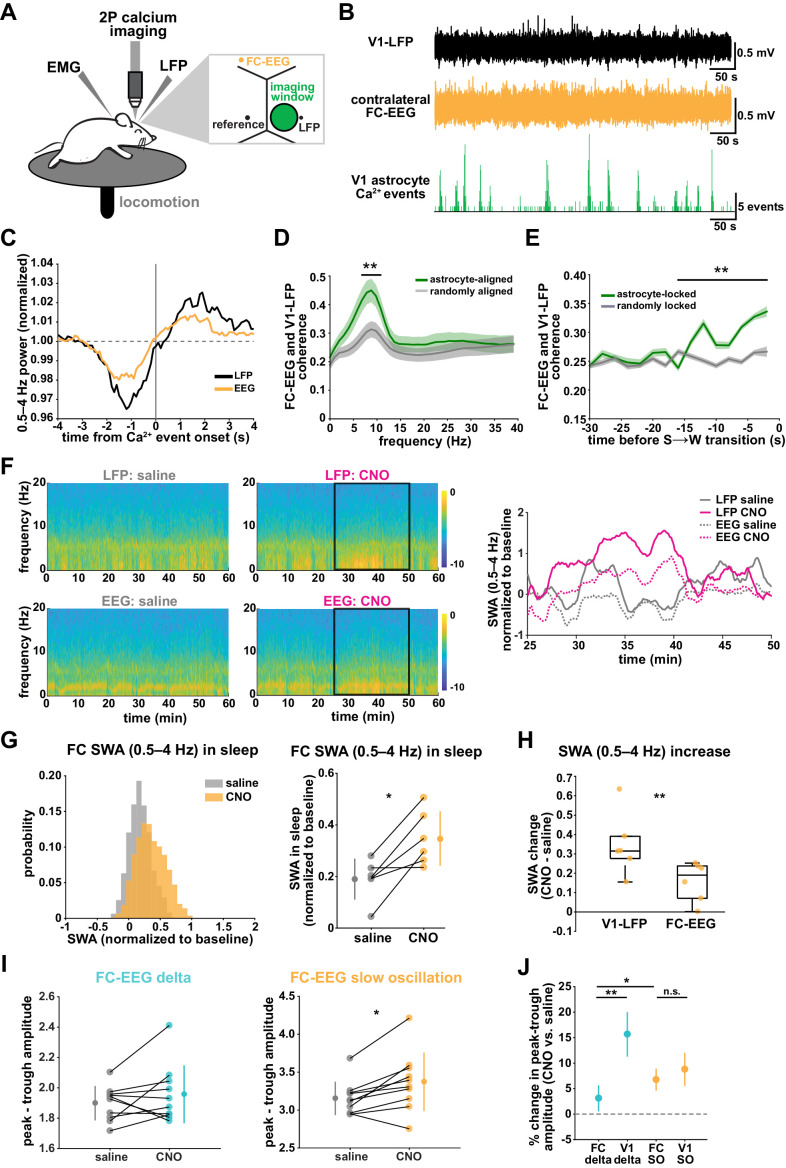
Non-rapid eye movement (NREM) sleep, characterized by slow-wave electrophysiological activity, underlies several critical functions, including learning and memory. However, NREM sleep is heterogeneous, varying in duration, depth, and spatially across the cortex. While these NREM sleep features are thought to be largely independently regulated, there is also evidence that they are mechanistically coupled. To investigate how cortical NREM sleep features are controlled, we examined the astrocytic network, comprising a cortex-wide syncytium that influences population-level neuronal activity. We quantified endogenous astrocyte activity in mice over natural sleep and wake, then manipulated specific astrocytic G-protein-coupled receptor (GPCR) signaling pathways in vivo. We find that astrocytic Gi- and Gq-coupled GPCR signaling separately control NREM sleep depth and duration, respectively, and that astrocytic signaling causes differential changes in local and remote cortex. These data support a model in which the cortical astrocyte network serves as a hub for regulating distinct NREM sleep features.

Keywords: astrocytes; chemogenetics; cortex; mouse; neuroscience; sleep; slow-wave activity; two-photon imaging.

Plain language summary

Sleep has many roles, from strengthening new memories to regulating mood and appetite. While we might instinctively think of sleep as a uniform state of reduced brain activity, the reality is more complex. First, over the course of the night, we cycle between a number of different sleep stages, which reflect different levels of sleep depth. Second, the amount of sleep depth is not necessarily even across the brain but can vary between regions. These sleep stages consist of either rapid eye movement (REM) sleep or non-REM (NREM) sleep. REM sleep is when most dreaming occurs, whereas NREM sleep is particularly important for learning and memory and can vary in duration and depth. During NREM sleep, large groups of neurons synchronize their firing to create rhythmic waves of activity known as slow waves. The more synchronous the activity, the deeper the sleep. Vaidyanathan et al. now show that brain cells called astrocytes help regulate NREM sleep. Astrocytes are not neurons but belong to a group of specialized cells called glia. They are the largest glia cell type in the brain and display an array of proteins on their surfaces called G-protein-coupled receptors (GPCRs). These enable them to sense sleep-wake signals from other parts of the brain and to generate their own signals. In fact, each astrocyte can communicate with thousands of neurons at once. They are therefore well-poised to coordinate brain activity during NREM sleep. Using innovative tools, Vaidyanathan et al. visualized astrocyte activity in mice as the animals woke up or fell asleep. The results showed that astrocytes change their activity just before each sleep–wake transition. They also revealed that astrocytes control both the depth and duration of NREM sleep via two different types of GPCR signals. Increasing one of these signals (Gi-GPCR) made the mice sleep more deeply but did not change sleep duration. Decreasing the other (Gq-GPCR) made the mice sleep for longer but did not affect sleep depth. Sleep problems affect many people at some point in their lives, and often co-exist with other conditions such as mental health disorders. Understanding how the brain regulates different features of sleep could help us develop better – and perhaps more specific – treatments for sleep disorders. The current study suggests that manipulating GPCRs on astrocytes might increase sleep depth, for example. But before work to test this idea can begin, we must first determine whether findings from sleeping mice also apply to people.


Conflict of interest statement

TV, MC, SY, MR, KP No competing interests declared

Figures

Figure 1.
Figure 1.. Cortical astrocyte Ca2+ event rate and SWA are negatively correlated across behavioral states.
(A) Experimental in vivo imaging and electrophysiology setup. Mice expressing astrocytic GCaMP6f were head-fixed on a horizontal treadmill to record astrocyte Ca2+, LFP, EMG, and locomotion. (B) Left: example image of GCaMP6F expression in L2/3 V1 astrocytes in an awake, head-fixed mouse. Right: example of LFP, EMG, locomotion, and astrocyte Ca2+ event data using this experimental setup. (C) Left: AQuA (Wang et al., 2019) detects astrocyte Ca2+ events in 3 min GCaMP time series. Right: representative spatiotemporal plot of AQuA-identified Ca2+ events displaying event time and duration on the x-axis, and the unidimensional (y) spatial extent on the y-axis. Events are color-coded by behavioral state (wake=blue, NREM sleep=pink). Inset demonstrates that event count throughout paper is quantified using event onset. (D) Ca2+ event rate and SWA are negatively correlated (Pearson’s correlation, p<0.0005). Each point represents a single 2 min bin (for all data in this figure except panel I, n = 4 mice, 19 hr). (E) Example of Ca2+ event rate (bottom row) across three behavioral states: NREM sleep, locomotory wake, and stationary wake. (F) Across animals, Ca2+ event rate is lowest during sleep, higher during stationary wake, and highest during locomotory wake, while (G) the inverse is true for SWA (for F and G, rank sum test, data are represented as median, 25th and 75th percentile). (H) Ca2+ event rate and SWA are negatively correlated within each behavioral period: sleep (red, Pearson’s correlation, p<0.0005) and stationary wake (cyan, Pearson’s correlation, p<0.0005) (I), but Ca2+ events in IP3R2 KO mice are less correlated with SWA in sleep (Pearson’s correlation, p<0.0005) and stationary wake (Pearson’s correlation, p>0.05, n = 5 mice, 22 hr).
Figure 1—figure supplement 1.
Figure 1—figure supplement 1.. PCA reveals that behavioral states can be characterized by unique properties of astrocyte Ca2+ events.
(A) Individual quantification of Ca2+ event size (top left), duration (top right), and amplitude (bottom) across sleep, stationary wake, and locomotory wake reveal significant differences in size and duration between locomotory wake and the other two states, but no difference between sleep and stationary wake (rank sum test). Data are represented as median, 25th and 75th percentile (n = 4 mice, 19 hr, 1089 locomotory wake periods, 443 stationary wake periods, 285 sleep periods). (B) Top: Weight matrix extracted from PCA, incorporating 20 Ca2+ event properties obtained with AQuA (n = 4 mice, 19 hr, 87,189 events). PC 1 largely represents spatial features, PC 2 represents temporal features, and PC 3 represents features associated with amplitude. Bottom: Percent of variance explained by each PC. (C) Cumulative distribution of the score for each PC for sleep, stationary wake, and locomotory wake events demonstrates significant differences among all three states (two-sample Kolmogorov-Smirnov test).
Figure 2.
Figure 2.. Astrocyte Ca2+ events characterize transitions from low to high SWA.
(A) Example of SWA obtained by filtering LFP (0.5–4 Hz) recordings (top), with corresponding astrocyte Ca2+ events (bottom). Behavioral state denoted by color: sleep (red) and wake (locomotory in blue, stationary in cyan). (B) Example traces of SWA fluctuations for each behavioral state (top) and raster plot of Ca2+ events (below) to demonstrate that across behavioral states, SWA fluctuates at similar levels. (C) Left: Average Ca2+ event-triggered traces reveal astrocyte Ca2+ event onsets occur after a relative decrease in SWA and are followed by an increase in SWA during sleep (red) and stationary wake (cyan). Right: This relationship is diminished in IP3R2 KO mice, where less modulation around Ca2+ events is observed. Line width=SEM (control: n = 4 mice, 19 hr; IP3R2 KO: n = 5 mice, 22 hr). (D) SWA modulation across the 2 s before and after Ca2+ onset demonstrates modulation is highest during sleep (red) and dependent on expression of IP3R2 (rank sum test, data represented as mean± SEM).
Figure 3.
Figure 3.. Astrocytic Gi-DREADD-driven Ca2+ increases are sufficient to increase SWA during sleep.
(A) Experimental setup. Mice were co-injected with GFAP-cyto-GCaMP6f and GFAP-hM4D(Gi)-mCherry AAVs. After I.P. injection of either 1 mg/kg CNO or saline, astrocyte Ca2+, LFP, EMG, and locomotion were recorded. (B) Post-experiment immunohistochemistry demonstrates astrocyte-specific expression of Gi-DREADD and GCaMP6f. mCherry+ cells (red) exhibit typical astrocyte morphology and do not co-localize with neurons (NeuN, blue). (C) Representative astrocyte Ca2+ response in one animal in which CNO (pink, bottom) causes increased Ca2+ events compared with saline (gray, top). (D) Left: Cumulative Ca2+ event count for all mice after CNO (pink) shows higher event rate compared to saline (gray). Error bars=SEM. (n = 10 mice, 1 hr recordings). Right: Change in event rate for each mouse with CNO compared to saline (paired t-test). For panels D–J, data are represented by the mean for each individual animal, and the population as mean± SD. (E) Left: Administration of CNO (pink) results in rightward shift of the SWA distribution during sleep compared to saline (gray), using 5 s bins. Right: Summary statistics, by animal, show increased SWA during sleep after CNO. (for panels E–H, n = 9 mice, 2 hr recordings, paired t-test) (F) Percent time in NREM sleep does not differ between saline and CNO conditions. (G) Distribution of SWA (left) and summary statistics across mice (right) show that SWA during wake, in contrast with sleep (E), is unchanged between conditions. (H) Percent time awake, similar to time in NREM sleep (F), is similar between conditions. (I) CNO administration (orange) in IP3R2 KO mice expressing astrocytic Gi-DREADDs causes no significant change in Ca2+ event number compared to saline (gray) as shown by the cumulative event count (left, error bars = SEM) and summary statistics per mouse (right, paired t-test) (for experiments in I–J, n = 5 mice, 2 hr recordings). (J) Distribution of SWA during sleep (left) and summary statistics (right) show that, in contrast to controls (E), sleep SWA is unchanged between saline (gray) and CNO (orange) conditions in IP3R2 KO mice (paired t-test).
Figure 3—figure supplement 1.
Figure 3—figure supplement 1.. Astrocyte-specific expression of Gi-DREADDs across ipsilateral and contralateral cortex.
(A) Representative post-experiment immunohistochemistry demonstrating widespread astrocyte-specific expression of Gi-DREADDs across cortical layers. Note stereotypical bush-like astrocytic morphology of mCherry+ cells. (B) Representative ×63 magnification confocal immunohistochemistry images of mCherry (red) and NeuN (blue) staining used to identify non-specific expression of DREADDs. (C) Percentage of NeuN+ identified cells that were also mCherry+. (D) Schematic demonstrating analysis of cortex-wide Gi-DREADD expression spread on the hemisphere ipsilateral and contralateral to the viral injection site. (E) Expression spread in brain slices sampled from rostral to caudal for the ipsilateral (top, cyan) and contralateral hemisphere (bottom, orange) demonstrates expression is highest in the ipsilateral rostral brain areas, near the LFP recording site (dashed line, cyan). There is no expression near the FC-EEG recording site (dashed line, yellow). Expression spread for each slice was calculated by normalizing the number of fluorescent pixels to the size of the brain tissue. Data represented with boxplots marking the medians, 25th and 75th percentiles. (F) Distribution of SWA (left), and summary statistics across mice (right, paired t-test) show that SWA during stationary wake, similar to all wake (Figure 3G) and in contrast with sleep (Figure 3E), is unchanged between saline and CNO conditions (n = 9 mice, 2 hr recordings). Data represented by mean for each animal and population mean± SD.
Figure 3—figure supplement 2.
Figure 3—figure supplement 2.. Systemic administration of CNO does not affect astrocyte Ca2+ dynamics, SWA, or sleep and wake behavior.
(A) Experimental setup. Mice were injected with only GFAP-cyto-GCaMP6f AAV. After I.P. injection of either 1 mg/kg CNO or saline, astrocyte Ca2+, LFP, EMG, and locomotion were recorded to assess effects of CNO. (B) Example astrocyte Ca2+ response in one animal in which CNO (green, bottom) does not change Ca2+ event number compared with saline (gray, top). (C) Ca2+ event rate with CNO demonstrates no significant change across mice compared to saline (paired t-test, data represent mean for each mouse and population mean± SD, n = 6 mice, 2 hr recordings) (D) Cumulative Ca2+ event count for all mice shows no change between CNO (green) and saline (gray) conditions (error bars=SEM, n = 6 mice, 1 hr recordings). (E) Left: Administration of CNO (green) does not change SWA distribution during sleep compared to saline (gray), using 5 s bins. Right: Summary statistics show no change in SWA during sleep after CNO (for E–H, data represented by mean for each animal and population mean± SD, n = 6 mice, 2 hr recordings, paired t-test). (F) Left: CNO (green) does not change SWA distribution during wake compared to saline (gray), using 5 s bins. Right: No change in SWA during wake after CNO. (G) Time spent in NREM sleep (left), mean sleep bout length (middle), and mean sleep bout number (right) do not differ between saline and CNO conditions. (H) Time spent in wake (left), mean wake bout length (middle), and mean wake bout number (right) do not differ between saline and CNO conditions.
Figure 3—figure supplement 3.
Figure 3—figure supplement 3.. PCA shows that Gi-DREADD activation causes increased changes in Ca2+ event properties during sleep compared to wake.
(A) Top: Weight matrix extracted from PCA, incorporating 20 Ca2+ event properties obtained with AQuA (n = 10 mice; 2 hr recordings; 204,172 events). PC 1 largely represents spatial features, PC 2 represents temporal features, and PC 3 represents features associated with amplitude. Bottom: Percent of variance explained by each PC. (B) Top: Cumulative distribution of the score for each PC for sleep events after saline or CNO administration, demonstrating clear differences in multiple PCs compared with wake (bottom). Bottom: Cumulative distribution of the score for each PC for wake events is similar between saline and CNO (n = 10 mice for saline, nine mice for CNO condition, 2 hr recordings; 33,882 sleep events; 153,646 wake events). (C) K-S distance between the saline and CNO distributions in panel B demonstrates significant differences between sleep and wake in the effect of CNO on PC 2, PC 4, and PC 5 (Wilcoxon signed rank test, n = 9 mice, median event number/mouse = 4139).
Figure 4.
Figure 4.. Astrocytic Gi-DREADD activation regulates local delta waves more than slow oscillations.
(A) Mean of all identified slow oscillations (orange) and delta waves (cyan) (n = 31,966,966 delta waves, 7855 slow oscillations) in saline condition, including mean LFP amplitude filtered for high-gamma (gray, 80–100 Hz) demonstrating lower gamma during DOWN state and higher gamma during UP state (for panels A–C, n = 10 mice, 38 hr). (B) Peak amplitude separation between slow oscillations and delta waves. (C) Peak vs. trough amplitude for slow oscillations and delta waves is separable by K-means clustering (dashed line). (D) Left: Example of filtered LFP (0.1–4 Hz) for a 20-min recording. Slow oscillations (orange) and delta waves (cyan) indicated. Right: A 10 s window corresponding to the red box, with example waveforms of individual slow oscillations and delta waves. (E) Delta wave (left) and slow oscillation (right) rates do not change between conditions (for panels E; H, left; K, left; and L, data represented by mean for each animal, and the population as mean± SD, n = 9 mice 2 hr recordings, paired t-test). (F) Delta waves with CNO (cyan) show higher peak and trough amplitude compared with saline (gray) (saline: n = 10 mice, 16,467 waveforms; CNO: n = 9 mice, 15,499 waveforms). (G) Peak vs. trough amplitude for delta waves after CNO (cyan) is shifted compared with saline controls (gray) (for panels G; H, right; J; K, right, saline: n = 10 mice, 257 sleep periods, CNO: n = 9 mice, 246 sleep periods). (H) Left: Peak minus trough delta wave amplitude is higher with CNO. Right: Cumulative distribution reveals a leftward shift in the peak minus trough delta wave amplitude with CNO (two-sample Kolmogorov-Smirnov test). (I) Slow oscillations show minimal peak and trough amplitude change with CNO (orange) relative to saline (gray), compared with delta waves (F) (saline: n = 10 mice, 3995 waveforms, CNO: n = 9 mice, 3860 waveforms). (J) Peak versus trough amplitude for slow oscillations is similar between CNO (orange) and saline (gray) conditions, compared with delta waves (G). (K) Left: Peak minus trough slow oscillation amplitude shows a smaller, but significant, increase with CNO compared with delta waves (H left). Right: Cumulative distribution reveals a minimal shift in the peak minus trough slow oscillation amplitude after CNO administration, compared with delta waves (H, right) (two-sample Kolmogorov-Smirnov test). (L) Higher percent change for delta waves in peak minus trough amplitude with CNO, compared to slow oscillations.
Figure 4—figure supplement 1.
Figure 4—figure supplement 1.. Gi-DREADD activation does not affect SWA in stationary wake, but changes peak and trough delta wave amplitude during sleep.
(A) The cumulative distribution (left) and summary statistics across mice (right) show that delta wave peak amplitude is significantly higher with CNO compared to saline (for panels A–D, n = 10 mice, 38 total hrs for cumulative distribution plots, two-sample Kolmogorov-Smirnov test. n = 9 mice, 2 hr recordings/mouse, paired t-test for the remaining figures). (B) Similar to (A), cumulative distribution (left) and summary statistics across mice (right) reveal significantly lower trough amplitude after CNO administration relative to saline. (C) The cumulative distribution (left) shows a significant but smaller shift in slow oscillation peak amplitude with CNO compared to delta waves shown in (A). Summary statistics across mice show no significant change in slow oscillation peak amplitude between conditions. (D) Similar to (C), the cumulative distribution (left) and summary statistics across mice (right) demonstrate a significant, but smaller, change in slow oscillation trough amplitude compared with delta wave trough amplitude (B). For all panels with summary statistics, data represented by mean for each animal and population mean± SD.
Figure 5.
Figure 5.. Cortical astrocyte Ca2+ dynamics exhibit bidirectional changes preceding sleep and wake transitions.
(A) Within each individual sleep/wake period, the proportion of all astrocyte Ca2+ events increases before transitions to wake (red) and decreases before transitions to sleep (blue). Error bars=SEM. (B) In contrast, the proportion of all Ca2+ events in a sleep or wake period in IP3R2 KO mice does not consistently change preceding transitions. Error bars=SEM. (C) Example filtered LFP (0.5–4 Hz) trace across sleep (NREM) and wake transitions. All sleep (red) and wake (blue) periods were divided in three equal bins to examine Ca2+ dynamics across individual behavioral states. (D) Change in Ca2+ event number across sleep and wake periods show an increase in event number in the last third of sleep (left) and a decrease in the last third of wake (right) (paired t-test). Change in Ca2+ event number across sleep periods (left) increases in the last third for control, but not IP3R2 KO mice (unpaired t-test). Data are represented as mean± SEM (controls: n = 4 mice, 19 hr; IP3R2 KO = 5 mice, 22 hr).
Figure 6.
Figure 6.. Gq-induced Ca2+ is necessary for sleep-wake transitions.
(A) Experimental setup. Mice were co-injected with GFAP-cyto-GCaMP6f and GFAP-hM3D(Gq)-mCherry AAVs. After I.P. injection of either 1 mg/kg CNO or saline, 2P astrocyte Ca2+ dynamics, LFP, EMG, and locomotion were recorded. (B) Post-experiment immunohistochemistry demonstrates astrocyte-specific expression of the Gq-DREADD (red) and GCaMP6f (green). mCherry+ cells exhibit typical astrocyte morphology and do not co-localize with neurons (blue, NeuN). (C) Representative data from a single Gq-DREADD-expressing animal. Administration of CNO (blue) causes a short initial period of elevated Ca2+ relative to saline administration (gray), followed by a complete suppression of all Ca2+ activity. (D) Cumulative Ca2+ event count after saline (gray) or CNO (blue) injection over 60 min. The initial high Ca2+ period (8 min, light gray box) is followed by suppression of astrocyte Ca2+. (Error bars=SEM, n = 3 mice, 1 hr recordings) (E) Left: The proportion of time mice spend sleeping after CNO administration (during Ca2+ suppression period) is increased relative to saline controls, and time in wake is decreased (right), suggesting Ca2+ suppression is sufficient to increase sleep (for E–F, and H, paired t-test, n = 11 mice; analyses are performed in the 1 hr, 52-min period of Ca2+ suppression). (F) Sleep-to-wake transitions (left) and wake-to-sleep transitions (right) are decreased with CNO relative to saline. (G) During the high Ca2+ period after CNO administration, mice spend less time sleeping compared to saline-injected controls (paired t-test), suggesting the Gq-DREADD-driven Ca2+ increase is sufficient to suppress sleep (n = 4 mice, for E–H, data are represented as mean for each animal and population mean± SD). (H) Distribution of SWA (left) and summary statistics (right) show that despite Ca2+ changes, SWA during sleep is unaffected by Gq-DREADD activation. (n = 8 mice, paired t-test).
Figure 6—figure supplement 1.
Figure 6—figure supplement 1.. Astrocyte-specific expression of Gq-DREADDs across ipsilateral and contralateral cortex.
(A) Representative post-experiment immunohistochemistry demonstrating astrocyte-specific expression of Gq-DREADDs across cortical layers. (B) Representative 63x confocal images of mCherry and NeuN staining to quantify non-specific DREADD expression. (C) Percentage of NeuN+ identified cells that were also mCherry+. (D) Schematic illustrating analysis of cortex-wide Gq-DREADD expression spread in hemispheres both ipsilateral and contralateral to viral injection site. (E) Expression spread in brain slices sampled from rostral to caudal for the ipsilateral (top, cyan) and contralateral hemisphere (bottom, orange) shows that expression is highest in ipsilateral rostral cortex, near the LFP recording site (dashed line, cyan). No expression is detected at the FC-EEG recording site (dashed line, yellow). Viral expression spread for each slice was calculated by normalizing the number of fluorescent pixels to the size of the brain tissue. Data represented with boxplots marking the medians, 25th and 75th percentiles. (F) Cumulative Ca2+ event count for mice after administration of 0.1 mg/kg CNO (red) and saline (gray) showing an initial period of elevated Ca2+ (gray box), followed by a dramatic suppression of Ca2+ events similar to 1 mg/kg CNO (Error bars=SEM, n = 3 mice, 1 hr recordings). (G) Cumulative Ca2+ event count for mice after 1 mg/kg CNO (red) and saline (gray), as shown in Figure 5D (Error bars=SEM, n = 3 mice, 1 hr recordings). (H) Total suppression of astrocyte Ca2+ event rate is similar for all three tested doses of CNO (mean± SEM, 0.1 mg/kg: n = 3 mice, 2 hr recordings; 0.5 mg/kg: n = 1 mouse, 2 hr recordings; 1 mg/kg: n = 5 mice, 2 hr recordings). (I) Mean GCaMP6f fluorescence in somata and processes after administration of 1 mg/kg CNO, with both remaining elevated throughout 1 hr recording (Error bars=SEM, n = 3 mice, 1 hr recordings). (J) Left: Representative 2P image of V1 cortical astrocytes in an acute, ex vivo slice. Right: Cumulative events across two consecutive 5 min videos demonstrating a large response to the first application of a ‘wake’ cocktail (black triangles), but not the second (error bars=SEM, n = 2 mice, eight slices).
Figure 6—figure supplement 2.
Figure 6—figure supplement 2.. Gq-DREADD activation suppresses sleep-wake transitions by increasing bout length and decreasing bout number.
(A) Left: Mean sleep bout length after CNO administration is increased compared to saline controls, suggesting Ca2+ dynamics are necessary for sleep-to-wake transitions. Right: Mean sleep bout number observed after CNO administration is decreased compared to saline controls. For all panels, n = 11 mice. Analyses are performed during the 1 hr, 52 min period when Ca2+ is suppressed, all paired t-tests. (B) Left: Mean wake bout length after CNO administration is increased relative to saline, suggesting Ca2+ dynamics are necessary for wake-to-sleep transitions, similar to sleep-to-wake transitions in (A). Right: Mean number of wake bouts after CNO, and during Ca2+ suppression, is decreased relative to saline.
Figure 7.
Figure 7.. V1 manipulation of astrocyte Ca2+ alters SWA in contralateral frontal cortex via changes in slow oscillations.
(A) Experimental setup. Mice were co-injected with GFAP-cyto-GCaMP6f and GFAP-hM4D(Gi)-mCherry AAVs. 2P astrocyte Ca2+ dynamics in right V1, LFP local to the imaging field, EEG in the contralateral frontal cortex (orange), EMG, and locomotion were recorded. (B) Representative data from simultaneous recordings from V1-LFP (black), contralateral frontal cortex EEG (orange), and V1 astrocyte Ca2+ imaging (green). (C) Average V1-Ca2+ event-triggered traces of FC-EEG SWA (orange) reveal a similar, but smaller, fluctuation of SWA around Ca2+ event onsets compared with V1-LFP (black). (D) Coherence between V1-LFP and FC-EEG is higher after astrocyte event onset (green), compared to randomly sampled time points (gray) (paired t-test, n = 13 mice, median event number/mouse = 7512,512 events). Error bars=SEM. (E) Astrocyte-locked coherence (0–15 Hz) increases before sleep-to-wake transitions (unpaired t-test, n = 13 mice, median event number/mouse = 417 events). (F) Left: Example spectrograms from simultaneously recorded population-level electrophysiology: V1-LFP (top row) and FC-EEG (bottom row) following saline (left column) or CNO (right column) injection. Right: SWA corresponding to the black rectangle marked in the spectrograms demonstrates that CNO (pink) increased SWA in V1-LFP (solid lines) and FC-EEG (dashed lines) compared to saline (gray). (G) Distribution of SWA (left) and summary statistics across mice (right, paired t-test) demonstrate that SWA in FC-EEG is increased after activation of V1 Gi-DREADD-expressing astrocytes by CNO (data represented as mean for each animal and population mean± SD, n = 7 mice, 2 hr recordings). (H) Change in SWA measured by V1-LFP or FC-EEG demonstrate that CNO increases SWA in both measurements, but more in V1-LFP recordings (paired t-test). Data represented using box plots with median, 25th and 75th percentile. (I) Peak-to-trough amplitude for delta waves (cyan, left) and slow oscillations (yellow, right) in saline (gray) and CNO conditions in FC (paired t-test). (J) Percent change in peak-trough amplitude for delta waves (cyan) and slow oscillations (yellow) in CNO vs. saline (paired t-test, data represented as mean± SEM). There is a greater change in amplitude for slow oscillations than delta waves in FC after Gi-DREADD activation in V1.
Author response image 1.
Author response image 2.

References

    1. Adamsky A, Kol A, Kreisel T, Doron A, Ozeri-Engelhard N, Melcer T, Refaeli R, Horn H, Regev L, Groysman M, London M, Goshen I. Astrocytic activation generates de novo neuronal potentiation and memory enhancement. Cell. 2018;174:59–71. doi: 10.1016/j.cell.2018.05.002. - DOI - PubMed
    1. Agulhon C, Petravicz J, McMullen AB, Sweger EJ, Minton SK, Taves SR, Casper KB, Fiacco TA, McCarthy KD. What is the role of astrocyte calcium in neurophysiology? Neuron. 2008;59:932–946. doi: 10.1016/j.neuron.2008.09.004. - DOI - PMC - PubMed
    1. Allen NJ, Barres BA. Signaling between Glia and neurons: focus on synaptic plasticity. Current Opinion in Neurobiology. 2005;15:542–548. doi: 10.1016/j.conb.2005.08.006. - DOI - PubMed
    1. Amzica F, Steriade M. Short- and long-range neuronal synchronization of the slow ( Journal of Neurophysiology. 1995;73:20–38. - PubMed
    1. Arganda-Carreras I, Kaynig V, Rueden C, Eliceiri KW, Schindelin J, Cardona A, Sebastian Seung H. Trainable weka segmentation: a machine learning tool for microscopy pixel classification. Bioinformatics. 2017;33:2424–2426. doi: 10.1093/bioinformatics/btx180. - DOI - PubMed

Publication types

Substances