The temporal association of introducing and lifting non-pharmaceutical interventions with the time-varying reproduction number (R) of SARS-CoV-2: a modelling study across 131 countries
- PMID: 33729915
- PMCID: PMC7581351
- DOI: 10.1016/S1473-3099(20)30785-4
The temporal association of introducing and lifting non-pharmaceutical interventions with the time-varying reproduction number (R) of SARS-CoV-2: a modelling study across 131 countries
Abstract
Background: Non-pharmaceutical interventions (NPIs) were implemented by many countries to reduce the transmission of severe acute respiratory syndrome coronavirus 2 (SARS-CoV-2), the causal agent of COVID-19. A resurgence in COVID-19 cases has been reported in some countries that lifted some of these NPIs. We aimed to understand the association of introducing and lifting NPIs with the level of transmission of SARS-CoV-2, as measured by the time-varying reproduction number (R), from a broad perspective across 131 countries.
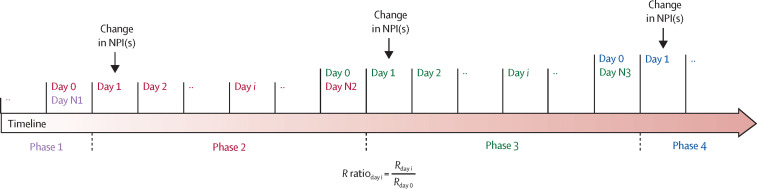
Methods: In this modelling study, we linked data on daily country-level estimates of R from the London School of Hygiene & Tropical Medicine (London, UK) with data on country-specific policies on NPIs from the Oxford COVID-19 Government Response Tracker, available between Jan 1 and July 20, 2020. We defined a phase as a time period when all NPIs remained the same, and we divided the timeline of each country into individual phases based on the status of NPIs. We calculated the R ratio as the ratio between the daily R of each phase and the R from the last day of the previous phase (ie, before the NPI status changed) as a measure of the association between NPI status and transmission of SARS-CoV-2. We then modelled the R ratio using a log-linear regression with introduction and relaxation of each NPI as independent variables for each day of the first 28 days after the change in the corresponding NPI. In an ad-hoc analysis, we estimated the effect of reintroducing multiple NPIs with the greatest effects, and in the observed sequence, to tackle the possible resurgence of SARS-CoV-2.
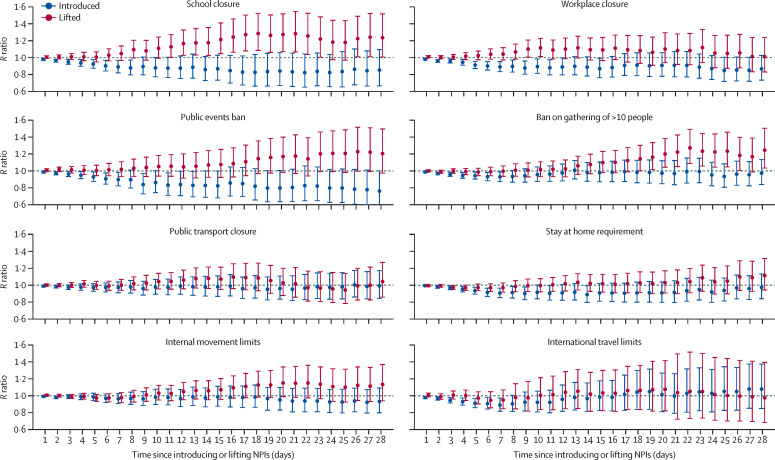
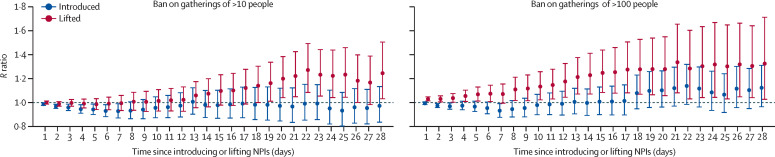
Findings: 790 phases from 131 countries were included in the analysis. A decreasing trend over time in the R ratio was found following the introduction of school closure, workplace closure, public events ban, requirements to stay at home, and internal movement limits; the reduction in R ranged from 3% to 24% on day 28 following the introduction compared with the last day before introduction, although the reduction was significant only for public events ban (R ratio 0·76, 95% CI 0·58-1·00); for all other NPIs, the upper bound of the 95% CI was above 1. An increasing trend over time in the R ratio was found following the relaxation of school closure, bans on public events, bans on public gatherings of more than ten people, requirements to stay at home, and internal movement limits; the increase in R ranged from 11% to 25% on day 28 following the relaxation compared with the last day before relaxation, although the increase was significant only for school reopening (R ratio 1·24, 95% CI 1·00-1·52) and lifting bans on public gatherings of more than ten people (1·25, 1·03-1·51); for all other NPIs, the lower bound of the 95% CI was below 1. It took a median of 8 days (IQR 6-9) following the introduction of an NPI to observe 60% of the maximum reduction in R and even longer (17 days [14-20]) following relaxation to observe 60% of the maximum increase in R. In response to a possible resurgence of COVID-19, a control strategy of banning public events and public gatherings of more than ten people was estimated to reduce R, with an R ratio of 0·71 (95% CI 0·55-0·93) on day 28, decreasing to 0·62 (0·47-0·82) on day 28 if measures to close workplaces were added, 0·58 (0·41-0·81) if measures to close workplaces and internal movement restrictions were added, and 0·48 (0·32-0·71) if measures to close workplaces, internal movement restrictions, and requirements to stay at home were added.
Interpretation: Individual NPIs, including school closure, workplace closure, public events ban, ban on gatherings of more than ten people, requirements to stay at home, and internal movement limits, are associated with reduced transmission of SARS-CoV-2, but the effect of introducing and lifting these NPIs is delayed by 1-3 weeks, with this delay being longer when lifting NPIs. These findings provide additional evidence that can inform policy-maker decisions on the timing of introducing and lifting different NPIs, although R should be interpreted in the context of its known limitations.
Funding: Wellcome Trust Institutional Strategic Support Fund and Data-Driven Innovation initiative.
Copyright © 2021 Elsevier Ltd. All rights reserved.
Figures
Comment in
-
Multiple testing and the effect of NPIs on the spread of SARS-CoV-2.Lancet Infect Dis. 2021 Apr;21(4):458. doi: 10.1016/S1473-3099(20)30935-X. Epub 2021 Jan 6. Lancet Infect Dis. 2021. PMID: 33421365 Free PMC article. No abstract available.
References
-
- Flaxman S, Mishra S, Gandy A, et al. Estimating the effects of non-pharmaceutical interventions on COVID-19 in Europe. Nature. 2020;584:257–261. - PubMed
-
- Karnakov P, Arampatzis G, Kiĕić I, et al. Data-driven inference of the reproduction number for COVID-19 before and after interventions for 51 European countries. Swiss Med Wkly. 2020;150 - PubMed
Publication types
MeSH terms
LinkOut - more resources
Full Text Sources
Other Literature Sources
Medical
Miscellaneous