. 2021 Mar 17;19(3):e3001143.
doi: 10.1371/journal.pbio.3001143. eCollection 2021 Mar.

Single-cell longitudinal analysis of SARS-CoV-2 infection in human airway epithelium identifies target cells, alterations in gene expression, and cell state changes

Affiliations

Single-cell longitudinal analysis of SARS-CoV-2 infection in human airway epithelium identifies target cells, alterations in gene expression, and cell state changes

Neal G Ravindra et al. PLoS Biol. .

Abstract

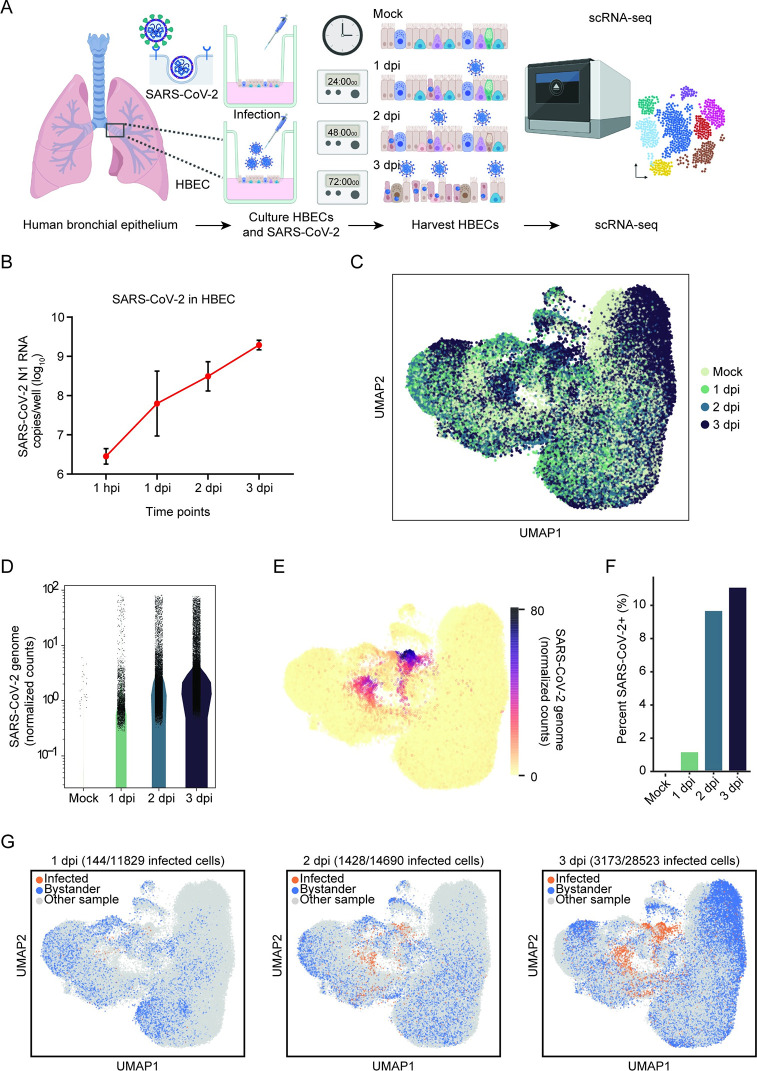
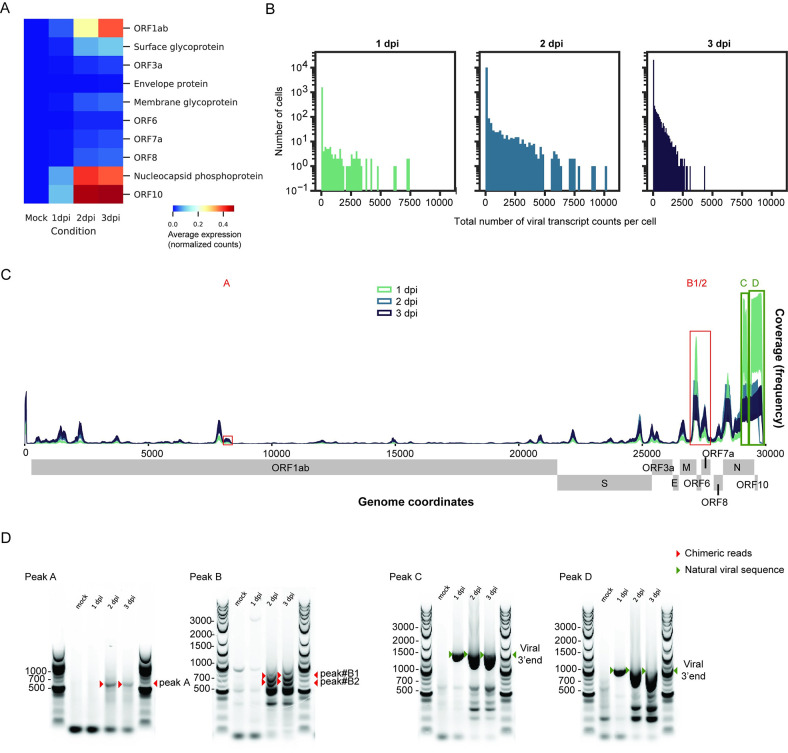
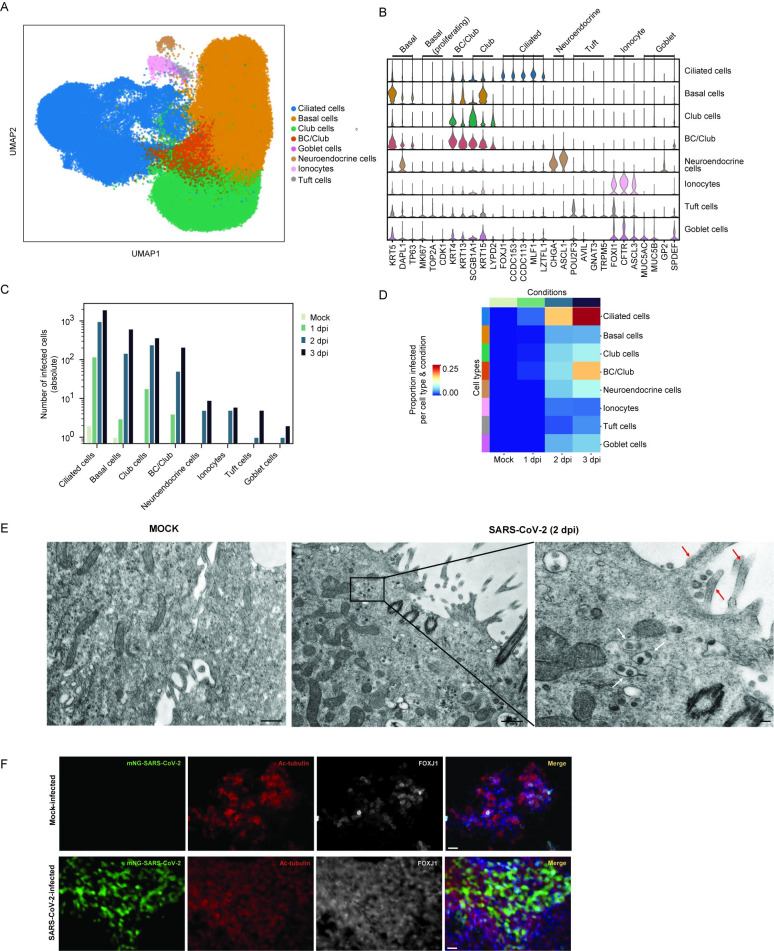
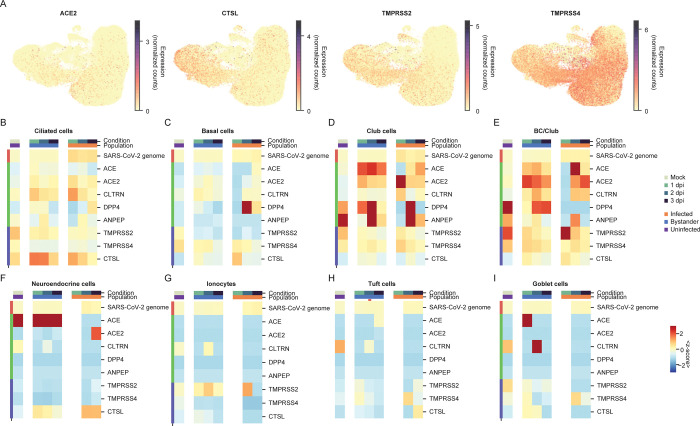
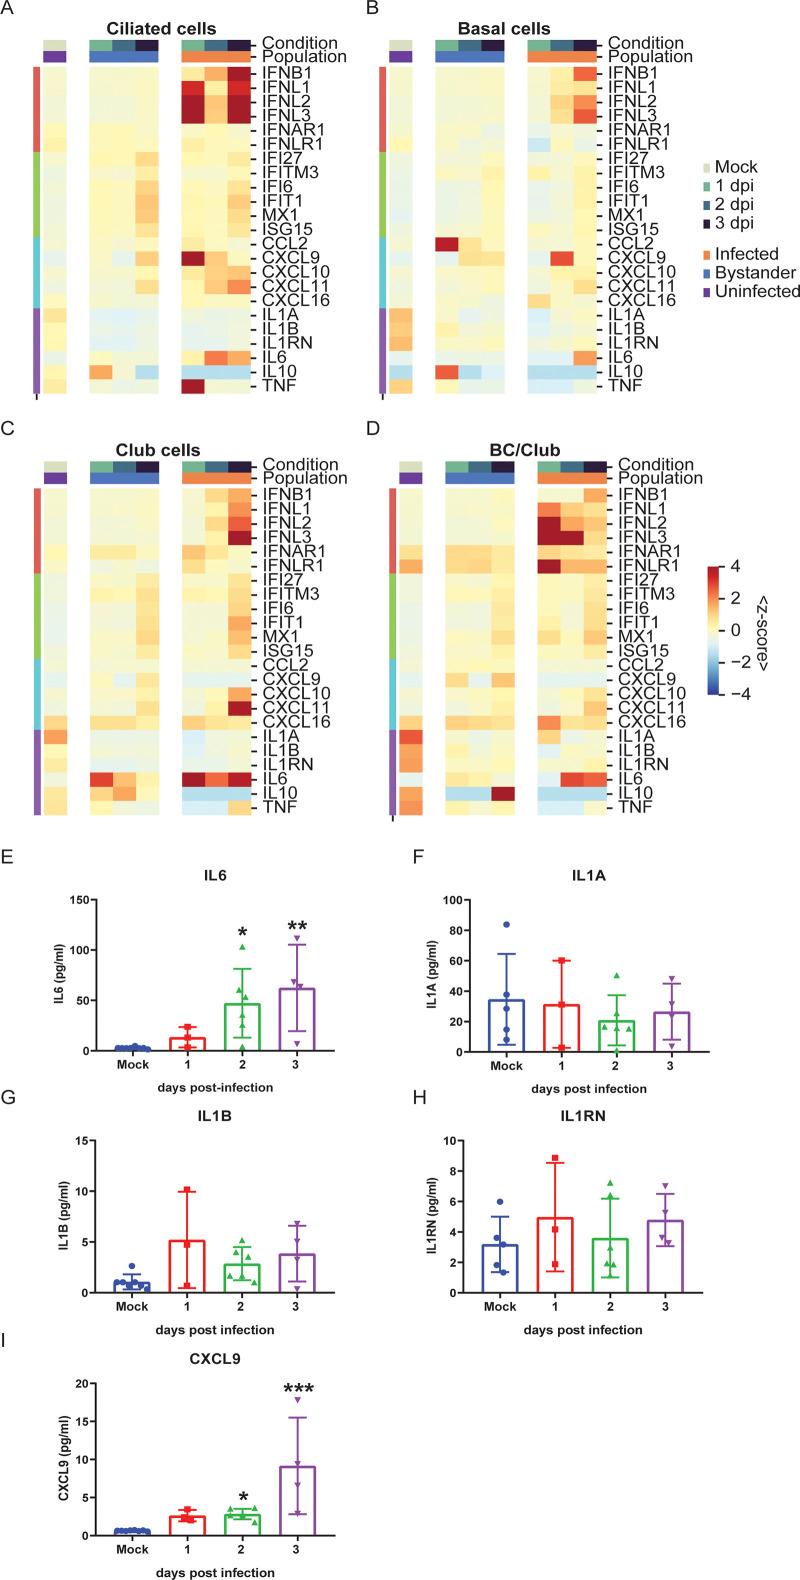
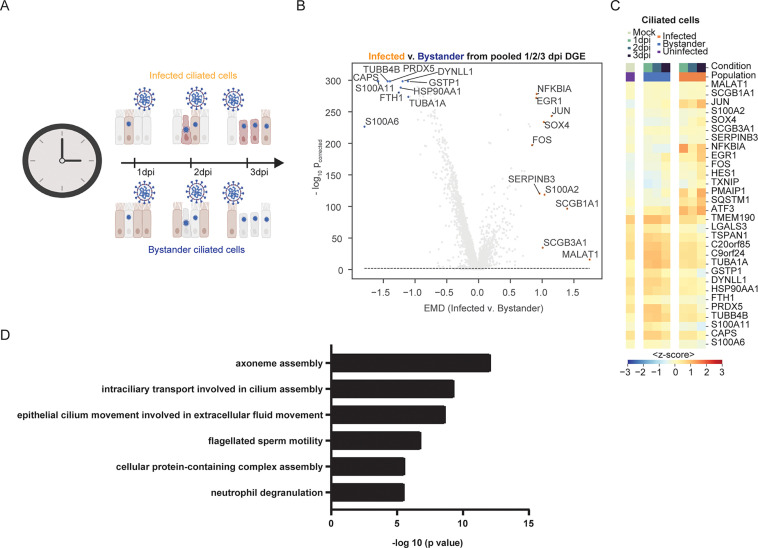
There are currently limited Food and Drug Administration (FDA)-approved drugs and vaccines for the treatment or prevention of Coronavirus Disease 2019 (COVID-19). Enhanced understanding of Severe Acute Respiratory Syndrome Coronavirus 2 (SARS-CoV-2) infection and pathogenesis is critical for the development of therapeutics. To provide insight into viral replication, cell tropism, and host-viral interactions of SARS-CoV-2, we performed single-cell (sc) RNA sequencing (RNA-seq) of experimentally infected human bronchial epithelial cells (HBECs) in air-liquid interface (ALI) cultures over a time course. This revealed novel polyadenylated viral transcripts and highlighted ciliated cells as a major target at the onset of infection, which we confirmed by electron and immunofluorescence microscopy. Over the course of infection, the cell tropism of SARS-CoV-2 expands to other epithelial cell types including basal and club cells. Infection induces cell-intrinsic expression of type I and type III interferons (IFNs) and interleukin (IL)-6 but not IL-1. This results in expression of interferon-stimulated genes (ISGs) in both infected and bystander cells. This provides a detailed characterization of genes, cell types, and cell state changes associated with SARS-CoV-2 infection in the human airway.


Conflict of interest statement

Yale University (CBW) has a patent pending related to this work entitled: “Compounds and Compositions for Treating, Ameliorating, and/or Preventing SARS-CoV-2 Infection and/or Complications Thereof.” Yale University has committed to rapidly executable non-exclusive royalty-free licenses to intellectual property rights for the purpose of making and distributing products to prevent, diagnose and treat COVID-19 infection during the pandemic and for a short period thereafter.

Figures

Fig 1
Fig 1. scRNA-seq reveals SARS-CoV-2 infection in HBECs.
(A) Experimental process for longitudinal scRNA-seq. HBECs in ALI cultures were mock-infected or infected with 104 PFU of SARS-CoV-2. Cells were then harvested at 1, 2, and 3 dpi and processed via scRNA-seq using the 10x Genomics platform. (B) HBEC ALI cultures were infected with 104 PFU SARS-CoV-2 and harvested at 1 hpi, 1, 2, and 3 dpi. Viral transcripts were detected by real-time quantitative PCR using primers specific for the nucleocapsid gene. (C) UMAP visualization of cells after batch correction with BB-kNN. Each dot represents a cell; color represents the given time post-infection. (D) Normalized and square-root transformed counts of the SARS-CoV-2 viral genome in mock, 1, 2, and 3 dpi samples. Viral counts in each cell were determined by aligning reads to a single, genome-wide reference. (E) UMAP visualization of the normalized and square-root transformed counts of SARS-CoV-2 reads (color). (F) Percent of cells infected by SARS-CoV-2 in mock, 1, 2, and 3 dpi; cells were considered infected if they had greater than 10 SARS-CoV-2 full-length genome counts. (G) UMAP visualizations of infected (orange) and bystander cells (blue) in each time point after batch correction. The number of infected cells over time is indicated in each time point. Bystander cells are defined as cells that remain uninfected in HBEC samples challenged with SARS-CoV-2. The individual numerical value per condition for C–G is listed in S1 Data. Illustration for Fig 1A was created using BioRender.com. ALI, air–liquid interface; BB-kNN, batch-balanced kNN; dpi, days post-infection; HBEC, human bronchial epithelial cell; hpi, hour post-infection; PFU, plaque forming unit; SARS-CoV-2, Severe Acute Respiratory Syndrome Coronavirus 2; scRNA-seq, single-cell RNA sequencing; UMAP, Uniform Manifold Approximation and Projection.
Fig 2
Fig 2. SARS-CoV-2 transcriptome analysis reveals noncanonical transcripts.
(A) Heatmap showing average expression (normalized and square-root transformed counts) for reads aligned to individual viral ORFs at each time point. (B) Histograms of viral transcript raw counts per cell on a logarithmic scale for 1, 2, and 3 dpi. (C) Coverage plot of SARS-CoV-2 transcriptome at the scRNA-seq level. The sequencing depth was computed for each genomic position for each time point. The coverage showed both canonical (near the 3′ end, green boxes) and noncanonical (near the 5′ end) poly-adenylated sgRNAs. Two unique peaks were identified (red boxes). The individual numerical value per condition for A–C is listed in S1 Data. (D) RT-PCR spanning the junctions between poly-A tails and SARS-CoV-2 genome body for noncanonical transcripts (Peaks A, B1/2, red boxes) and 2 positive controls (Peaks C, D, green boxes). The products were run on agarose gels. Red arrowheads denote the expected amplicons for novel transcripts, while green arrowheads denote amplicons for the natural viral 3′ end. The raw images for D can be found in S1 Raw Images. dpi, days post-infection; ORF, open reading frame; RT-PCR, reverse transcription PCR; SARS-CoV-2, Severe Acute Respiratory Syndrome Coronavirus 2; scRNA-seq, single-cell RNA sequencing; sgRNA, subgenomic RNA.
Fig 3
Fig 3. SARS-CoV-2 tropism in primary HBECs reveals ciliated cells as primary target cells.
(A) UMAP visualization of the cell clusters after manual annotation. The UMAP projections of the dataset are color coded by cell type. Eight distinct cell clusters were identified: ciliated, basal, club, a mixture of basal and club cells (BC/Club), goblet, neuroendocrine, ionocytes, and tuft cells. (B) Louvain clusters were annotated with a cell type based on enrichment of canonical cell type markers (see Materials and methods). Violin plots show range-scaled expression (normalized and square-root transformed counts) of marker genes across clusters. (C) Reads mapping to the full SARS-CoV-2 genome were mapped to each of the 8 distinct cell types; cells with greater than or equal to 10 viral transcript counts were considered infected. The absolute number of infected cells in each cell type is plotted and stratified by time point (color). (D) Heatmap, where each row and column represents the proportion of infected cells in a particular cell type and condition (color per row and column represents the number of infected cells divided by the total number of cells in that particular subset). Conditions are color coded as indicated in Fig 1C, and cell types are color coded as depicted in Fig 3A. The individual numerical value per condition for A–D is listed in S1 Data. (E) Transmission electron microscopy image of mock (left) and SARS-CoV-2 HBEC reveal infected ciliated cells at 2 dpi (right). Scale bars correspond to 500 nm. White arrows denote virus particles, and red arrows denote cilia. (F) Immunofluorescence assay of mock- and mNeon-Green SARS-CoV-2 on differentiated HBECs stained with Ac-tubulin (red) and FOXJ1 (white), known markers for ciliated cells. Scale bars correspond to 25 μm. The raw images for E can be found in S2 Raw Images, and raw images for F can be found in S3 Raw Images. Ac-tubulin, acetylated tubulin; dpi, days post-infection; FOXJ1, Forkhead Box J1; HBEC, human bronchial epithelial cell; SARS-CoV-2, Severe Acute Respiratory Syndrome Coronavirus 2; UMAP, Uniform Manifold Approximation and Projection.
Fig 4
Fig 4. Expression of known entry determinants across bronchial epithelial cell types during SARS-CoV-2 infection.
(A) UMAP visualization of HBEC samples, colored by expression (normalized and square-root transformed counts) of the ACE2 receptor, CTSL, TMPRSS2, and TMPRSS4 proteases. (B–I) Heatmaps comparing average expression (represented as a z-score, where each cells’ expression is transformed by subtracting the average and dividing by the standard deviation across the entire dataset) of genes homologous to ACE2 (ACE, ANPEP, and CLTRN) or relevant to other coronaviruses (DPP4; MERS-CoV receptor and ANPEP; and 229E receptor), in ciliated (B), basal (C), club (D), BC/Club cells (E), neuroendocrine (F), ionocytes (G), tuft cells (H), and goblet cells (I) in infected, bystander, and uninfected cells at different time points. The average is calculated with respect to cells in infected, bystander, and uninfected cells in mock, 1, 2, and 3 dpi (color bar legend atop heatmaps). The color scale shows the average expression (represented as z-score) for each cell type and condition. The individual numerical value per condition for A–I is listed in S1 Data. ACE2, angiotensin converting enzyme II; dpi, days post-infection; HBEC, human bronchial epithelial cell; SARS-CoV-2, Severe Acute Respiratory Syndrome Coronavirus 2; TMPRSS2, transmembrane protease serine 2; UMAP, Uniform Manifold Approximation and Projection.
Fig 5
Fig 5. SARS-CoV-2 infection induces a robust innate immune response.
(A–D) Heatmaps showing average expression (represented as z-score) of key innate immune and inflammatory genes in ciliated (A), basal (B), club (C), and BC/club cells (D) in infected, bystander, and uninfected cells in different time points (color bar legend atop heatmaps). Rows index average expression for type I and III IFNs and chemokines (left color bar legend). The individual numerical value per condition for A–D is listed in S1 Data. (E–I) Cytokine and chemokine measurement in basolateral supernatants of HBEC cultures infected with SARS-CoV-2 at 0 (mock), 1, 2, and 3 dpi from 3 independent experiments. SARS-CoV-2 infection induces IL-6 (E) and CXCL9 (I) secretions. Minimal changes in IL-1A (F), IL-1B (G), and IL-1RN (H) secretions are observed. All statistical analysis was performed using Prism GraphPad version 8. Significance compared to mock infection was analyzed using nonparametric Kruskal–Wallis test, indicated with a bar, and the p-value is represented by a symbol (*p < 0.05, **p < 0.01, ***p < 0.001). dpi, days post-infection; HBEC, human bronchial epithelial cell; IFN, interferon; IL, interleukin; SARS-CoV-2, Severe Acute Respiratory Syndrome Coronavirus 2; TNF, tumor necrosis factor.
Fig 6
Fig 6. Expression of DEGs in ciliated cells in response to SARS-CoV-2 infection.
(A) Schematic of the differential expression analysis comparing ciliated cells from the infected and bystander populations. (B) Volcano plots highlighting the most DEGs between infected and bystander populations in ciliated cells pooled from 1, 2, and 3 dpi samples, as ranked by the EMD. The y-axis shows the negative log base-10, Benjamini–Hochberg corrected p-value from a Mann–Whitney U test with a continuity correction, comparing the expression between infected and bystander. The dashed line shows the significance, set at pcorrected ≤ 0.01 (see Materials and methods). (C) Heatmap showing the average expression (represented as z-score) in each condition (color bar legend atop heatmap) of the top 15 differentially up-regulated and top 15 down-regulated genes from the analysis in Fig 6A and 6B. (D) Pathway analysis of top and bottom 200 DEGs which are significantly down-regulated in SARS-CoV-2–infected versus bystander ciliated cells. The analysis was done using the PANTHER GO tool with significance assessed using Fisher exact test. The individual numerical value per condition for A–D is listed in S1 Data. The raw data for generating B–D are listed in S3 Data. Illustration for Fig 6A was created using BioRender.com. DEG, differentially expressed gene; dpi, days post-infection; EMD, Earth Mover’s Distance; SARS-CoV-2, Severe Acute Respiratory Syndrome Coronavirus 2.

Update of

Comment in

References

    1. Wang C, Horby PW, Hayden FG, Gao GF. A novel coronavirus outbreak of global health concern. The Lancet. 2020. pp. 470–473. 10.1016/S2213-8587(20)30104-2 - DOI - PMC - PubMed
    1. Cui J, Li F, Shi Z-L. Origin and evolution of pathogenic coronaviruses. Nat Rev Microbiol. 2019;181–192. 10.1038/s41579-018-0118-9 - DOI - PMC - PubMed
    1. Tang Q, Song Y, Shi M, Cheng Y, Zhang W, Xia X-Q. Inferring the hosts of coronavirus using dual statistical models based on nucleotide composition. Sci Rep. 2015;5: 17155. 10.1038/srep17155 - DOI - PMC - PubMed
    1. World Health Organization. Novel Coronavirus (2019-nCoV): situation report, 22. 2020 [cited 4 Sep 2020]. Available from: https://apps.who.int/iris/handle/10665/330991
    1. de Wit E, van Doremalen N, Falzarano D, Munster VJ. SARS and MERS: recent insights into emerging coronaviruses. Nat Rev Microbiol. 2016;14: 523–534. 10.1038/nrmicro.2016.81 - DOI - PMC - PubMed

Publication types