. 2021 Apr 15;81(8):1732-1748.e8.
doi: 10.1016/j.molcel.2021.02.032. Epub 2021 Mar 16.

H3K27ac bookmarking promotes rapid post-mitotic activation of the pluripotent stem cell program without impacting 3D chromatin reorganization

Affiliations

H3K27ac bookmarking promotes rapid post-mitotic activation of the pluripotent stem cell program without impacting 3D chromatin reorganization

Bobbie Pelham-Webb et al. Mol Cell. .

Abstract

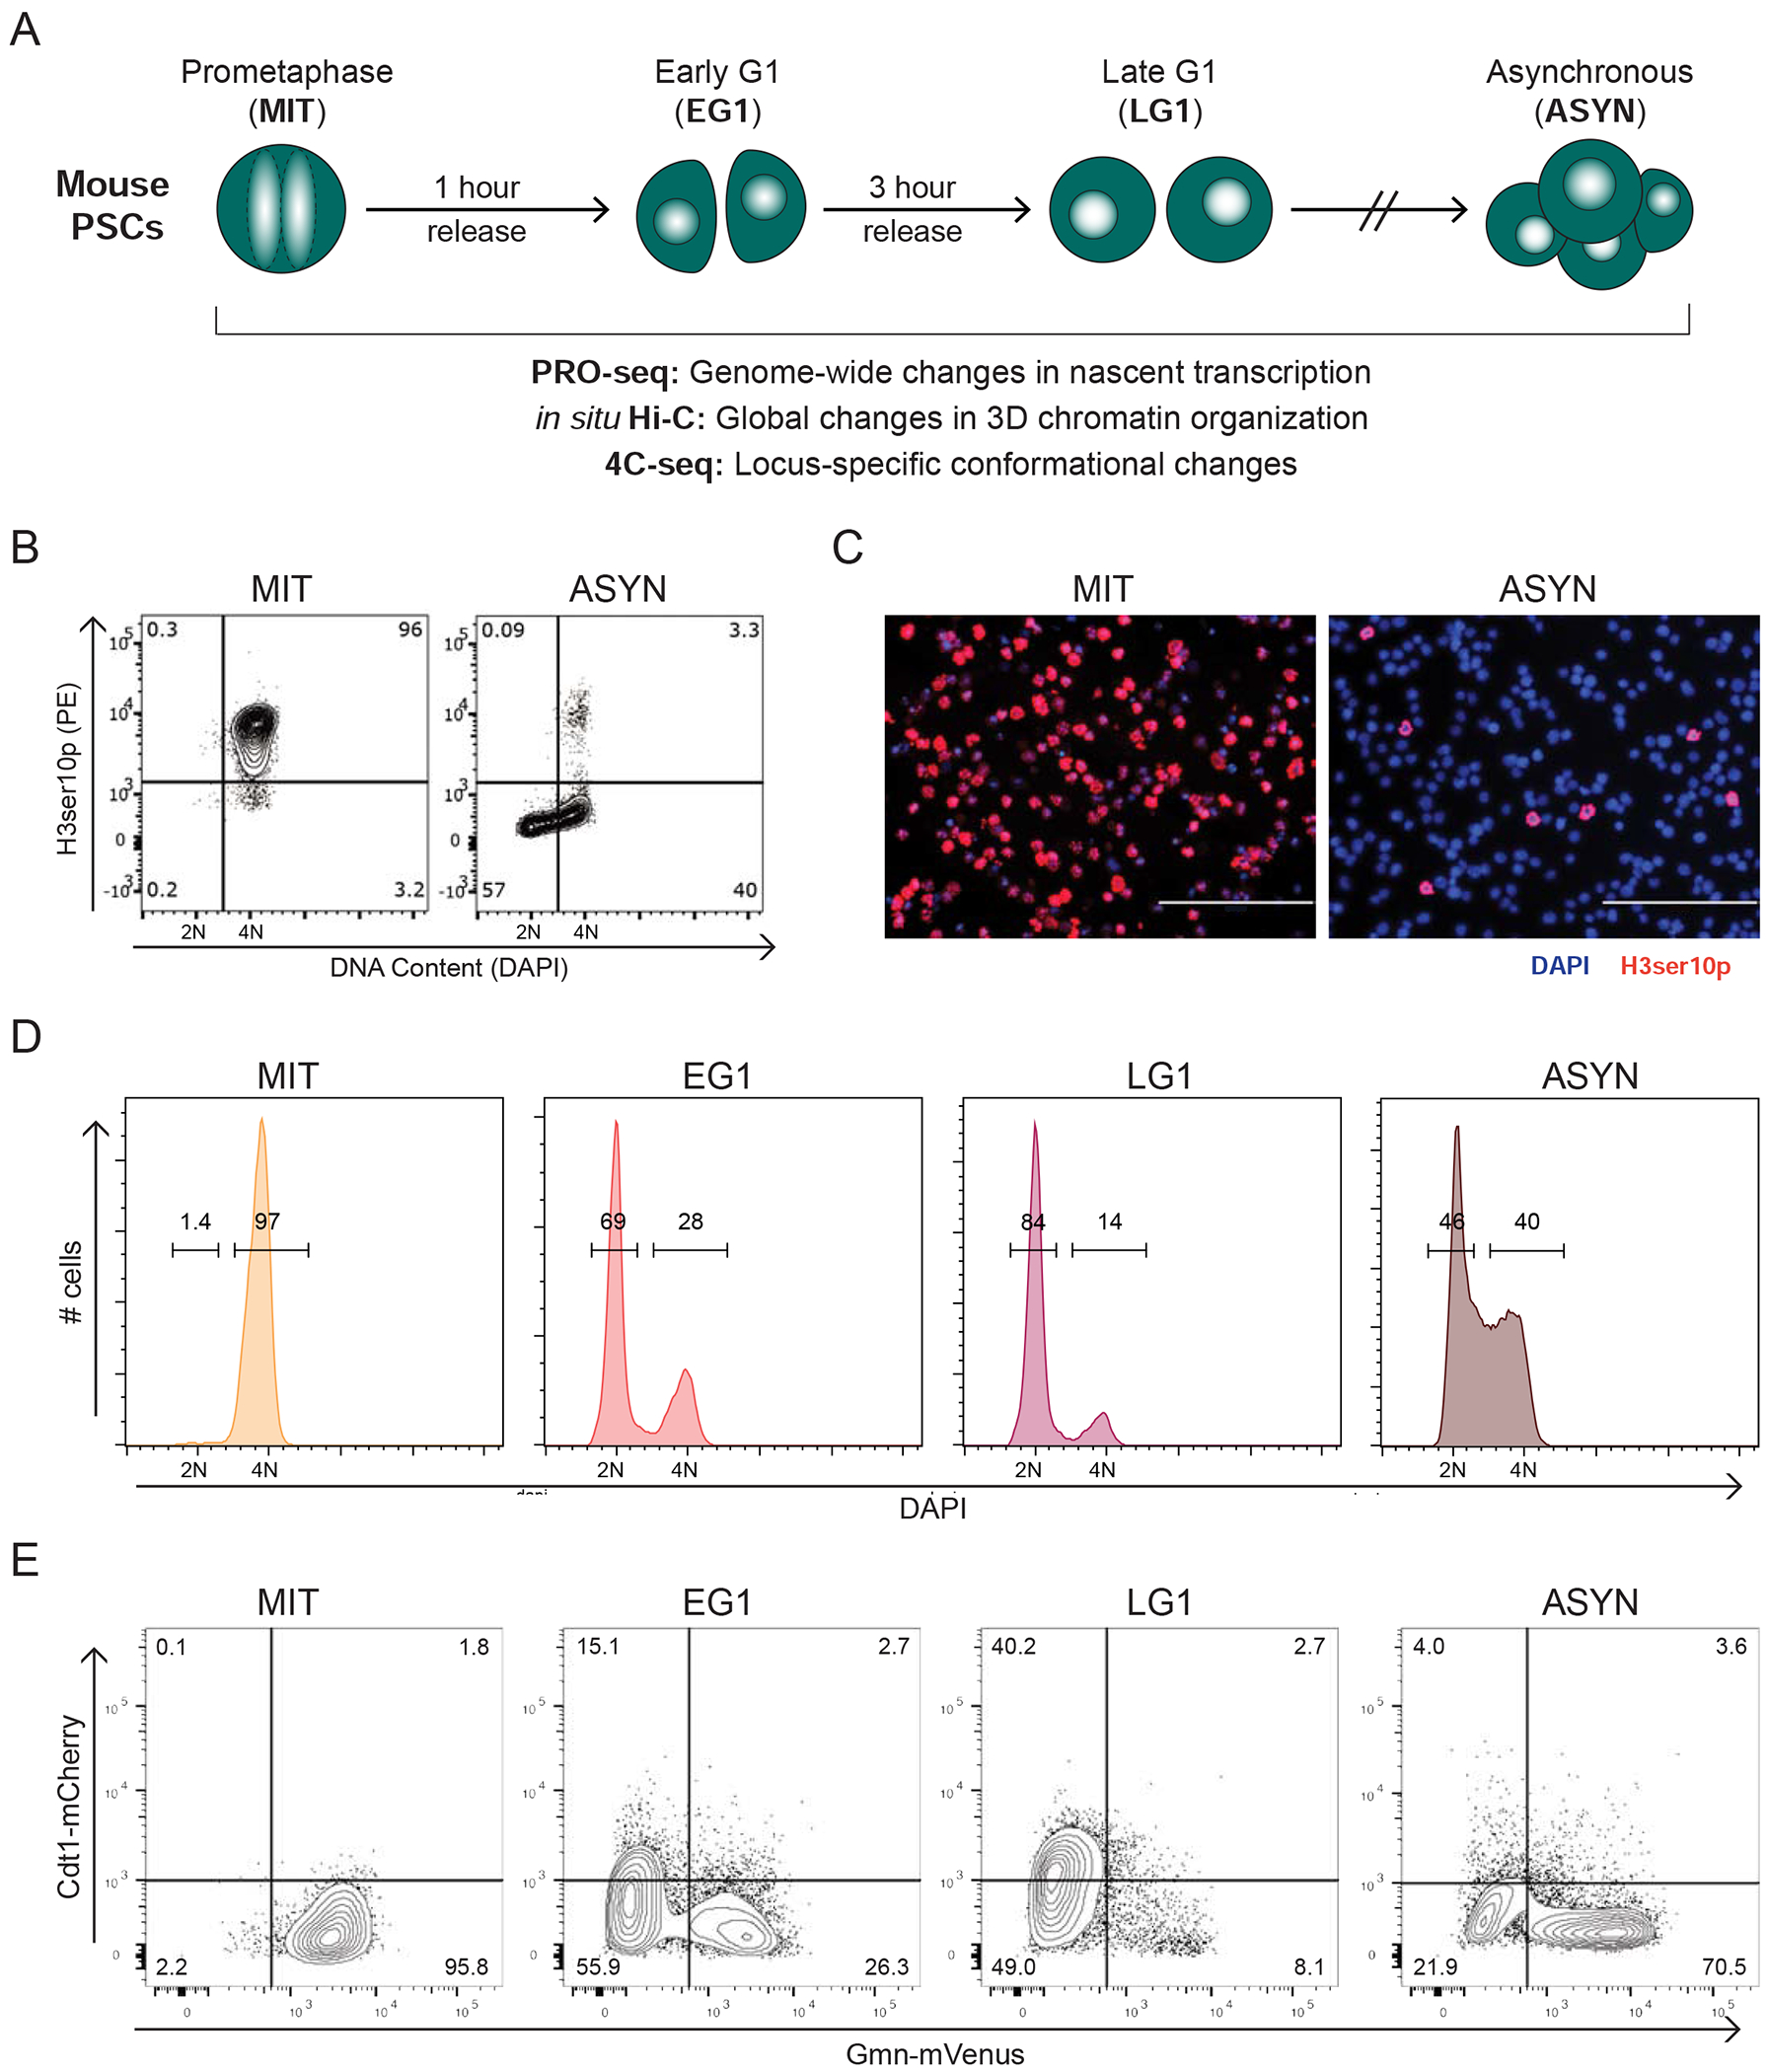
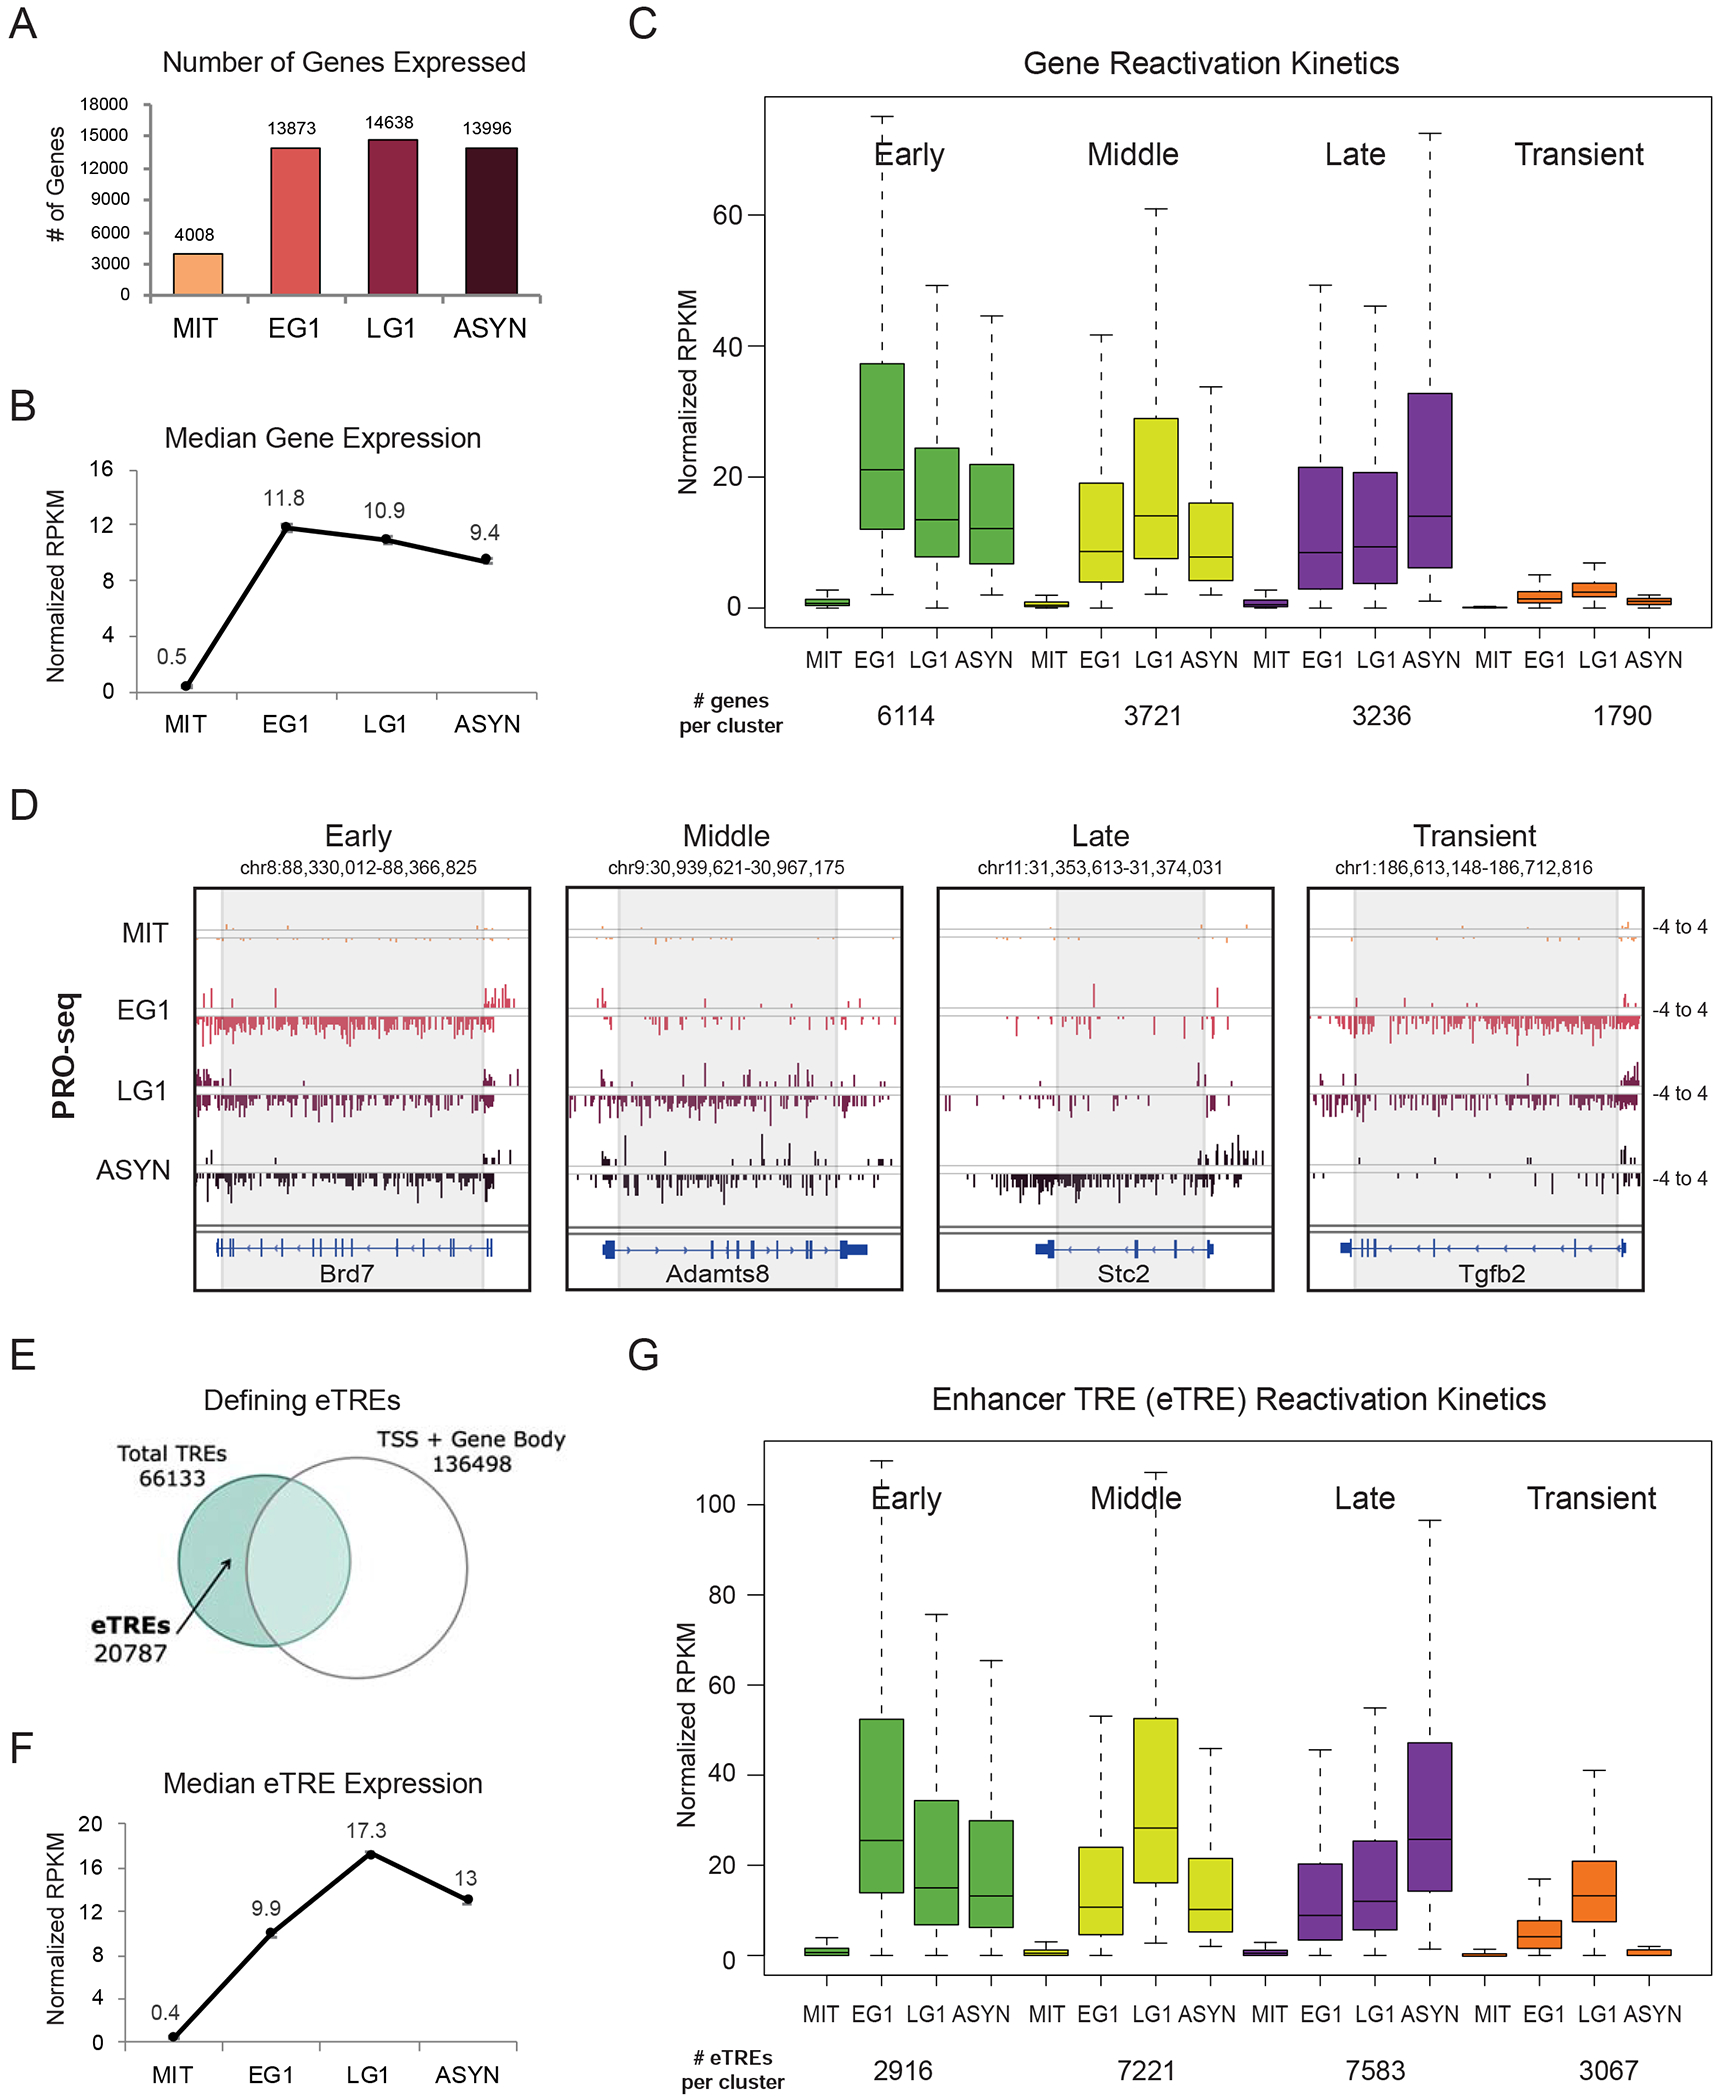
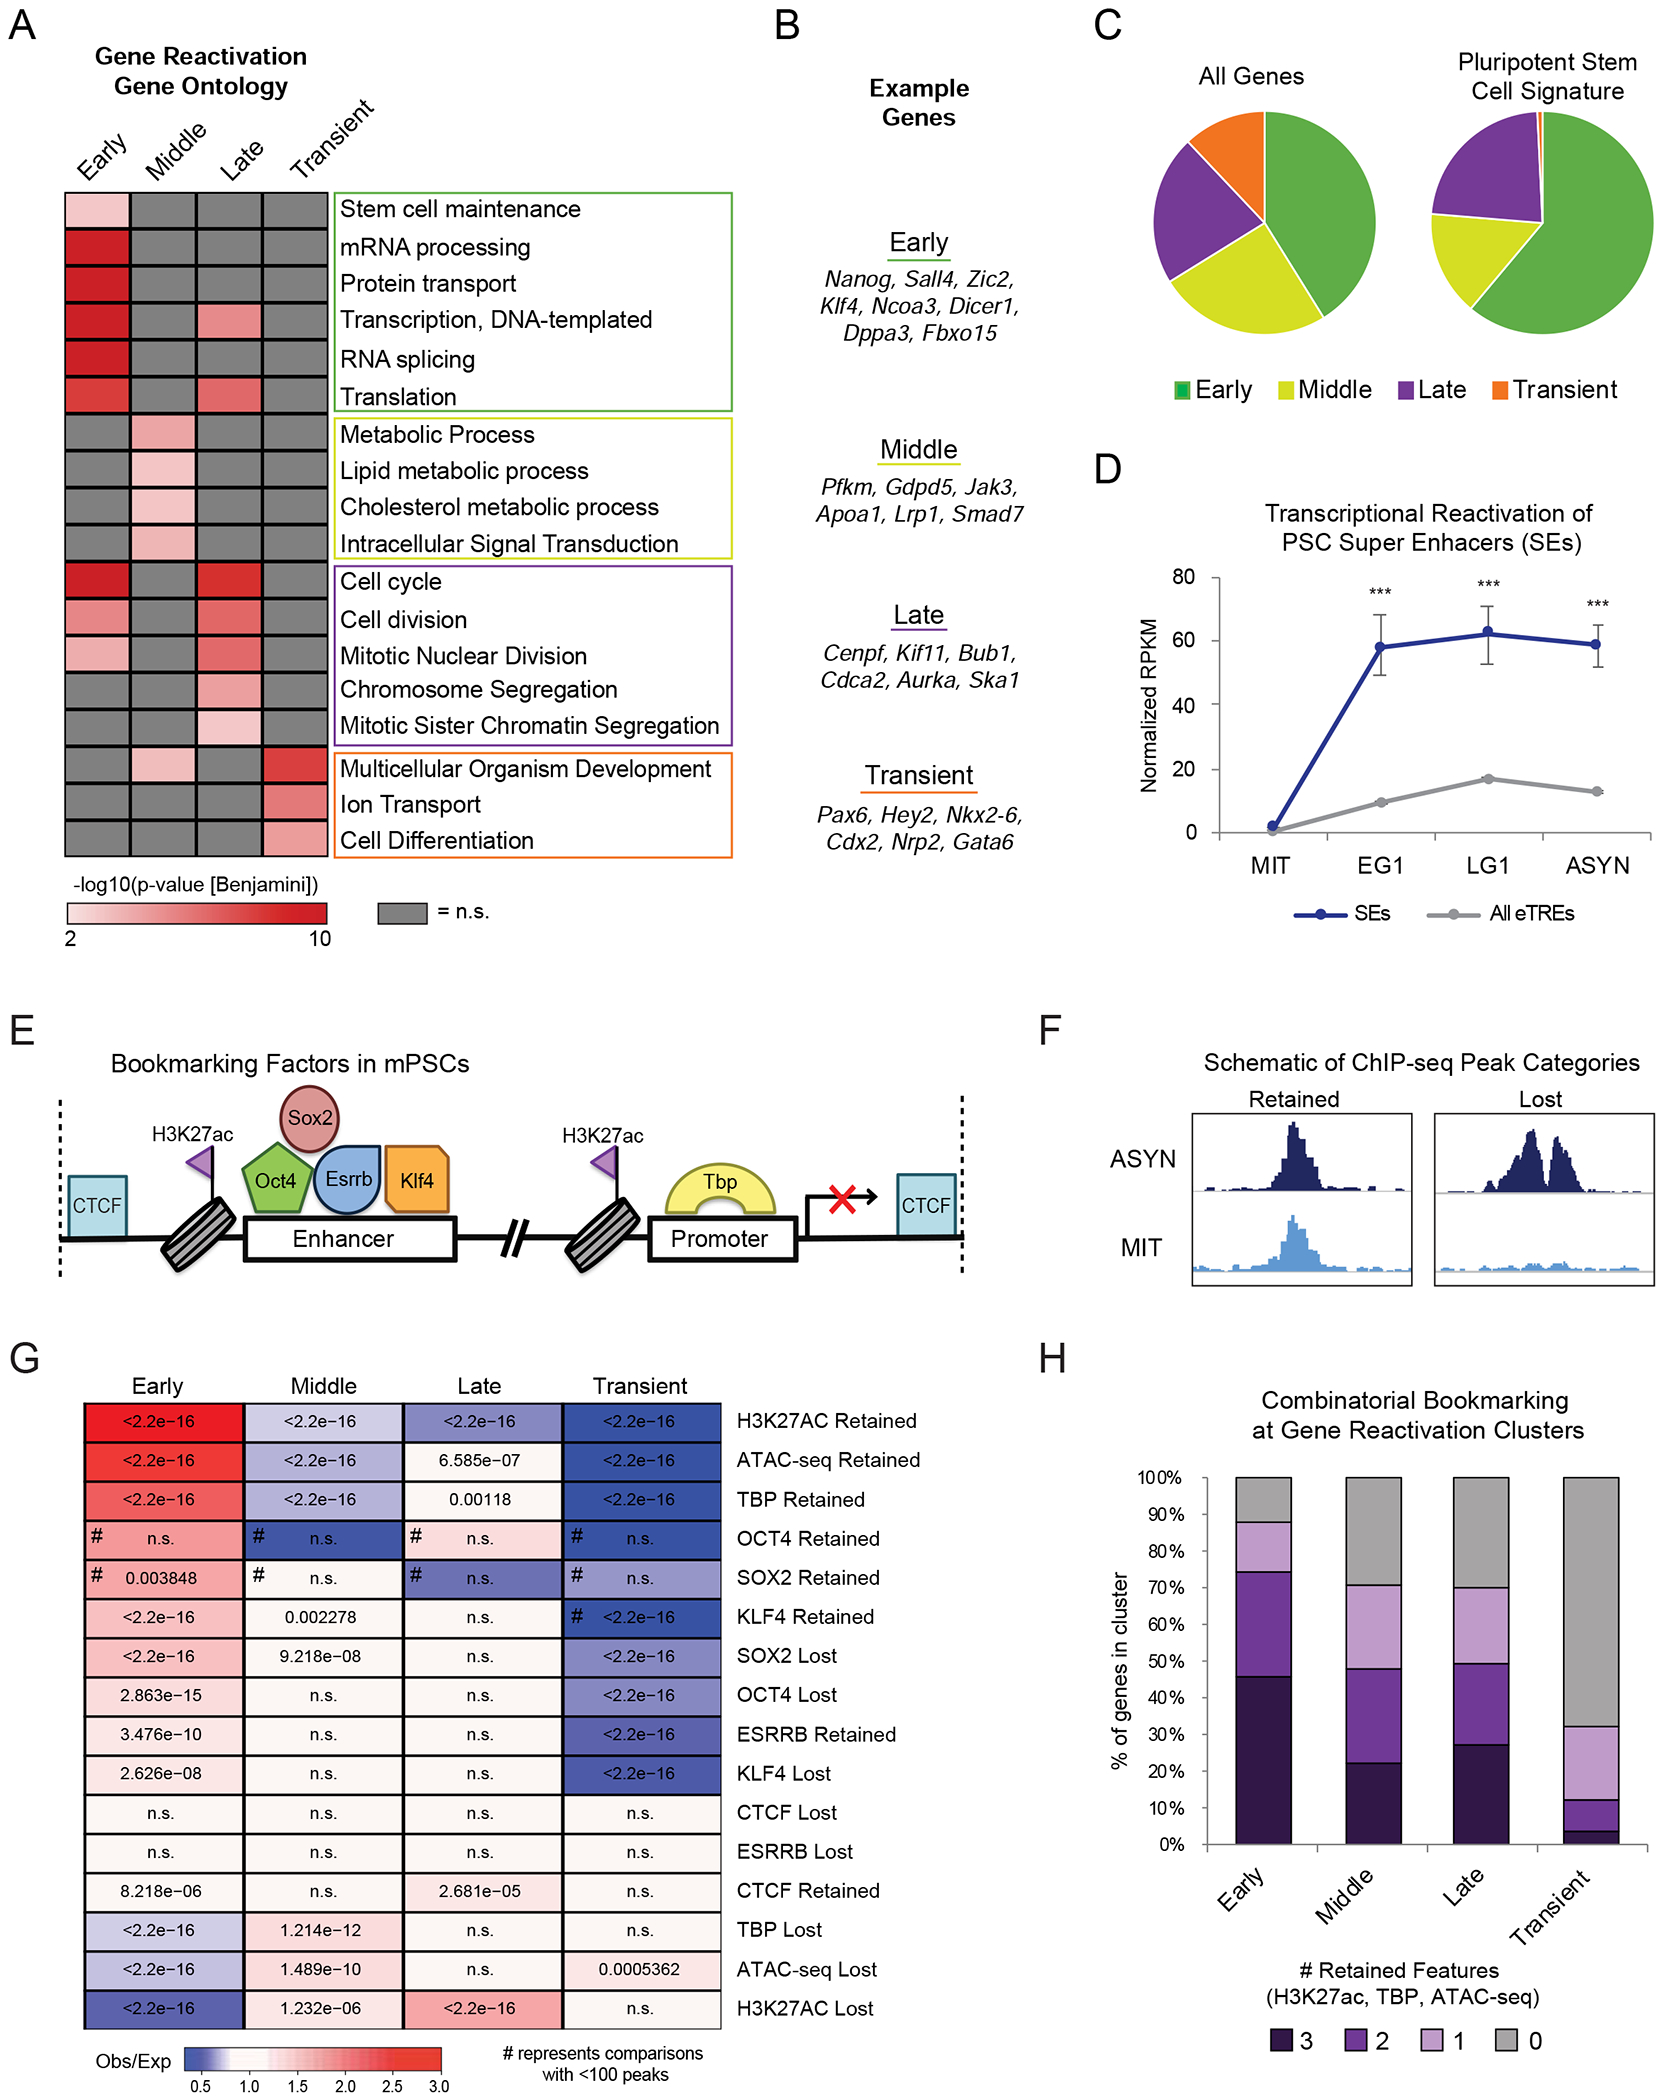
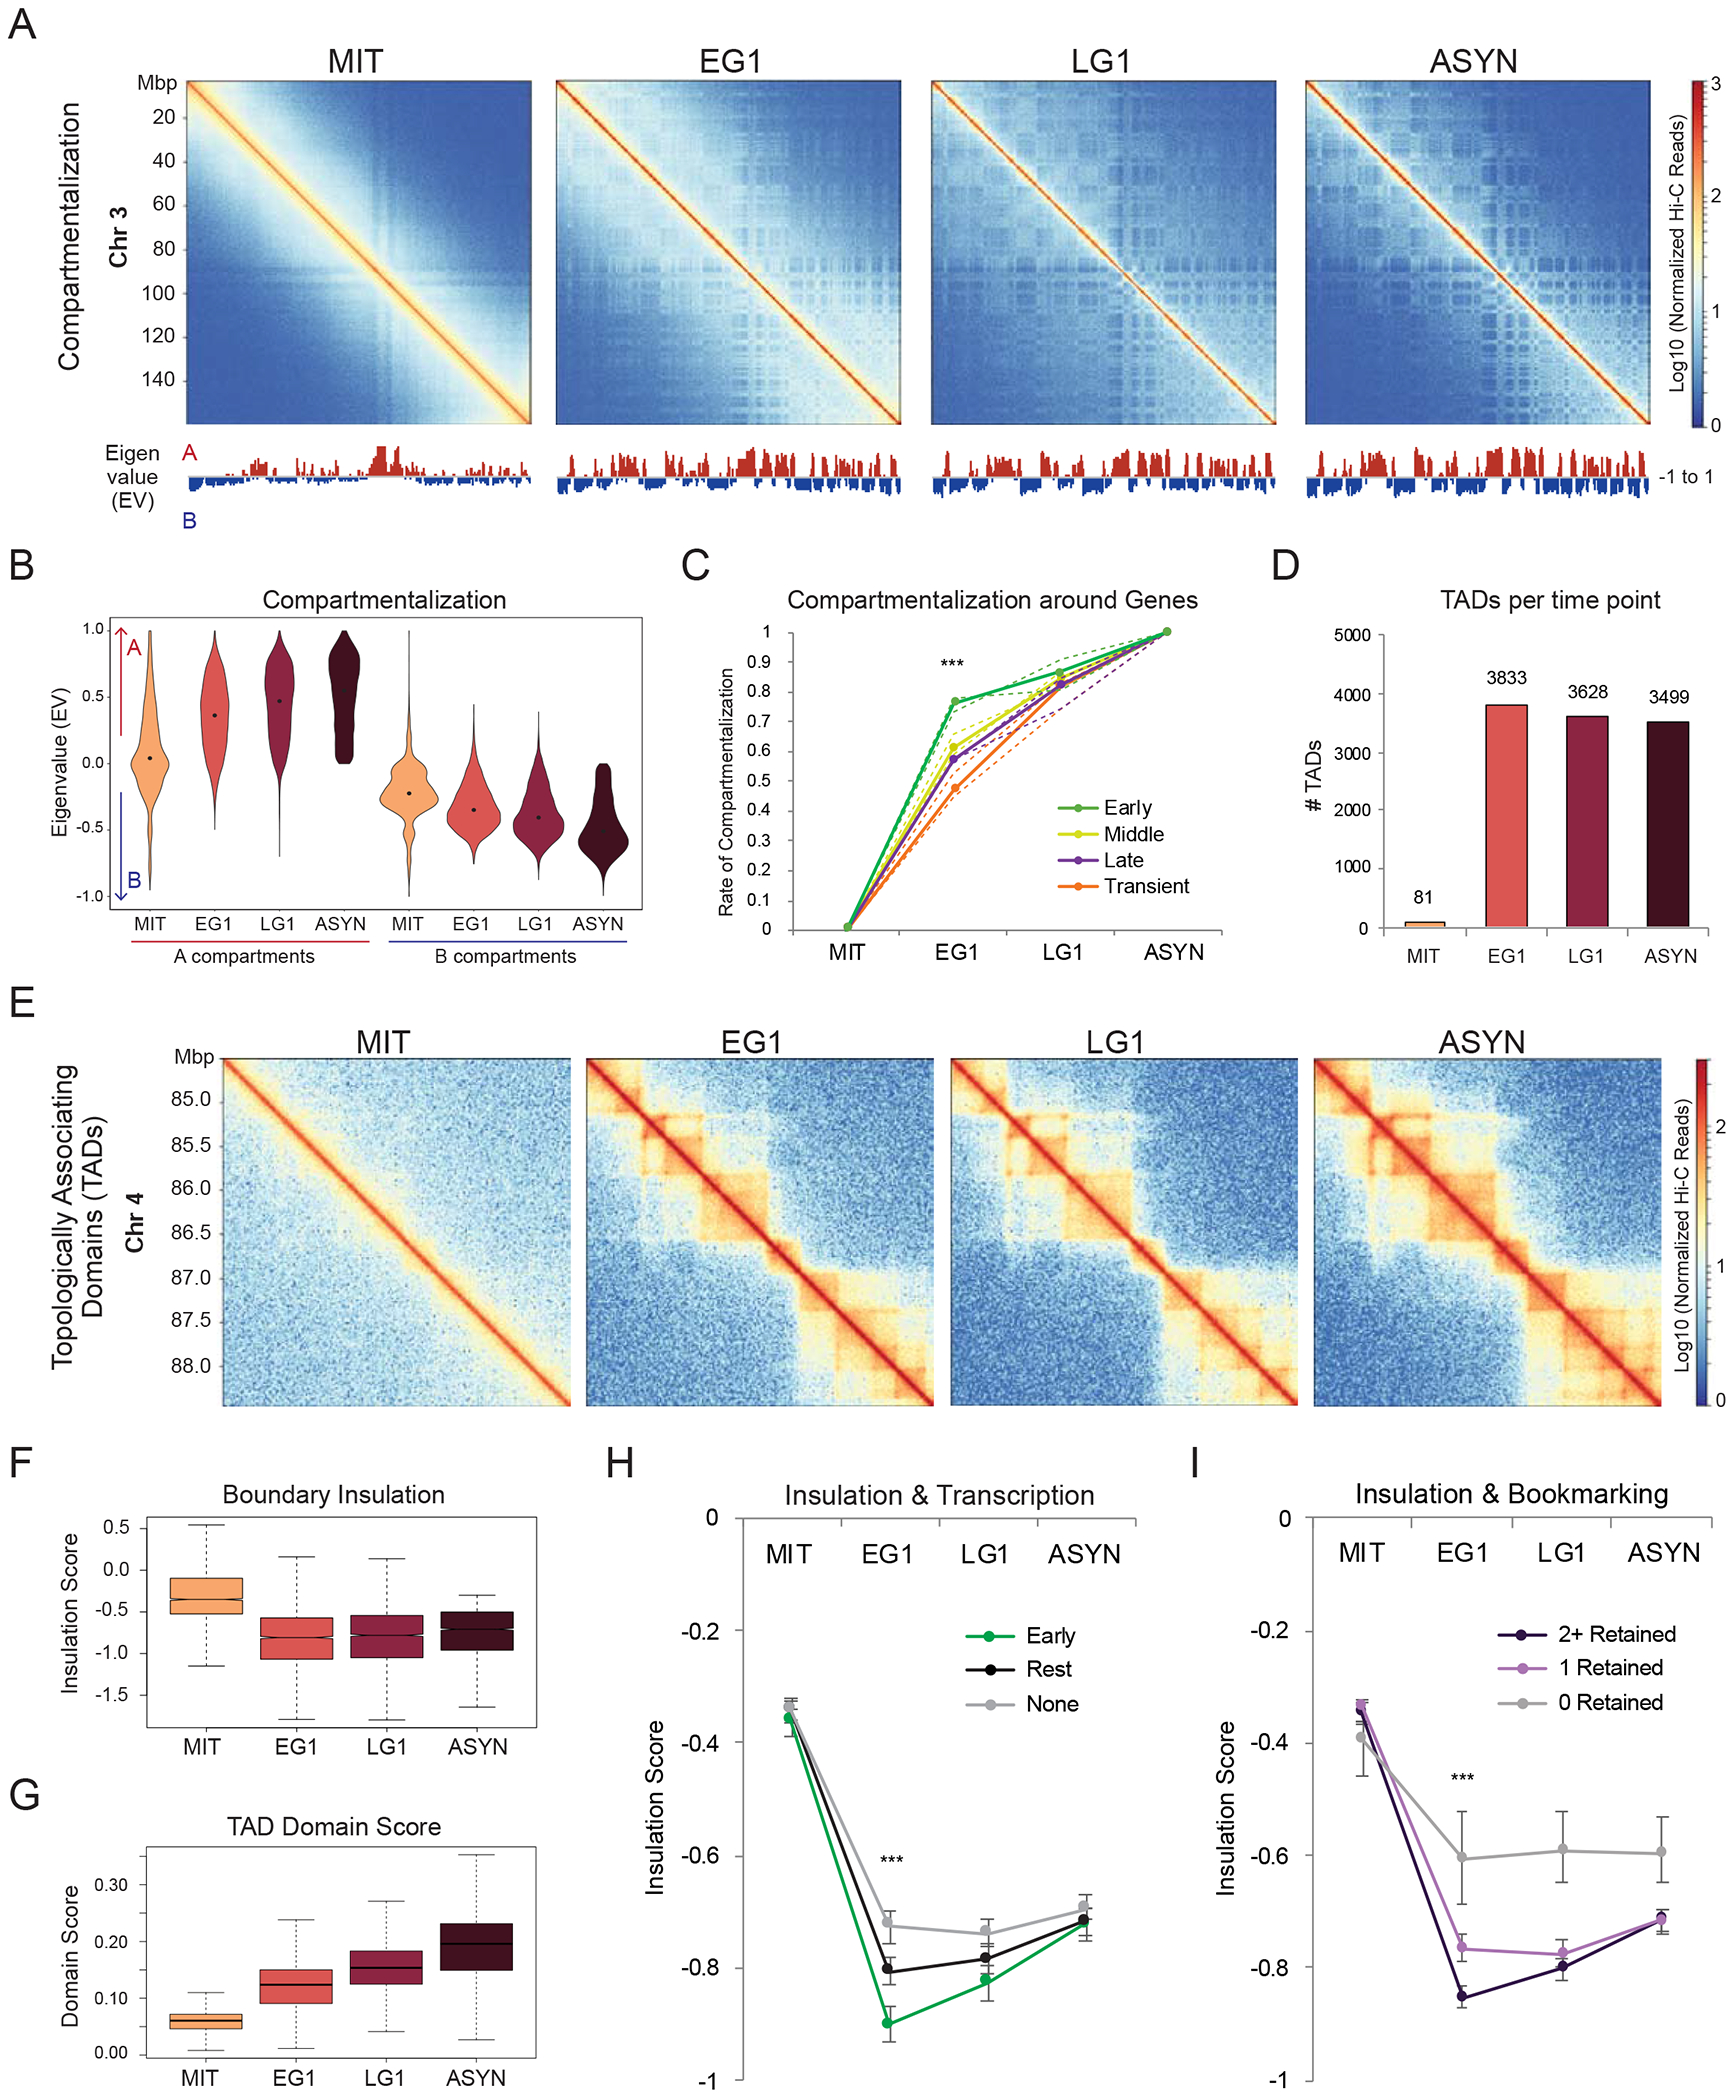
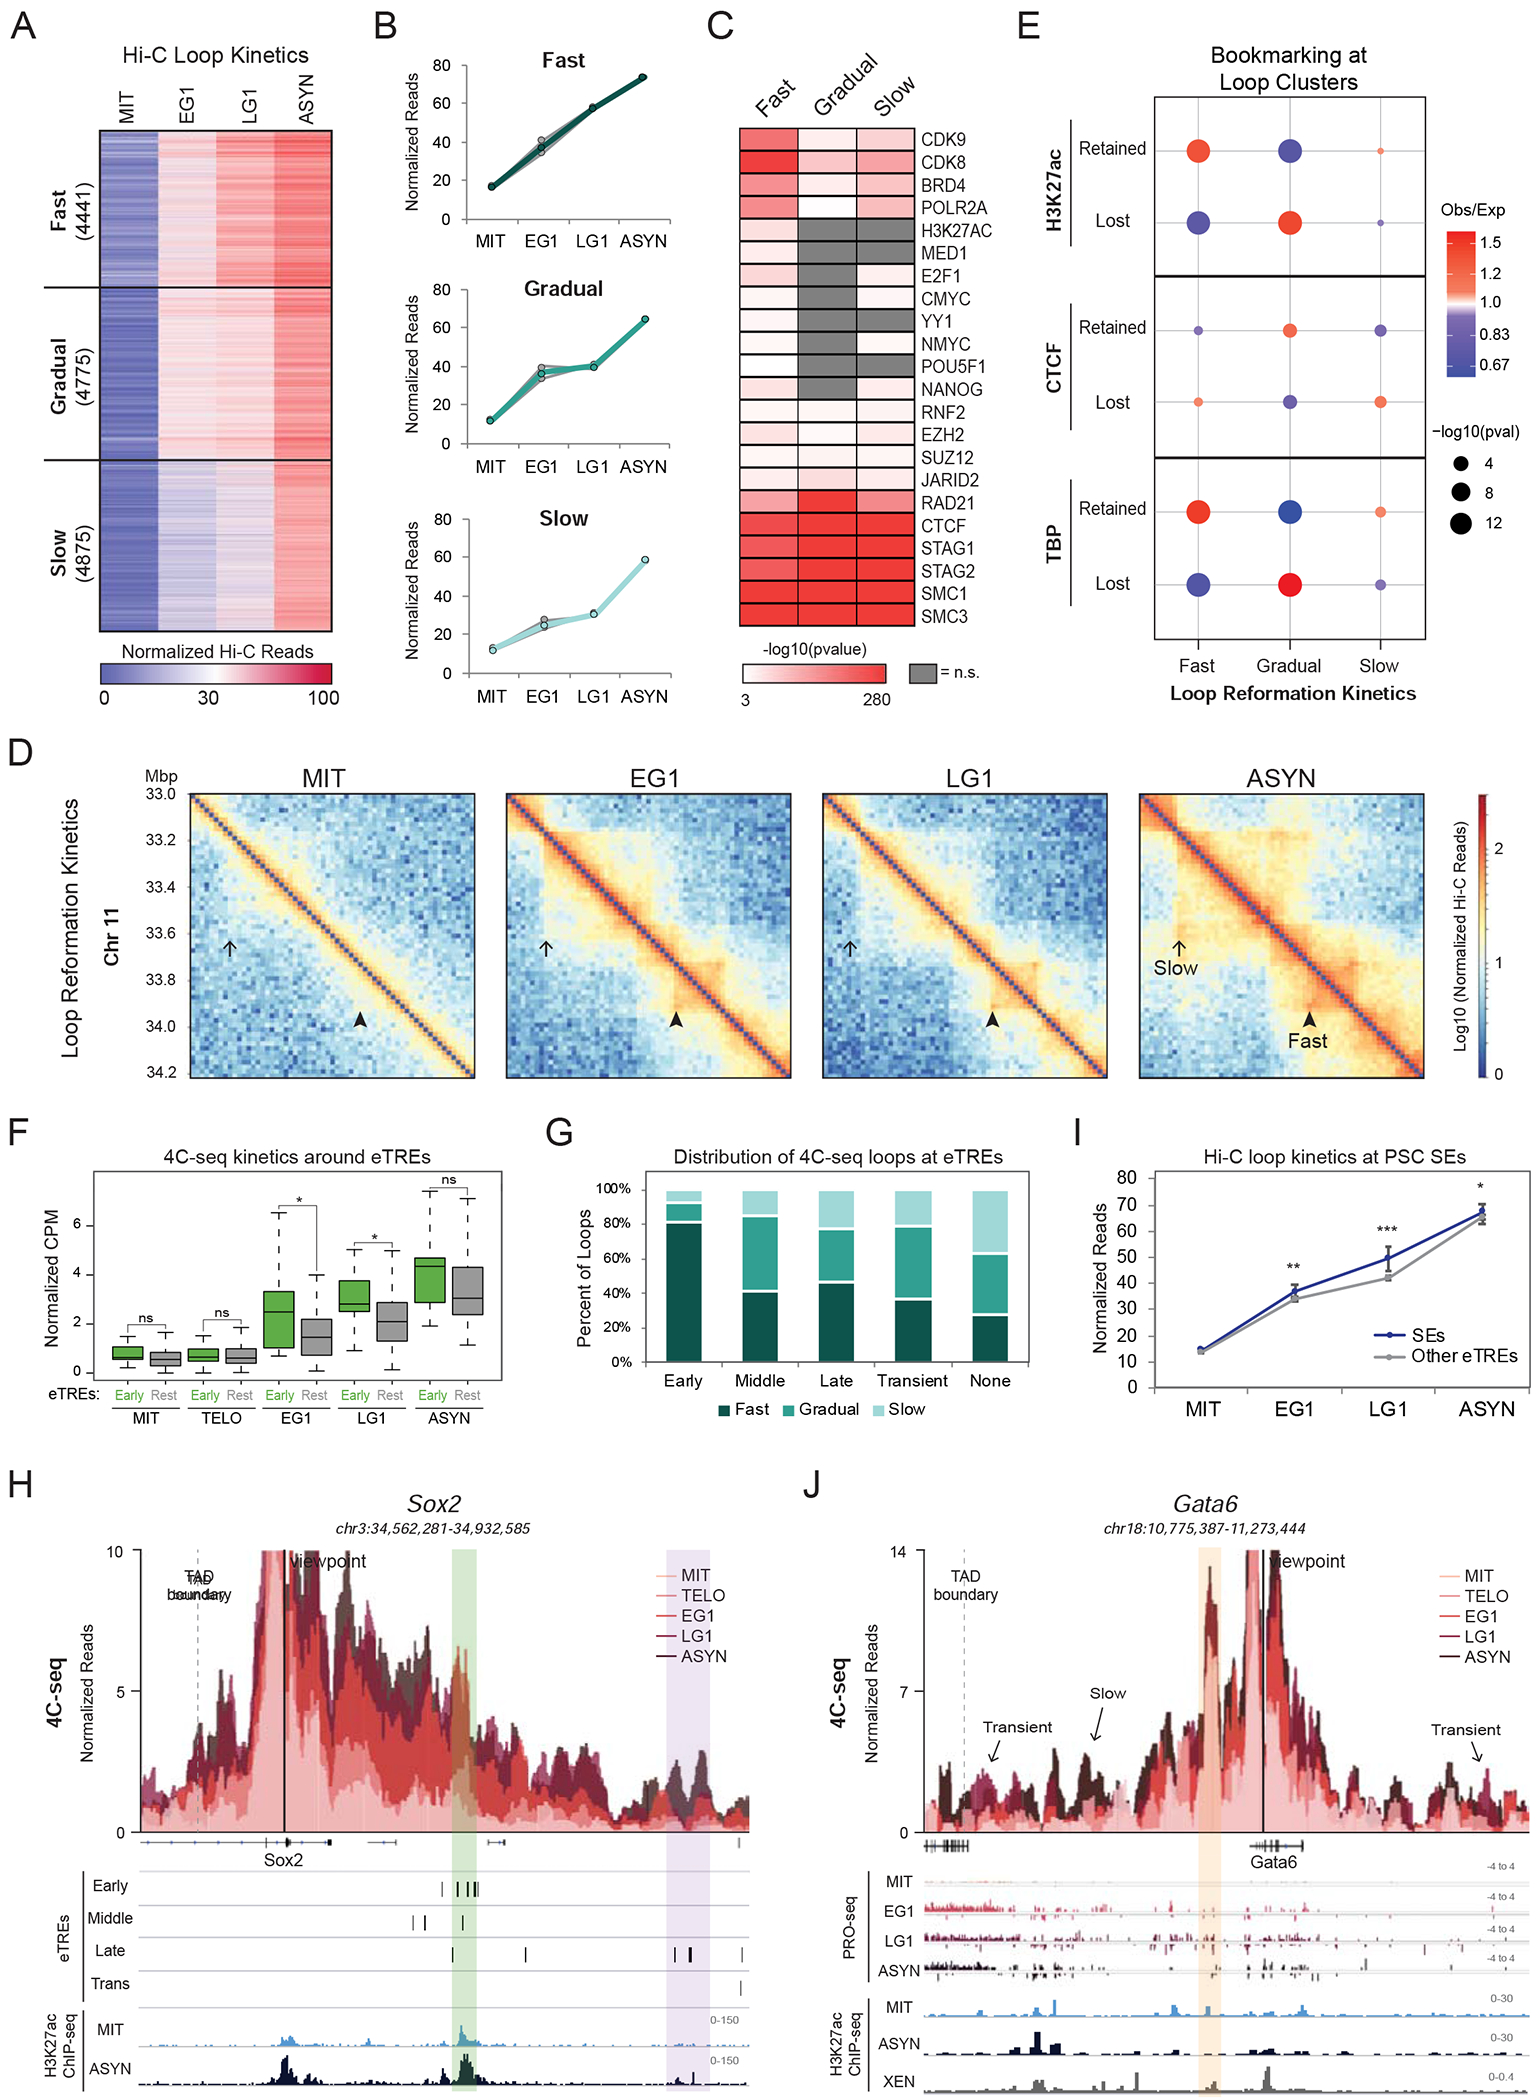
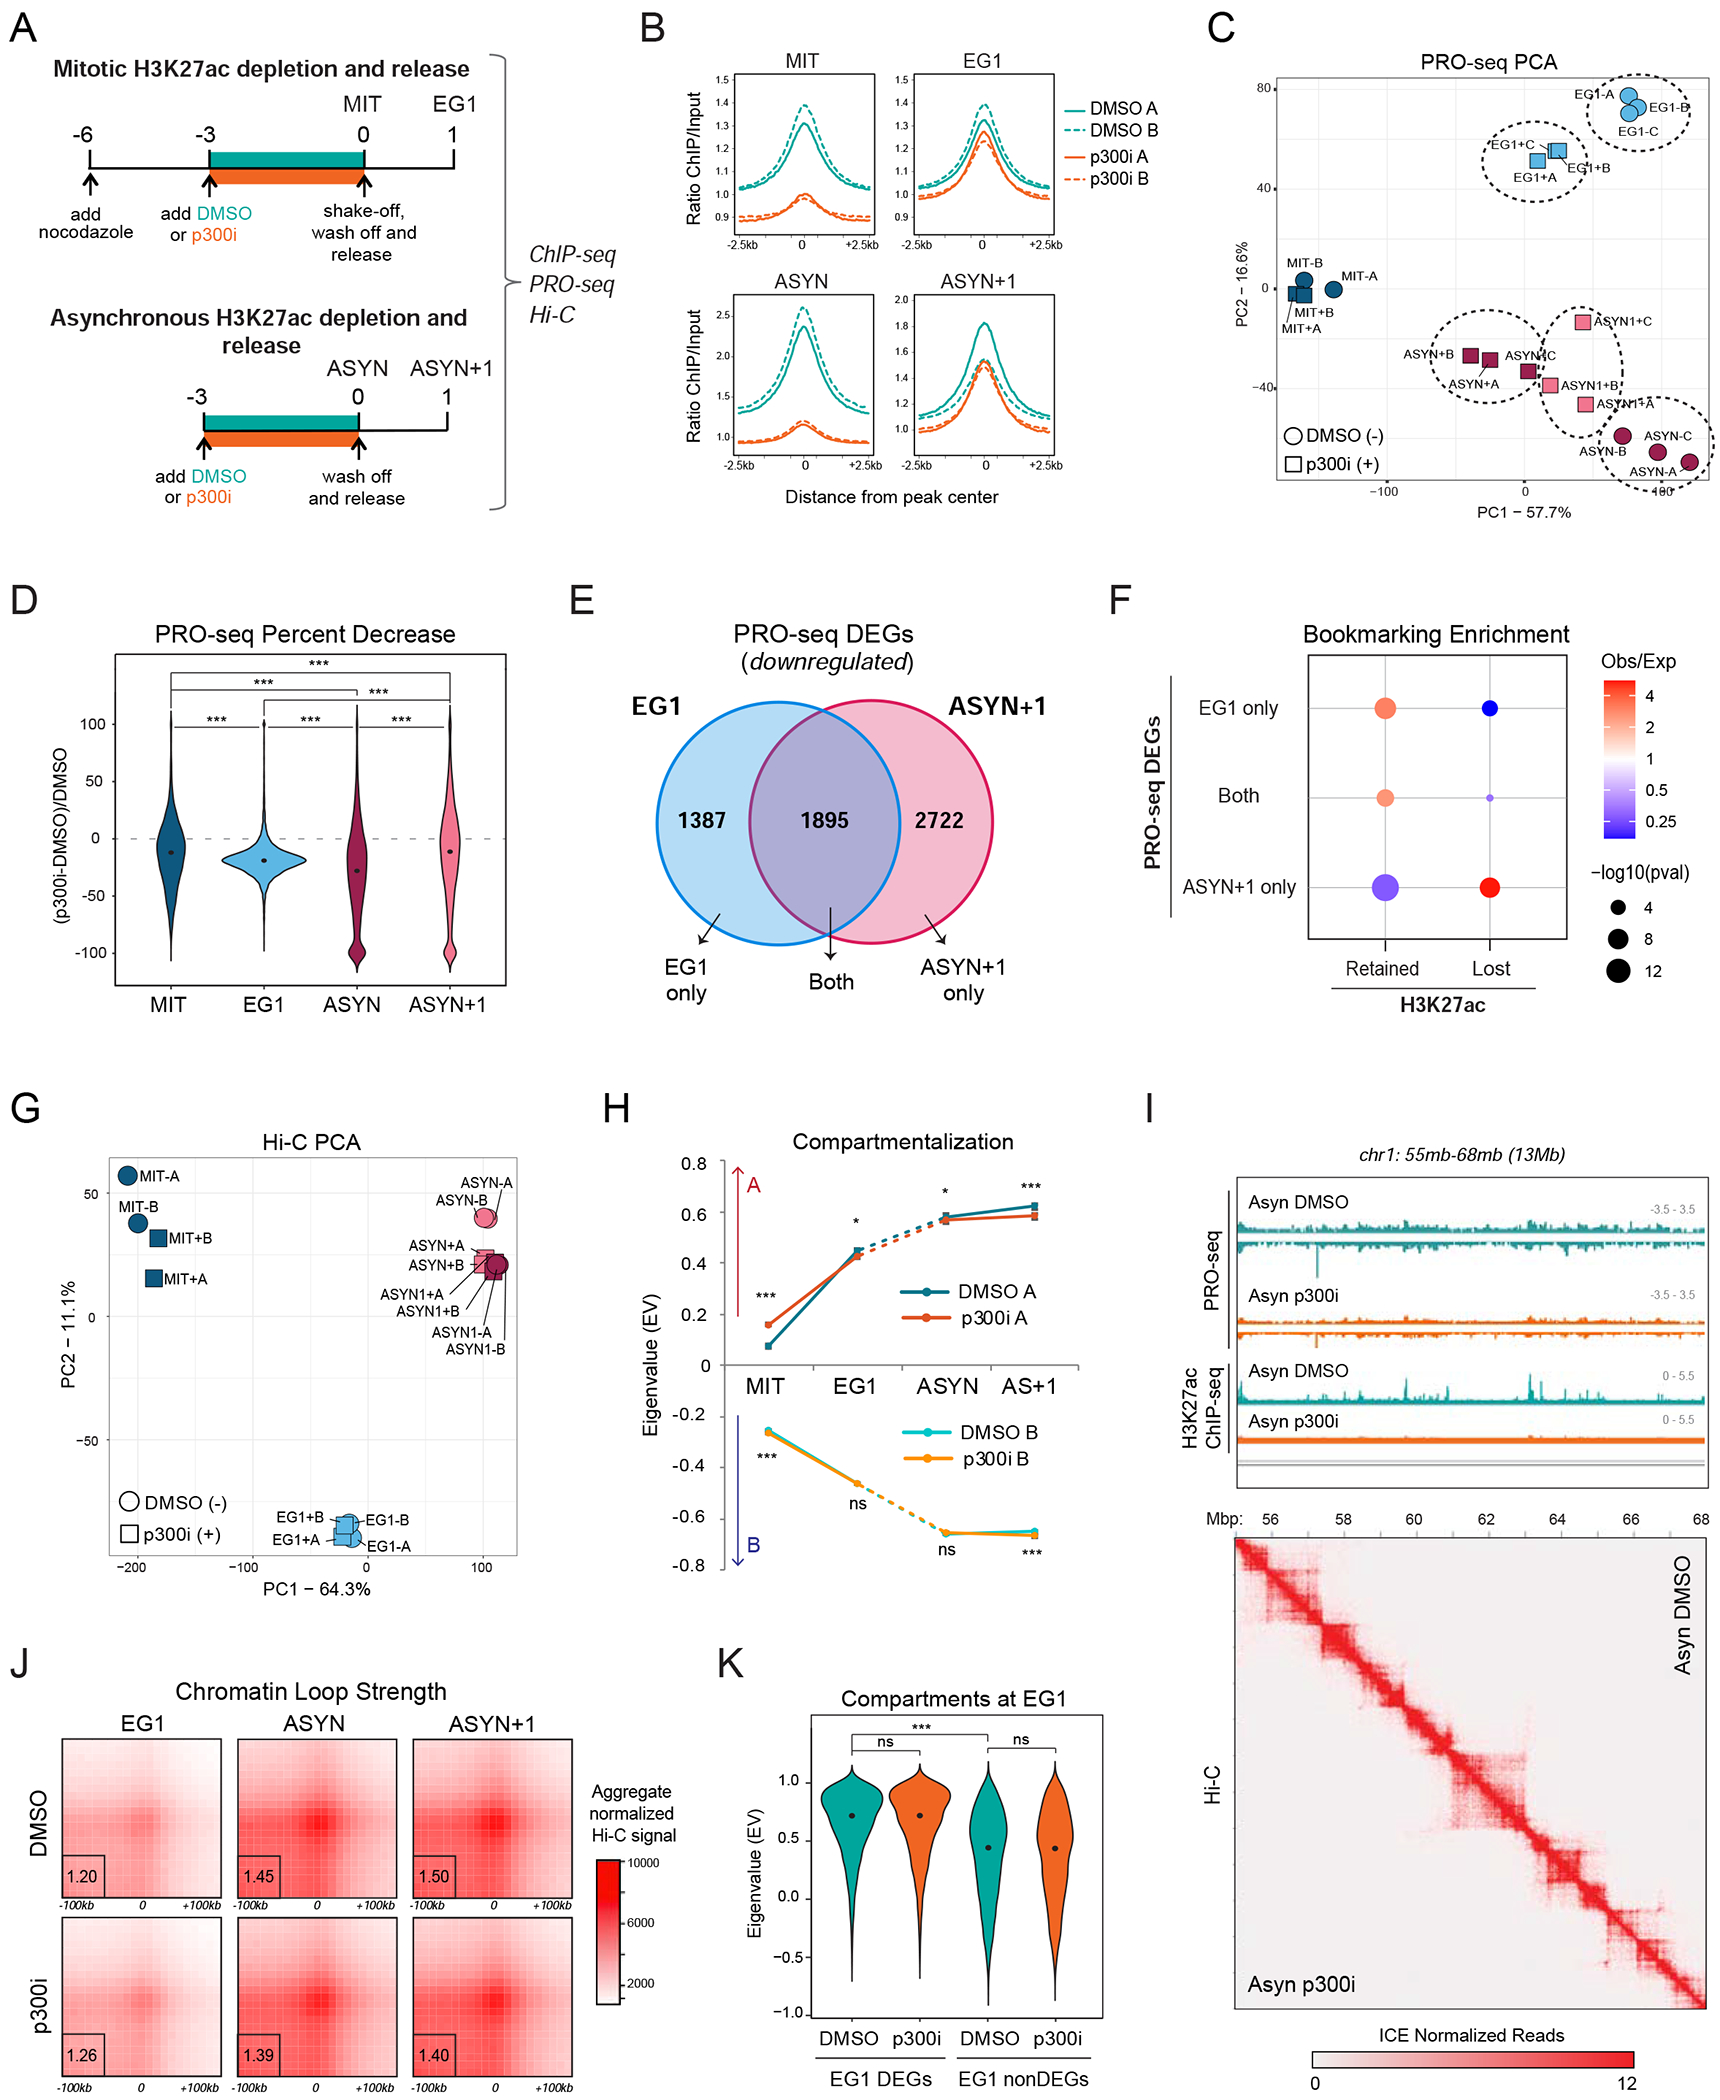
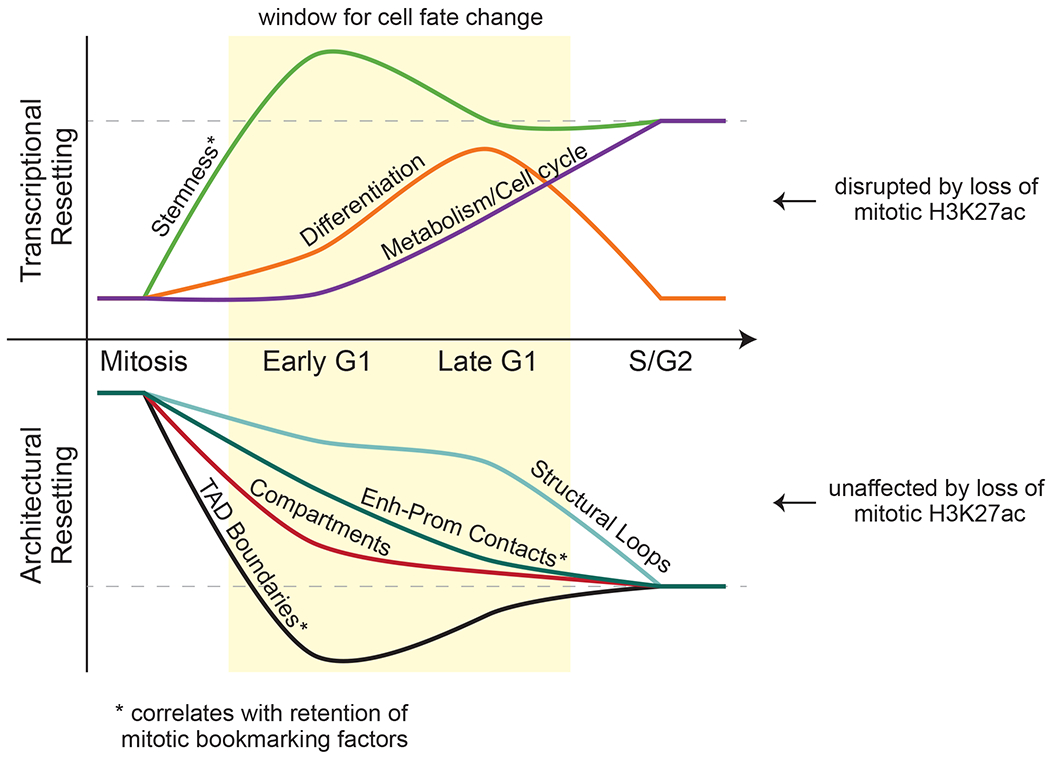
During self-renewal, cell-type-defining features are drastically perturbed in mitosis and must be faithfully reestablished upon G1 entry, a process that remains largely elusive. Here, we characterized at a genome-wide scale the dynamic transcriptional and architectural resetting of mouse pluripotent stem cells (PSCs) upon mitotic exit. We captured distinct waves of transcriptional reactivation with rapid induction of stem cell genes and transient activation of lineage-specific genes. Topological reorganization at different hierarchical levels also occurred in an asynchronous manner and showed partial coordination with transcriptional resetting. Globally, rapid transcriptional and architectural resetting associated with mitotic retention of H3K27 acetylation, supporting a bookmarking function. Indeed, mitotic depletion of H3K27ac impaired the early reactivation of bookmarked, stem-cell-associated genes. However, 3D chromatin reorganization remained largely unaffected, suggesting that these processes are driven by distinct forces upon mitotic exit. This study uncovers principles and mediators of PSC molecular resetting during self-renewal.

Keywords: 3D chromatin organization; H3K27ac; Hi-C; PRO-seq; bookmarking; cell identity; enhancer-promoter interaction; mitosis; pluripotent stem cells; transcription reactivation.


Conflict of interest statement

Declaration of interests The authors declare no competing interests.

Figures

Figure 1.
Figure 1.
Mitotic arrest and release of pluripotent stem cells into G1 (A) Strategy for collecting and profiling mouse pluripotent stem cells (PSCs) in Mitosis (MIT), Early G1 (EG1), Late G1 (LG1), and untreated, asynchronous cells (ASYN). (B-C) FACS plots (B) and representative immunofluorescence images (C) showing H3ser10 phosphorylation (H3ser10p), a mitosis-specific histone mark, and DAPI in ASYN and MIT populations. (D) FACS histograms showing the percentage of cells with DNA content of 2N (G1) and 4N (G2/M) during a representative mitotic release time course. (E) FACS plots from a representative time course with FUCCI2a cells indicating the percent of cells in EG1 (Cdt1, Gmn), LG1 (Cdt1+, Gmn), and S/G2/M (Gmn+). See also Figure S1
Figure 2.
Figure 2.
Distinct waves of gene and enhancer reactivation during mitotic exit (A) Number of genes expressed at each time point (RPKM>1 after normalization to Drosophila spike-in control and number of cells). (B) Median expression at each time point of all expressed genes. Error bars show +/− SEM of two biological replicates. (C) Genes were assigned to a group based on when they reached their maximal expression level (EG1 = early, LG1 = middle, ASYN = late). Transient genes were defined as normalized RPKM <2 in ASYN but >2 in EG1 and/or LG1. Box plots depict the median transcriptional activity across the time course; number of genes per cluster listed below. (D) Genome browser tracks of PRO-seq data (plus and minus strands) for one gene from each reactivation group. Grey box approximates the region used to quantify genic PRO-seq signal. (E) Strategy for identifying enhancer transcriptional regulatory elements (eTREs) using PRO-seq and published TSS data. Total TREs were defined using dREG. (F) Median expression at each time point of all 20787 identified eTREs. Error bars show +/−SEM of two biological replicates. (G) Patterns of eTRE transcriptional reactivation kinetics, defined as in (C). Box plots depict the median transcriptional activity across the time course. See also Figures S1, S2 and Tables S1, S6
Figure 3.
Figure 3.
Bookmarked, stem cell genes and enhancers are rapidly reactivated upon mitotic exit (A) Heat map indicates the enrichment (-log10(pvalue)) of selected top Gene Ontology (GO) terms in each gene reactivation cluster. Adjusted (Benjamini) p-value <0.01was used as cut-off. Not significant terms are shown in grey. (B) Example genes in each reactivation group corresponding to top GO terms. (C) Pie charts show the distribution of all 14861 expressed genes (“All Genes”) versus 478 genes defined in an ESC/iPSC signature (Papadimitriou et al., 2016) (“Pluripotent Stem Cell Signature”) within the reactivation clusters. (D) Transcriptional reactivation of eTREs that overlap with defined PSC SEs (n=255 eTREs) (Whyte et al., 2013) compared to all other eTREs (n=20532 eTREs). Error bars show upper and lower limit of the 95% confidence interval. Asterisks indicate significance (*** p<0.0001) for SEs vs. Other eTREs, two-sided Wilcoxon’s rank sum test. (E) Schematic depicting the various proteins and histone modifications that have been identified as putative mitotic bookmarks in PSCs and have available ChIP-seq both in mitotic and asynchronous cells. (F) Schematic showing how we categorized published ChIP-seq peaks as Retained or Lost during mitosis. (G) Relative enrichment or depletion of the Retained/Lost peaks for each bookmarking factor at the promoters (+/−2.5kb from TSS) of each gene reactivation cluster. Color indicates ratio of observed (Obs) versus expected (Exp) frequency and p-value (two-sided Fisher’s exact test) is indicated if significant (p<0.01). Comparisons using <100 overlapping peaks are denoted with a hash mark (#). (H) Stacked bar plot showing the percent of genes in each transcriptional reactivation cluster that retained all, some, or none of the three bookmarks (H3K27ac, TBP, ATAC-seq). See also Figure S3 and Tables S2, S6
Figure 4.
Figure 4.
Chromosomal compartments and domain boundaries are established in EG1 in coordination with transcriptional reactivation (A) Hi-C interaction heatmaps (log10 Normalized Hi-C reads) of chromosome 3 for each time point to illustrate compartment reformation. The eigenvalues (EV) of each matrix at 100kb resolution are shown below. (B) Violin plot depicting the compartmentalization (eigenvalue, EV) for all 100kb bins across the genome at each time point. Bins with EV>0 in asynchronous cells are called A, while bins with EV<0 are called B. (C) Line plot showing rate of compartmentalization during mitotic exit for compartments (100kb bins) containing genes from the four gene reactivation clusters, prioritized as Early (n=4208) > Middle (n=1861) > Late (n=921) > Transient (n=903). Lines indicate the median compartmentalization rate for each Hi-C replicate (dashed) or for the averaged replicates (solid). Asterisks indicate significance (*** p<0.0001) for Early versus any other cluster at EG1, two-sided Wilcoxon’s rank sum test. (D) Number of TADs identified at each time point. (E) Hi-C interaction maps (log10 Normalized Hi-C reads) for each time point of a region on chromosome 4 (chr4:84,500,000-88,500,000), illustrating TAD dynamics. (F-G) Box plots showing the (F) insulation scores of TAD boundaries (n=3519 in asynchronous cells) and (G) domain scores of TADs (n=3499) across the time course. (H-I) Median insulation scores at each time point for (H) TAD boundaries containing: at least one early gene or eTRE (Early, n=985), only later activated genes or eTREs (Middle, Late, and/or Transient) (Rest, n=1182), or no active genes or eTREs (None, n=1352) or (I) TAD boundaries that retain none (n=176), one (n=1414) or two or more (n=1929) bookmarking features (CTCF, H3K27ac, ATAC-seq, TBP). For both (H-I) Asterisks indicate significance (*** p<0.0001) for all pairwise comparisons at EG1, two-sided Wilcoxon’s rank sum test. See also Figure S4 and Tables S3, S6
Figure 5.
Figure 5.
Enhancer-promoter contacts are rapidly reformed with different patterns at early or transiently activated genes (A-B) K-means clustering of 14091 Hi-C loops (see methods) identified three clusters with different reformation kinetics (Fast, Gradual, Slow). (A) Heat map illustrating the normalized Hi-C reads for each contact over the time course. Number of loops per cluster is shown. (B) Line plots depicting the median of normalized read counts for each cluster over the time course either for each replicate (grey lines) or for the average of the replicates (colored lines). (C) Heat map showing select factors and marks that are enriched at the loop anchors of each Hi-C cluster (shown in A) as calculated from LOLA analysis (Sheffield and Bock, 2016) (see Methods). Color bar indicates significance of enrichment (-log10(pvalue)), while not significant (q>0.001) terms are shown in grey. (D) Hi-C interaction maps (log10 Normalized Hi-C reads) at 10kb resolution of a region on chromosome 11 (chr11:33,000,000-34,200,000) at each time point. Examples of a Fast and Slow reestablished contacts are indicated. (E) Relative enrichment of Hi-C loop clusters for the presence of Retained or Lost H3K27ac, CTCF, or TBP ChIP-seq peaks (see Figures 3E-G). Size of dots indicates p-value (two-sided Fisher’s exact test) and color indicates ratio of observed (Obs) versus expected (Exp) frequency. (F) Box plot showing the 4C-seq contact frequency over the time course for loop anchors that overlap with or are nearby (<5kb) to Early eTREs (Early, n=17 loops) versus anchors that contain only Middle, Late, or Transient eTREs (Rest, n=48 loops). Asterisks indicate significance (*p<0.05) for Early vs. Rest, two-sided Wilcoxon’s rank sum test. Not significant (ns) indicates p>0.05. (G) Stacked bar plot showing the percent of Fast, Gradual, and Slow reformed 4C-seq loops overlapping or near (<5kb) to Early (n=27), Middle (n=46), Late (n=49), or Transient (n=19) eTREs. Any loop anchor >5kb from all eTREs was shown as “None” (n=167). (H) 4C-seq data is represented as average CPM around the viewpoint (Sox2 promoter) with each time point shown as an overlapping bar plot. Genome browser tracks underneath show eTRE reactivation clusters (Early, Middle, Late, and Transient) and H3K27ac ChIP-seq in mitotic and asynchronous cells. The Sox2 super-enhancer (Early eTREs) is highlighted in green while another enhancer region (Late eTREs) is highlighted in purple. (I) Line plot showing Hi-C contact strength for loops with an anchor containing a PSC SE (Whyte et al., 2013) (n=253) versus loops containing any other eTREs (n=6073). Error bars show upper and lower limit of the 95% confidence interval. Asterisks indicate significance (* p<0.01, ** p<0.001, *** p<0.0001) for SEs vs. Other eTREs, two-sided Wilcoxon’s rank sum test. (J) 4C-seq data representation (as shown in (H)) around the Gata6 promoter. Genome browser tracks underneath show raw PRO-seq reads for each time point, H3K27ac ChIP-seq in mitotic and asynchronous cells, and H3K27ac ChIP-seq in asynchronous eXtraembryonic ENdoderm (XEN) stem cells. A retained contact between the Gata6 promoter and a proximal enhancer is highlighted in orange. Arrows indicate visually-detected transient or slow formed contacts. See also Figure S5 and Tables S3, S5, S6
Figure 6.
Figure 6.
Loss of mitotic H3K27ac perturbs transcriptional reactivation during G1 entry with no effects in 3D chromatin reorganization (A) Schematic illustration of our strategy for selectively depleting H3K27ac during mitosis and in asynchronous cells by treating for 3 hrs with the p300/CBP inhibitor A485 (p300i) or DMSO control prior to releasing into fresh media without the inhibitor for 1hr (see methods). (B) Average line plot showing the H3K27ac signal (ratio ChIP/input) for DMSO- (teal) and p300i- (orange) treated samples at each time point. Solid and dashed lines indicate individual replicates. Line plots are centered (+/−2.5kb) around the 29,965 peaks called in MIT, EG1, and/or ASYN DMSO samples. (C) Principal Component Analysis (PCA) analysis of MIT, EG1, ASYN, and ASYN+1 PRO-seq samples after DMSO (−) or p300i (+) treatment and recovery. A, B and C indicate independent replicates. (D) Violin plot shows the percent decrease in PRO-seq signal in p300i- vs. DMSO-treated samples for all genes expressed at each time point (RPKM>1). Asterisks indicate significance (***p<0.0001) for all pairwise comparisons, two-sided Wilcoxon’s rank sum test. (E) Venn diagram of the overlap between downregulated, differentially-expressed genes (DEGs) after p300i treatment in EG1 and ASYN+1 (see also Figure S6B). (F) Relative enrichment or depletion of Retained or Lost H3K27ac ChIP-seq peaks at the promoter (+/−2.5kb from TSS, at least 1bp overlap) of downregulated DEGs (EG1 only, ASYN+1 only, or Both, see Figure 6E). Size of dots indicates p-value (two-sided Fisher’s exact test) and color indicates ratio of observed (Obs) versus expected (Exp) frequency. Genes containing multiple peak types were prioritized by Retained>Lost. (G) Principal Component Analysis (PCA) analysis of Hi-C data (based on compartment eigenvalues for each 100kb bin) for MIT, EG1, ASYN, and ASYN+1 samples after DMSO (−) or p300i (+) treatment and recovery. (H) Line plot shows median compartmentalization (eigenvalue) of A compartments (top) and B compartments (bottom) in DMSO- and p300i-treated Hi-C samples at each time point. Error bars show upper and lower limit of the 95% confidence interval. Asterisks indicate significance (* p<0.01, ** p<0.001, *** p<0.0001) for DMSO versus p300i, two-sided Wilcoxon’s rank sum test. Not significant (ns) indicates p>0.01. (I) Genome browser tracks for chr1:55,000,000-68,000,000 (13Mb) showing the PRO-seq data (merge of triplicates) and H3K27ac ChIP-seq data (one replicate) for ASYN DMSO and ASYN p300i samples, indicating the global decrease in transcription and H3K27ac levels after p300 inhibition. Below, the Hi-C heatmap for the same region shows no effect on 3D chromatin architecture (ASYN DMSO on upper right; ASYN p300i on lower left). Hi-C data was visualized using Juicebox (Robinson et al., 2018) at 20kb resolution. (J) Aggregated peak analysis (APA) showing the aggregate Hi-C signal of DMSO- and p300i-treated Hi-C samples at each time point centered around our high-confidence Hi-C loops as identified in Figure 5A (see methods). Bin size, 10kb. The APA score, calculated as the ratio of the number of contacts in the central bin to the mean number of contacts in the lower-left corner, is shown at the lower left (outlined by a black box). (K) Violin plot shows compartmentalization (eigenvalue) during EG1 after DMSO or p300i treatment/recovery, focusing specifically around compartments containing EG1 DEGs and nonDEGs. Asterisks indicate significance (*** p<0.0001) for all relevant pairwise comparisons, two-sided Wilcoxon’s rank sum test. Not significant (ns) indicates p>0.01. See also Figures S6, S7 and Tables S4, S6
Figure 7.
Figure 7.
Resetting of PSC identity during G1 entry Model summarizing the transcriptional and topological resetting of pluripotent stem cell identity during G1 entry. The top half describes the waves of transcriptional (re)activation while the bottom shows the kinetics of 3D chromatin architecture reorganization. In both cases, the dashed line indicates full resetting of the interphase state. Transcriptional reactivation is disrupted by loss of H3K27ac bookmarking while architectural resetting is unaffected.

References

    1. Abramo K, Valton A-L, Venev SV, Ozadam H, Fox AN, and Dekker J (2019). A chromosome folding intermediate at the condensin-to-cohesin transition during telophase. Nature cell biology 21, 1393–1402. - PMC - PubMed
    1. Alipour E, and Marko JF (2012). Self-organization of domain structures by DNA-loop-extruding enzymes. Nucleic Acids Res 40, 11202–11212. - PMC - PubMed
    1. Anders S, and Huber W (2010). Differential expression analysis for sequence count data. Genome Biology 11, R106. - PMC - PubMed
    1. Anders S, Pyl PT, and Huber W (2015). HTSeq--a Python framework to work with high-throughput sequencing data. Bioinformatics 31, 166–169. - PMC - PubMed
    1. Asenjo HG, Gallardo A, López-Onieva L, Tejada I, Martorell-Marugán J, Carmona-Sáez P, and Landeira D (2020). Polycomb regulation is coupled to cell cycle transition in pluripotent stem cells. Science Advances 6, eaay4768. - PMC - PubMed

Publication types

LinkOut - more resources