. 2021 Apr 19;56(8):1195-1209.e7.
doi: 10.1016/j.devcel.2021.02.023. Epub 2021 Mar 16.

Global mapping of glycosylation pathways in human-derived cells

Affiliations

Global mapping of glycosylation pathways in human-derived cells

Yi-Fan Huang et al. Dev Cell. .

Abstract

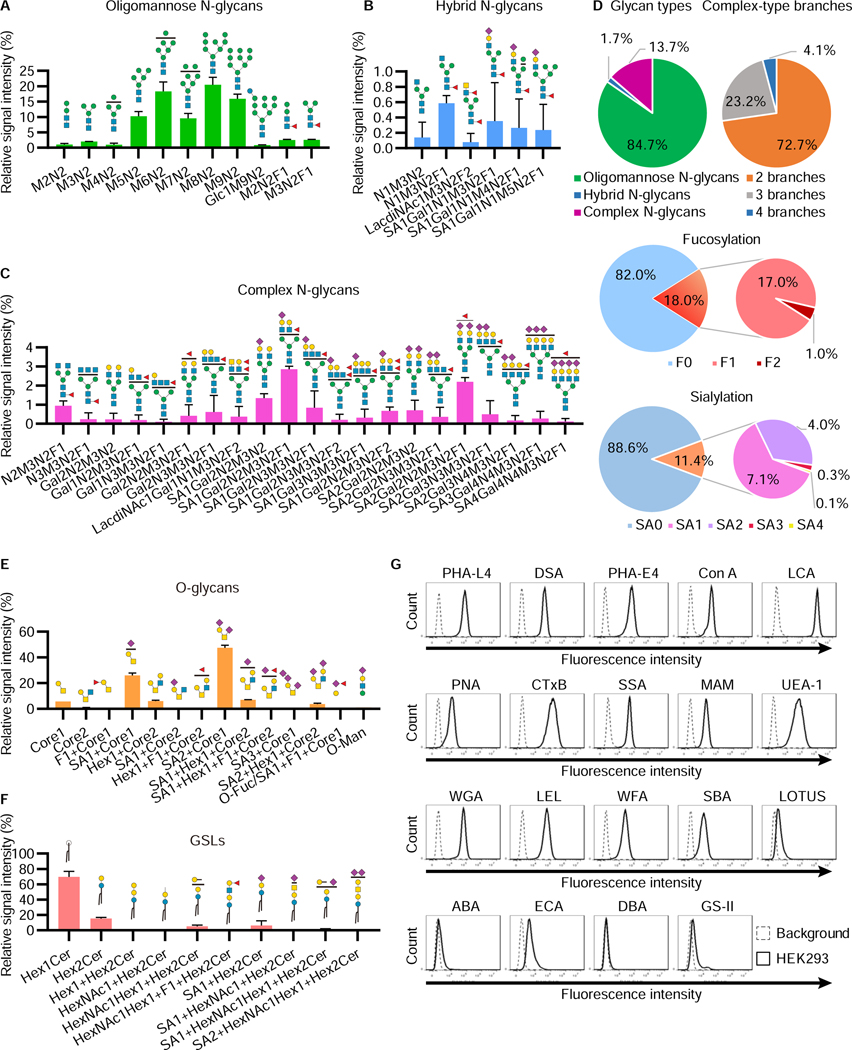
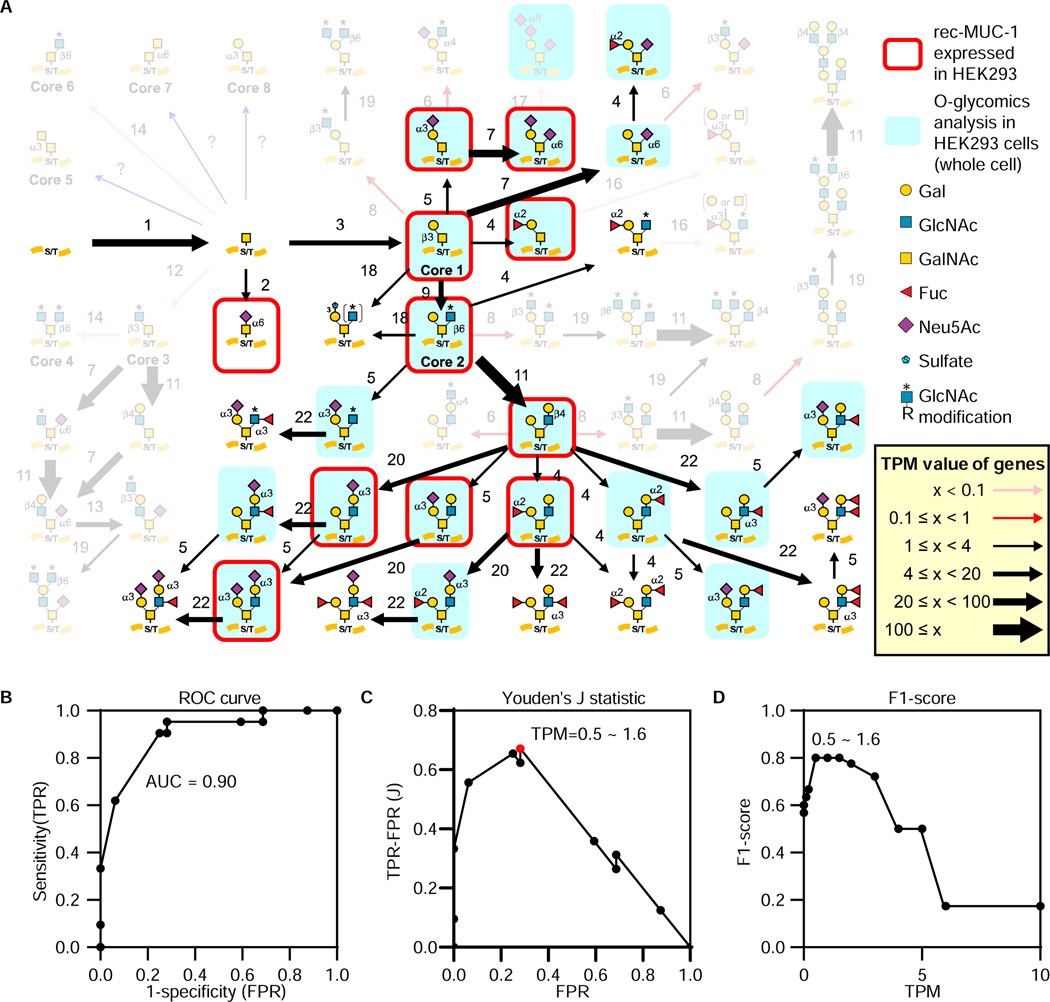
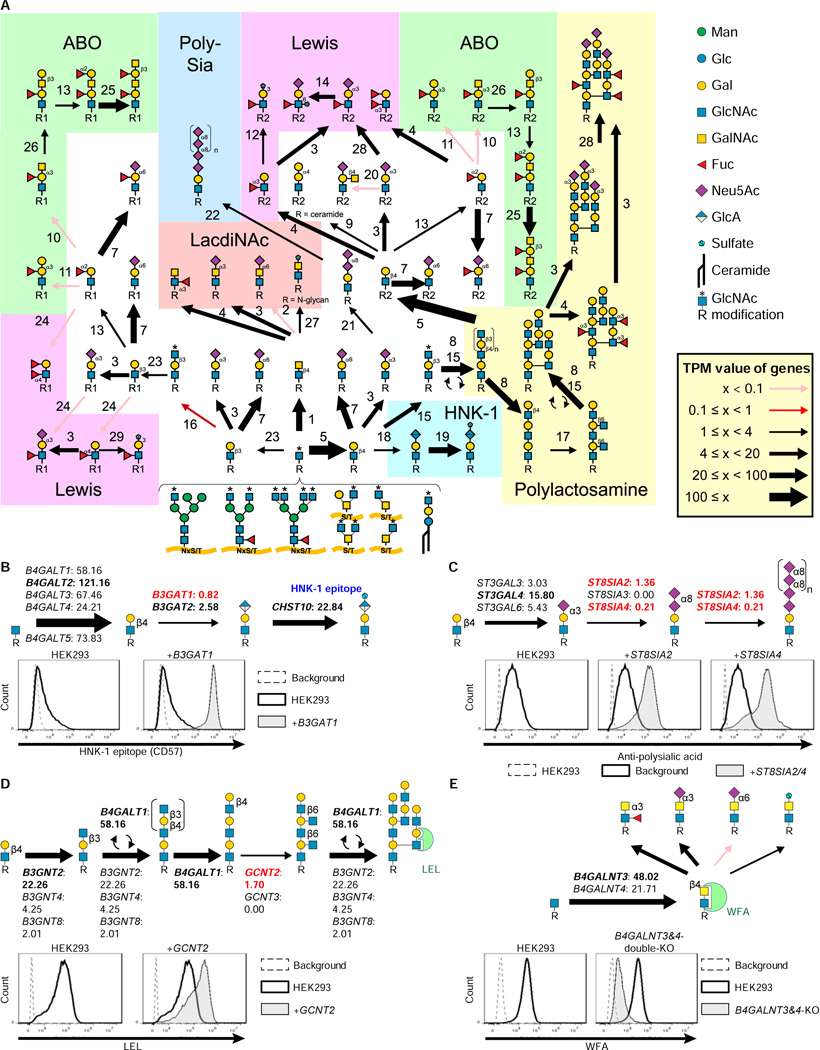
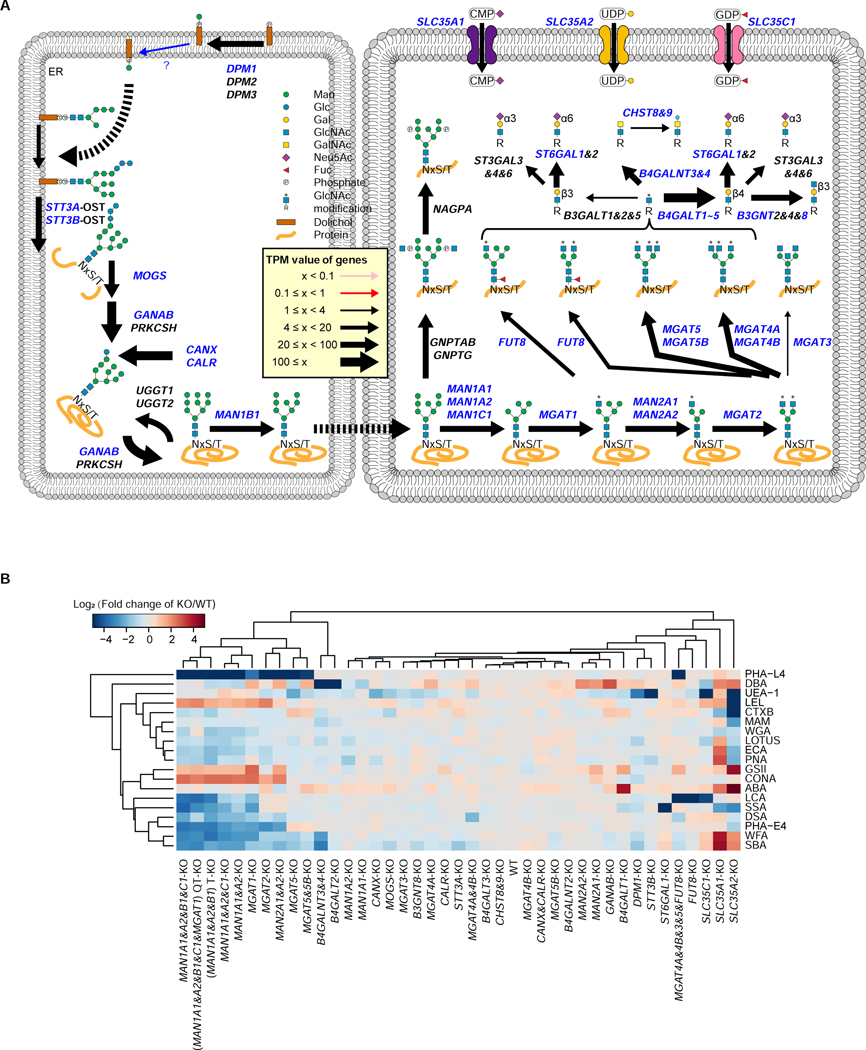
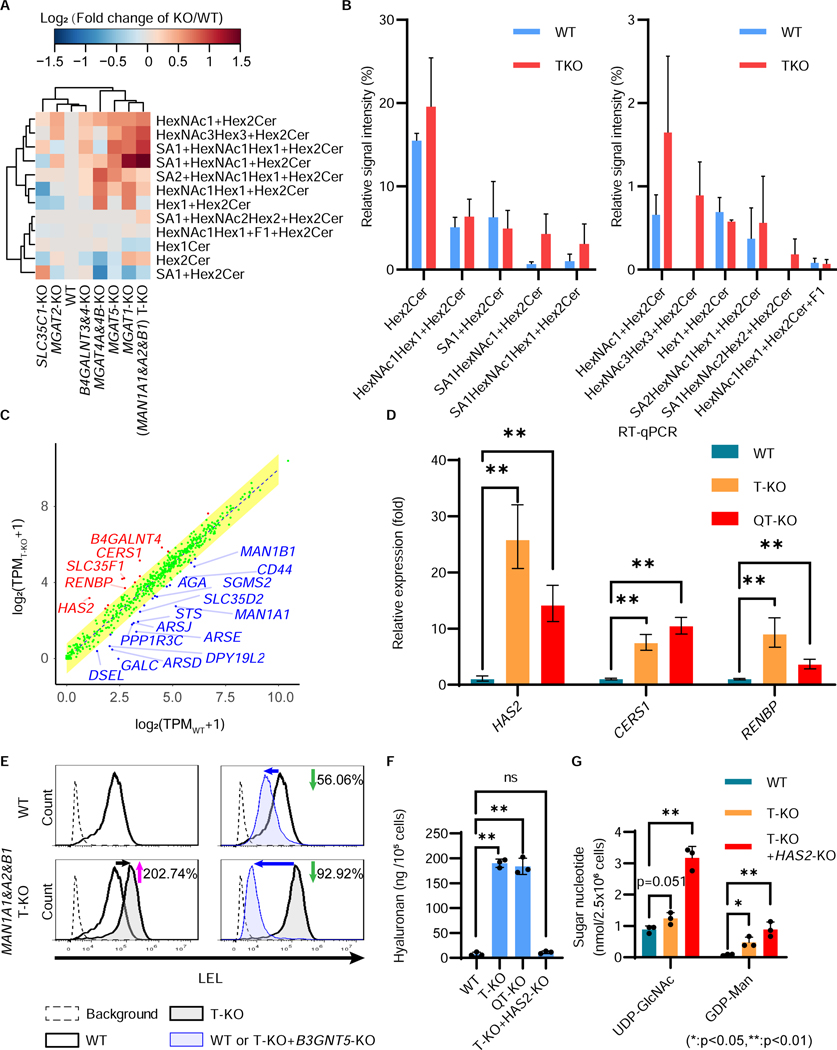
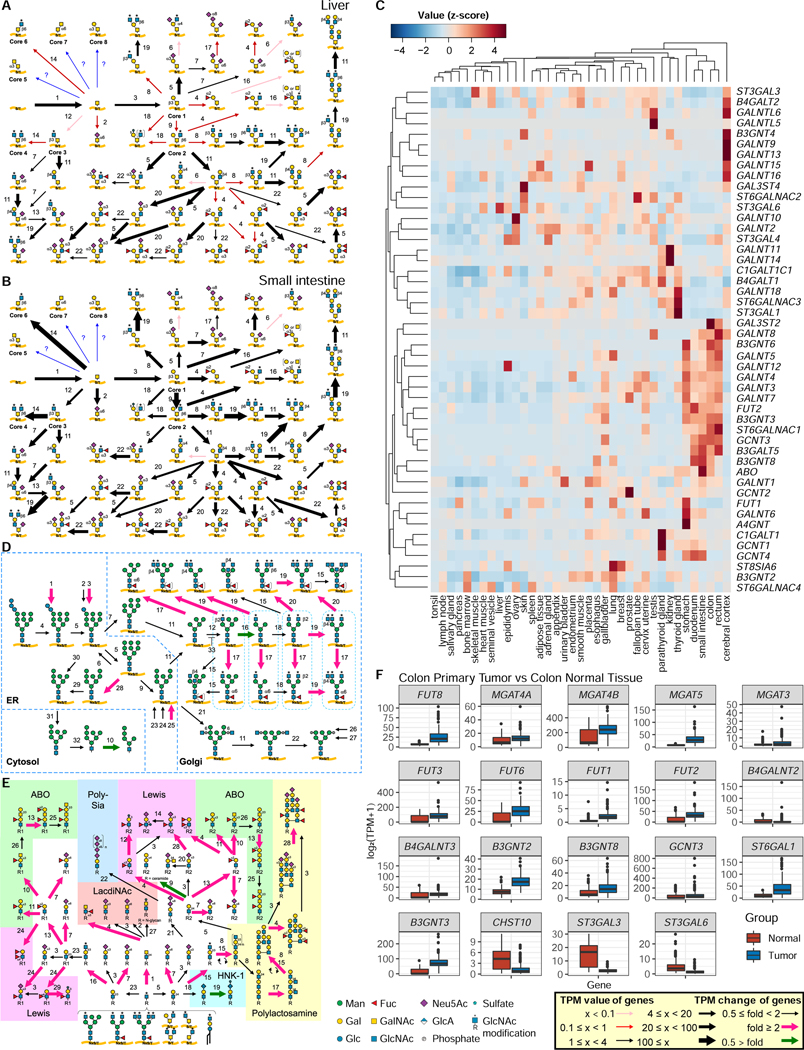
Glycans are one of the fundamental classes of macromolecules and are involved in a broad range of biological phenomena. A large variety of glycan structures can be synthesized depending on tissue or cell types and environmental changes. Here, we developed a comprehensive glycosylation mapping tool, termed GlycoMaple, to visualize and estimate glycan structures based on gene expression. We informatically selected 950 genes involved in glycosylation and its regulation. Expression profiles of these genes were mapped onto global glycan metabolic pathways to predict glycan structures, which were confirmed using glycomic analyses. Based on the predictions of N-glycan processing, we constructed 40 knockout HEK293 cell lines and analyzed the effects of gene knockout on glycan structures. Finally, the glycan structures of 64 cell lines, 37 tissues, and primary colon tumor tissues were estimated and compared using publicly available databases. Our systematic approach can accelerate glycan analyses and engineering in mammalian cells.

Keywords: GlycoMaple; glycogene; glycomics; glycoside hydrolase; glycosylation; glycosyltransferase; knockout cell library; lectin; pathway map.


Conflict of interest statement

Declaration of interests The authors declare no competing interests.

Figures

Figure 1.
Figure 1.. Glycomic analysis of HEK293 cells
A–D, Relative abundance of N-glycans in HEK293 cells. Permethylated N-glycan structures in HEK293 cells were analyzed using NSI-MS. The relative abundances of oligomannose (A), hybrid (B), and complex (C) N-glycan structures are shown. The symbol of each sugar follows the SNFG (Neelamegham et al., 2019). Fucoses represented on the N-glycan structures are attached to either the core or branches on N-glycans. Those fucosylated structures were mixtures of both structures (See Figure S1B). The distribution of N-glycan-type structures and the branch number of complex structures are shown, as well as the number of fucoses and sialic acids on N-glycans (D). The data represent the means ± errors from two independent experiments. E, F, Relative abundance of O-glycans (E) and GSLs (F) in HEK293 cells. The symbol of each sugar follows the SNFG. The blank circles and squares represent hexoses (Hex) and N-acetyl-hexosamines (HexNAc), respectively. The sugars such as fucose and sialic acid depicted at the top of each structure have multiple binding sites, which are represented as compositions (See Figure S1C, S1D, and Table S4). The data represent the means ± errors from two independent experiments. G, Lectin staining of glycan structures on the cell surface. HEK293 cells were incubated with 19 lectins conjugated with fluorescein or biotin and analyzed by flow cytometry. The data show representative results from at least three independent experiments.
Figure 2.
Figure 2.. Validation of GlycoMaple using mucin-type O-glycan structures in HEK293 cells
A, Mucin-type O-glycans were compared between GlycoMaple estimation and MS analysis. Gene expression in HEK293 cells was analyzed using RNA-seq. Based on the gene expression profile (TPM values), the mucin-type O-glycan biosynthetic pathways were visualized. Each arrow represents the expression of genes responsible for the reaction. Thin pink arrows (TPM < 0.1) or red arrows (0.1 ≤ TPM < 1) indicate that the responsible genes for the pathways are not expressed or rarely expressed in the cells, respectively. The black arrows (1 ≤ TPM) indicate that the genes in the pathways are considered to be expressed in the cells. The thickness of these arrows shows the expression levels of the genes: thin black arrows, 1 ≤ TPM < 4; normal black arrows, 4 ≤ TPM < 20; thick black arrows, 20 ≤ TPM < 100; very thick black arrows, 100 ≤ TPM. If several genes overlapped in a reaction, the maximum TPM value among the values of overlapped genes was used. When several gene products make a complex for a reaction, the minimum TPM value of the subunit genes was used. Blue arrows indicate the reactions for which the responsible genes are not clear. The O-glycans identified by MS glycomic analyses in HEK293 cells (Table S4) or on MUC-1 from HEK293 (Razawi et al., 2013) are shaded blue and/or outlined in red, respectively. Those not predicted by GlycoMaple are rendered opaque. Each numbered reaction and the responsible genes are listed in Table S3 and S5, respectively. B, Relationship between False Positive Rate (FPR) and True Positive Rate (TPR) obtained in Figure S2A was plotted as a ROC curve. The AUC value was calculated. C, D, Youden’s J statistic (C) and F1-score (D) at various TPM thresholds were plotted. The highest score of the Youden’s J statistic (highlighted as a red dot) was corresponding to the TPM thresholds from 0.5–1.6. F1-score also showed that TPM values at 0.5–1.6 were the best.
Figure 3.
Figure 3.. Visualization and estimation of capping structures in HEK293 cells
A, Visualization of the biosynthetic pathway for capping structures in HEK293 cells. The setting of arrows was described in Figure 2A. The TPM values of each gene are presented in Table S5. B, The biosynthesis pathway of the HNK-1 epitope. The expression of genes involved in HNK-1 epitope synthesis is shown. The TPM values (means from triplicated RNA-seq data) were used. HEK293 cells and HEK293 cells stably expressing B3GAT1 were stained with anti-CD57 (HNK-1) antibody followed by Alexa488-conjugated anti-mouse IgM. Cells were analyzed using flow cytometry. Background, without primary antibody. C, The biosynthesis pathway of polysialic acid. The expression of the genes involved in polysialic acid synthesis is shown. HEK293 cells and HEK293 cells stably expressing ST8SIA2 or ST8SIA4 were stained with anti-polysialic acid antibodies followed by PE-conjugated anti-mouse antibodies. D, The biosynthesis pathway of polylactosamine. The expression of genes required for polylactosamine structure synthesis is shown. HEK293 cells and HEK293 cells stably expressing GCNT2 were stained with FITC-conjugated LEL lectin and analyzed using flow cytometry. E, The biosynthesis pathway of LacdiNAc. The gene expression of B4GALNT3 and 4 in HEK293 cells is shown. HEK293 B4GALNT3 and 4 double-KO cells were stained with WFA lectin and analyzed using flow cytometry.
Figure 4.
Figure 4.. Construction of the KO cell library for the N-glycosylation pathway
A, Processing of the N-glycosylation pathway. Genes required for the N-glycosylation pathway are illustrated. Arrow thicknesses represent expression values as described in Figure 2A. The gene products highlighted in blue were knocked out in HEK293 cells. B, Lectin staining profiles of the KO cell library. Forty different KO cells were constructed in HEK293 cells and analyzed by staining with 19 lectins. The staining of HEK293 cells by each lectin was set as 1. The staining intensities of each lectin in the cells were compared with those of the HEK293 cells, and were calculated as relative intensities. The log2 values of the data are visualized as a clustered heatmap. The data used the mean value from two independent experiments.
Figure 5.
Figure 5.. Increase of LacNAc-containing GSLs and hyaluronan in MAN1A1&A2&B1-T-KO cells
A, Comparative GSL analysis of seven KO cells. Relative abundance of GSLs in HEK293 MAN1A1-, A2-, and B1-triple-KO (T-KO), MGAT1-KO, MGAT2-KO, MGAT4A&4B-KO, MGAT5-KO, B4GALNT3- and 4-KO, and SLC35C1-KO cells. The data are visualized as clustered heatmaps. The relative amounts of glycan structures in each cell type were calculated, and were compared with those of HEK293 cells. The log2 values of the data are visualized as heatmaps. The data used the mean value from two independent experiments. B, Relative abundance of GSL species in HEK293 WT and T-KO cells. The data represent the means ± errors from two independent experiments. C, Comparison of the expression of glycan-related genes in WT versus T-KO cells. TPM values (averages of triplicated data) were calculated and plotted as log2(TPM + 1) values. The yellow area represents the predicted interval expression in WT or T-KO cells. Representative examples of genes with higher expressions in WT or T-KO cells are indicated by blue or red text, respectively. It is noted that expression levels of genes MAN1A1 (0.16 fold), MAN1A2 (0.50 fold), and MAN1B1 (0.43 fold) were significantly down-regulated in T-KO cells, probably as results of nonsense-mediated mRNA decay. D, Quantitative RT-PCR analysis of CERS1, HAS2, and RENBP mRNA levels mRNA levels in HEK293 WT, T-KO, and QT-KO cells. HPRT (hypoxanthine phosphoribosyltransferase) was used to normalize the data. The bars represent RQ (relative quantification) values ± RQmax and RQmin (error bars), from triplicate samples. E, Enhanced LEL staining in MAN1A1&A2&B1-T-KO (T-KO) cells was due to an increase of GSLs. Flow cytometric analysis of cells stained by fluorescent-conjugated LEL. HEK293 wild-type (WT), T-KO, B3GNT5-KO, and T-KO+B3GNT5-KO cells were stained by fluorescent-conjugated LEL, and analyzed by flow cytometry. Background, without lectin staining. F, The levels of hyaluronan in the culture media of WT, T-KO, and QT-KO cells were quantified. The bars represent the means ± SD from triplicate samples. P-values (two-tailed, student’s t-test) are shown. G, Levels of UDP-GlcNAc and GDP-Man were analyzed using high-performance anion-exchange chromatography. The bars represent the means ± SD from triplicate samples. P-values (two-tailed, student’s t-test) are shown.
Figure 6.
Figure 6.. Comparison of glycosylation pathways among various tissues
A and B, Mucin-type O-glycosylation pathways in the liver (A) and small intestine (B) were visualized using GlycoMaple, based on gene expression profiles in the Human Protein Atlas (HPA). Each numbered reaction is listed in Table S3. C, Expression profiles of genes involved in mucin-type O-glycosylation in tissues. The TPM values of 48 genes required for mucin-type O-glycosylation in 37 human tissues deposited in the HPA were normalized (z-score) and are visualized as a clustered heatmap. D and E, Comparison of pathways using GlycoMaple. Gene expression profiles (median TPM values) in primary tumor (N = 288) and normal (N = 304) colon tissues were used to show the pathways. Fold changes that were > 2 and < 0.5 are shown as pink and green arrows, respectively. Each numbered reaction is listed in Table S3. F, Different expressions of glycan-related genes that were upregulated or downregulated in colon tumor tissue. N = 288 for primary tumor and N = 304 for normal tissues.

References

    1. Anumula KR, and Taylor PB (1992). A comprehensive procedure for preparation of partially methylated alditol acetates from glycoprotein carbohydrates. Anal Biochem 203, 101–108. - PubMed
    1. Aoki K, Heaps AD, Strauss KA, and Tiemeyer M. (2019). Mass spectrometric quantification of plasma glycosphingolipids in human GM3 ganglioside deficiency. Clinical Mass Spectrometry 14, 106–114. - PMC - PubMed
    1. Aoki K, Perlman M, Lim J-M, Cantu R, Wells L, and Tiemeyer M. (2007). Dynamic developmental elaboration of N-linked glycan complexity in the Drosophila melanogaster embryo. J Biol Chem 282, 9127–9142. - PubMed
    1. Aoki K, Porterfield M, Lee SS, Dong B, Nguyen K, McGlamry KH, and Tiemeyer M. (2008). The diversity of O-linked glycans expressed during Drosophila melanogaster development reflects stage- and tissue-specific requirements for cell signaling. J Biol Chem 283, 30385–30400. - PMC - PubMed
    1. Bah T. (2007). Inkscape: guide to a vector drawing program (prentice hall press; ).

Publication types

Substances