. 2021 May 4;120(9):1692-1704.
doi: 10.1016/j.bpj.2021.02.042. Epub 2021 Mar 17.

Rapid viscoelastic changes are a hallmark of early leukocyte activation

Affiliations

Rapid viscoelastic changes are a hallmark of early leukocyte activation

Alexandra Zak et al. Biophys J. .

Abstract

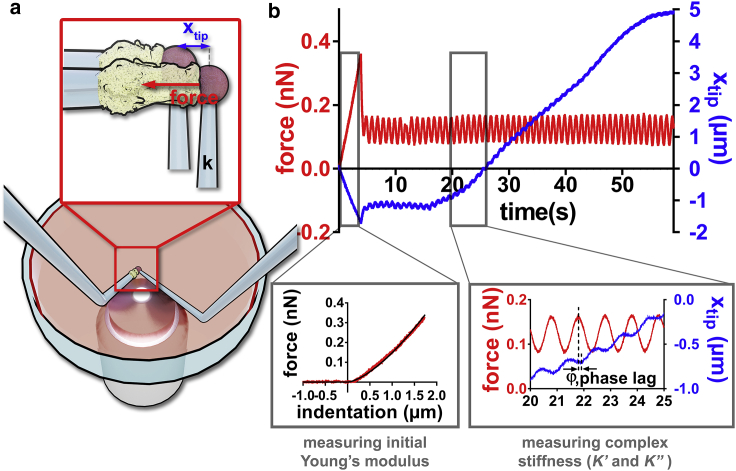
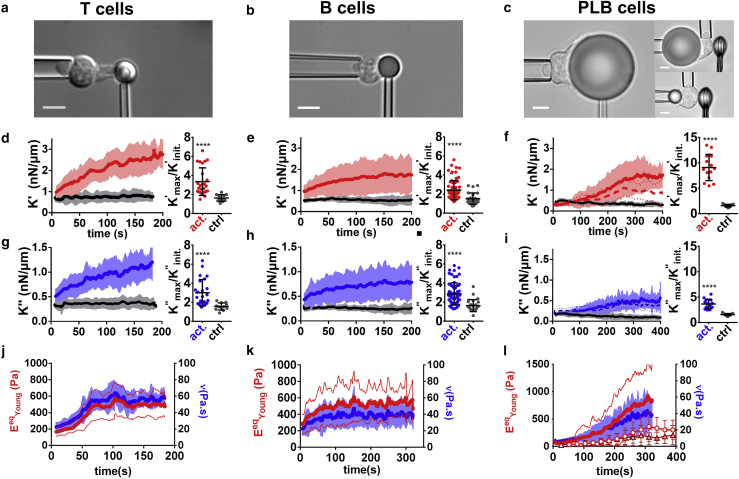
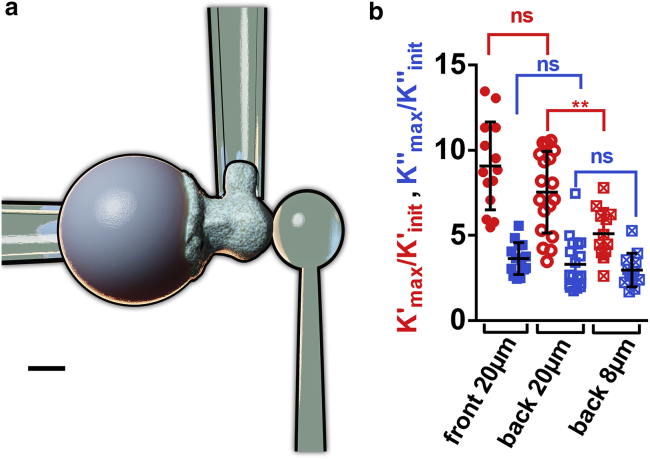
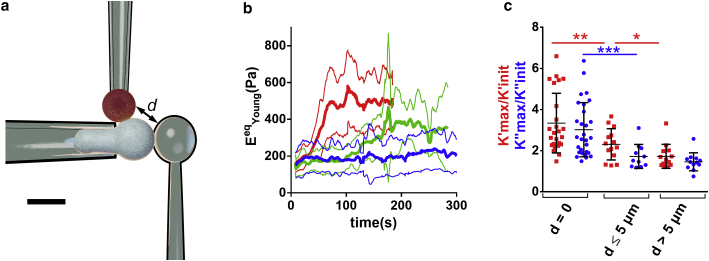
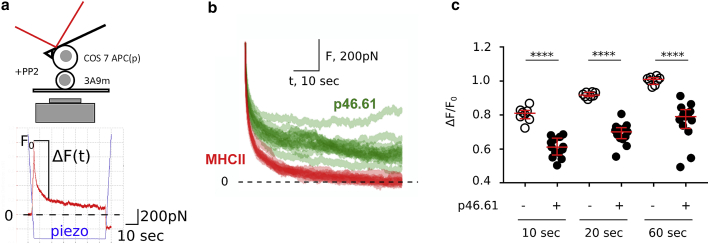
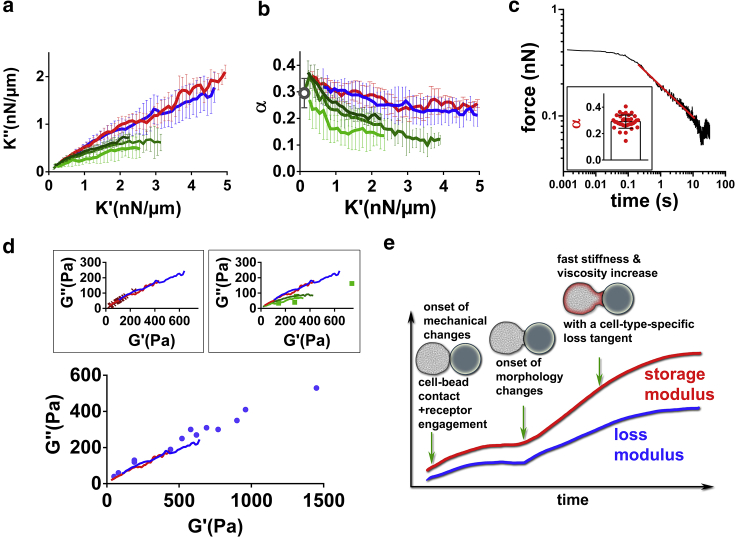
To accomplish their critical task of removing infected cells and fighting pathogens, leukocytes activate by forming specialized interfaces with other cells. The physics of this key immunological process are poorly understood, but it is important to understand them because leukocytes have been shown to react to their mechanical environment. Using an innovative micropipette rheometer, we show in three different types of leukocytes that, when stimulated by microbeads mimicking target cells, leukocytes become up to 10 times stiffer and more viscous. These mechanical changes start within seconds after contact and evolve rapidly over minutes. Remarkably, leukocyte elastic and viscous properties evolve in parallel, preserving a well-defined ratio that constitutes a mechanical signature specific to each cell type. Our results indicate that simultaneously tracking both elastic and viscous properties during an active cell process provides a new, to our knowledge, way to investigate cell mechanical processes. Our findings also suggest that dynamic immunomechanical measurements can help discriminate between leukocyte subtypes during activation.


Figures

Figure 1
Figure 1
Rheological measurements during leukocyte activation. (a) Setup. Two micropipettes are plunged in a petri dish. A flexible pipette (right, bending stiffness k ≈ 0.2 nN/μm) holds an activating microbead firmly. A rigid micropipette (left) gently holds a leukocyte (aspiration pressure of 10–100 Pa). The base of the flexible micropipette is displaced to impose a desired force on the cell. (b) Force applied on the cell (in red) and the position xtip of the tip of the flexible micropipette (in blue). The cell is first compressed with a force Fcomp (here 0.36 nN) to measure the initial Young’s modulus of the cell (inset, bottom left). Then an oscillatory force is applied to the cell, leading to an oscillatory xtip signal (inset, bottom right) superimposed to a slower variation of the average value <xtip> because of the growth of a protrusion produced by the leukocyte. To see this figure in color, go online.
Figure 2
Figure 2
Both K′ and K″ increase during leukocyte activation. Each column corresponds to a different cell type. (a–c) Cell morphology. Scale bars, 5 μm. (d-f) Left: K′ for activating (red lines) and nonactivating control beads (gray lines). In (f), the solid red line is for 20 μm beads and the dashed red line for 8 μm beads with indentation in the back (see Fig. 3). Right: maximal/minimal ratio of K′-values for activating and nonactivating control beads. Error bars are SDs. (gi) Left: K″-values corresponding to K′-values in (d)–(f). In (i), the solid blue line is for 20 μm beads and the dashed blue line for 8 μm beads with indentation in the back (see Fig. 3). Right: maximal/minimal ratio of K″-values for activating and nonactivating control beads. Error bars are SDs. (jl) Equivalent Young’s modulus (red, left axis) and cell viscosity (blue, right axis). In (l), dots are the Young’s modulus measured in the back of the cell for 20 μm beads, and triangles are for 8 μm beads. In all panels, leukocyte-bead contact time (t = 0) is detected as a force increase; thick lines are mean ± SD over at least three pooled experiments (T cells, 21 cells; B cells, 71 cells; PLB cells, 14 cells). Mann-Whitney test, ∗∗∗∗p < 0.0001. To see this figure in color, go online.
Figure 3
Figure 3
Indenting the “back” of a phagocyte during activation. (a) Modified setup. A stiff pipette holds the activating microbead (left), an auxiliary (stiff) pipette holds the cell by its “side” (top), and a flexible pipette whose tip consists of a nonadherent glass bead indents the cell on its “back” (right). Scale bar, 5 μm. (b) Maximal/minimal ratios for K′ and K″ obtained with both versions of the setup during PLB cell activation (ns: nonsignificant, two-tailed unpaired t-test). Using back indentation, in addition to the 20 μm beads used with the nonmodified setup, 8 μm beads were tested. Error bars are SDs. To see this figure in color, go online.
Figure 4
Figure 4
(a) Modified setup in which an auxiliary (stiff) pipette holds the activating microbead (top, red) to bring it in contact with the T cell at a chosen distance from a microindenter (right), which indents the cell on its “side” while the T cell gets activated. Scale bar, 5 μm. (b) Equivalent Young’s modulus for three different ranges of distance d between the activating bead and the microindenter (red: d = 0; green: 0 < d ≤ 5 μm; blue: d > 5 μm). Thick lines are means, thin lines are SDs. (c) Kmax/Kinit (red) and Kmax/Kinit (blue) ratios for the same ranges of distance d as in (b). Error bars are SDs. To see this figure in color, go online.
Figure 5
Figure 5
Cell-cell presentation induces early changes in force relaxation. (a) AFM SCFS setup (top) and example of individual force (in red) versus time curve (bottom). The piezo signal (in blue) reports the position of the base of the cantilever. (b) Relaxation part of force curves, for peptide (p46.61) versus no-peptide (MHCII) cases. One curve corresponds to one cycle, i.e., 1 APC-T cell couple. See Document S1. Supporting materials and methods and Figs. S1–S10, Video S1. Activation of three types of leukocytes studied with the micropipette rheometer, Video S2. Validation of the micropipette rheometer by performing microindentation measurements on a red blood cell, Video S3. Modified setup to indent the “back” of a PLB cell while the cell phagocytoses an activating bead on its “front”, Video S4. Cyclic indentation experiments to directly measure the Young’s modulus over time of a PLB cell phagocytozing an activating bead, Video S5. Modified setup using an auxiliary pipette to bring an activating microbead in contact with a T cell on its “side”h for plot of mean ± SD curves. (c) Quantification of the relaxation for three different time points for MHCII (−) and MHCII/p46.61 (+); ΔF/F0 is the ratio of the drop in force ΔF and the force level F0 imposed at initial time 0 (see a). This ratio is shown at three different times after cell-cell contact (10, 20, and 60 s) and shows a consistently lower ratio (hence a slower relaxation) in presence of the peptide (∗∗∗∗p < 0.001, Mann-Whitney). Bars are median and interquartile ranges. To see this figure in color, go online.
Figure 6
Figure 6
Relationship between elastic and viscous cell properties (a) K″ vs. K′ during activation of T cells (red), B cells (blue), and PLB cells (front indentation: green (20 μm beads), back indentation: light green (20 μm beads) and dark green (8 μm beads)). Error bar are SDs. (b) α = (2/π)arctan(K/K), corresponding to the same data as in (a). The gray circle is the value of the power-law exponent in force relaxation experiments on resting PLB cells. (c) Example of force relaxation curve of a PLB cell. In the log-log plot, a power-law relaxation is identified by the straight line (red), whose slope is the exponent α. Inset: individual α-values (one dot per cell). (d) Loss modulus G″ vs. storage modulus G′ obtained by Bufi et al. (67) (bottom, blue dots), Maksym et al. (6) (inset, top left, red crosses), and Roca-Cusachs et al. (2) (inset, top right, green dots). Our data from (a) (red and blue solid lines) are consistent with the abovementioned published data. (e) Proposed model of mechanical changes during leukocyte activation. To see this figure in color, go online.

Similar articles

Cited by

References

    1. Hochmuth R.M. Micropipette aspiration of living cells. J. Biomech. 2000;33:15–22. - PubMed
    1. Roca-Cusachs P., Almendros I., Navajas D. Rheology of passive and adhesion-activated neutrophils probed by atomic force microscopy. Biophys. J. 2006;91:3508–3518. - PMC - PubMed
    1. Wu P.-H., Aroush D.R.-B., Wirtz D. A comparison of methods to assess cell mechanical properties. Nat. Methods. 2018;15:491–498. - PMC - PubMed
    1. Toepfner N., Herold C., Guck J. Detection of human disease conditions by single-cell morpho-rheological phenotyping of blood. eLife. 2018;7:e29213. - PMC - PubMed
    1. Guillou L., Dahl J.B., Kumar S. Measuring cell viscoelastic properties using a microfluidic extensional flow device. Biophys. J. 2016;111:2039–2050. - PMC - PubMed

Publication types

LinkOut - more resources