. 2021 Mar 16;34(11):108871.
doi: 10.1016/j.celrep.2021.108871.

Circuit reorganization in the Drosophila mushroom body calyx accompanies memory consolidation

Affiliations

Circuit reorganization in the Drosophila mushroom body calyx accompanies memory consolidation

Lothar Baltruschat et al. Cell Rep. .

Abstract

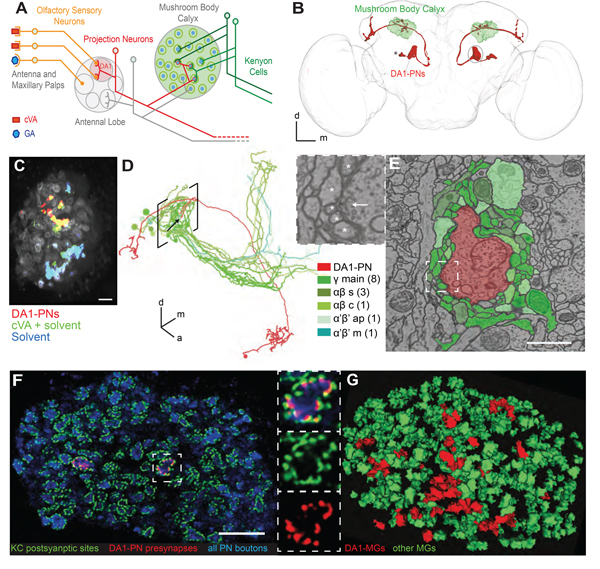
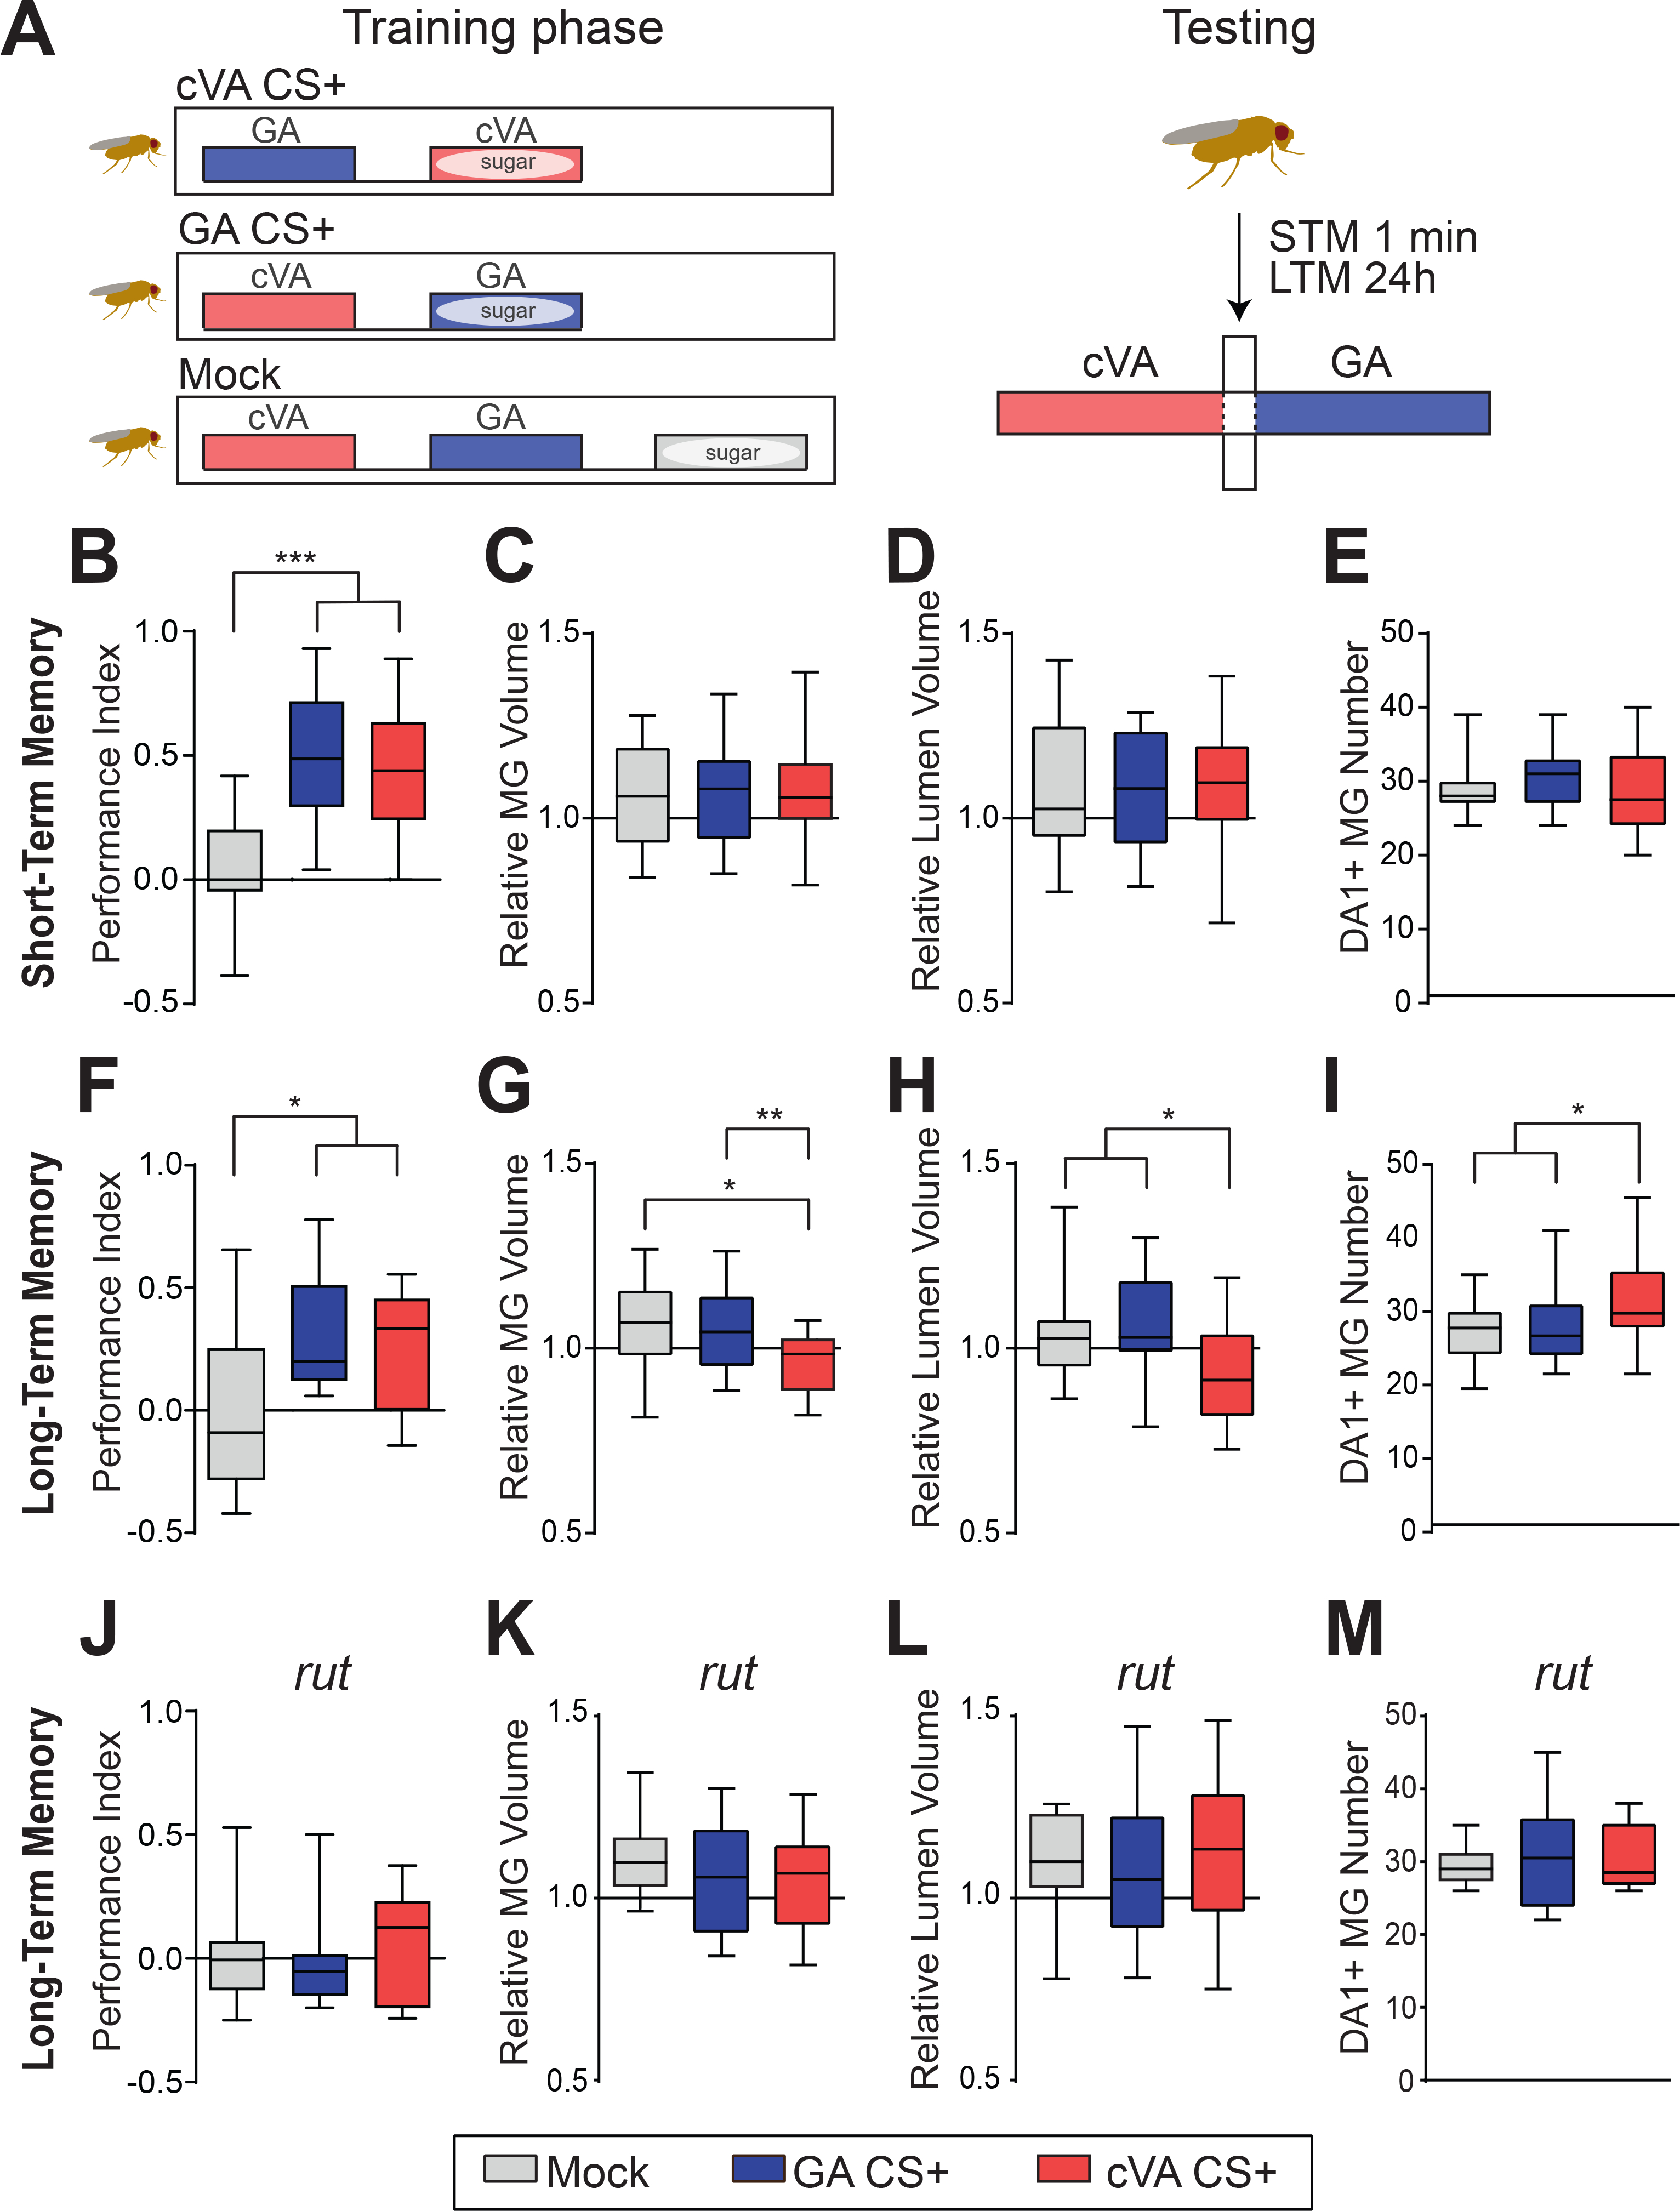
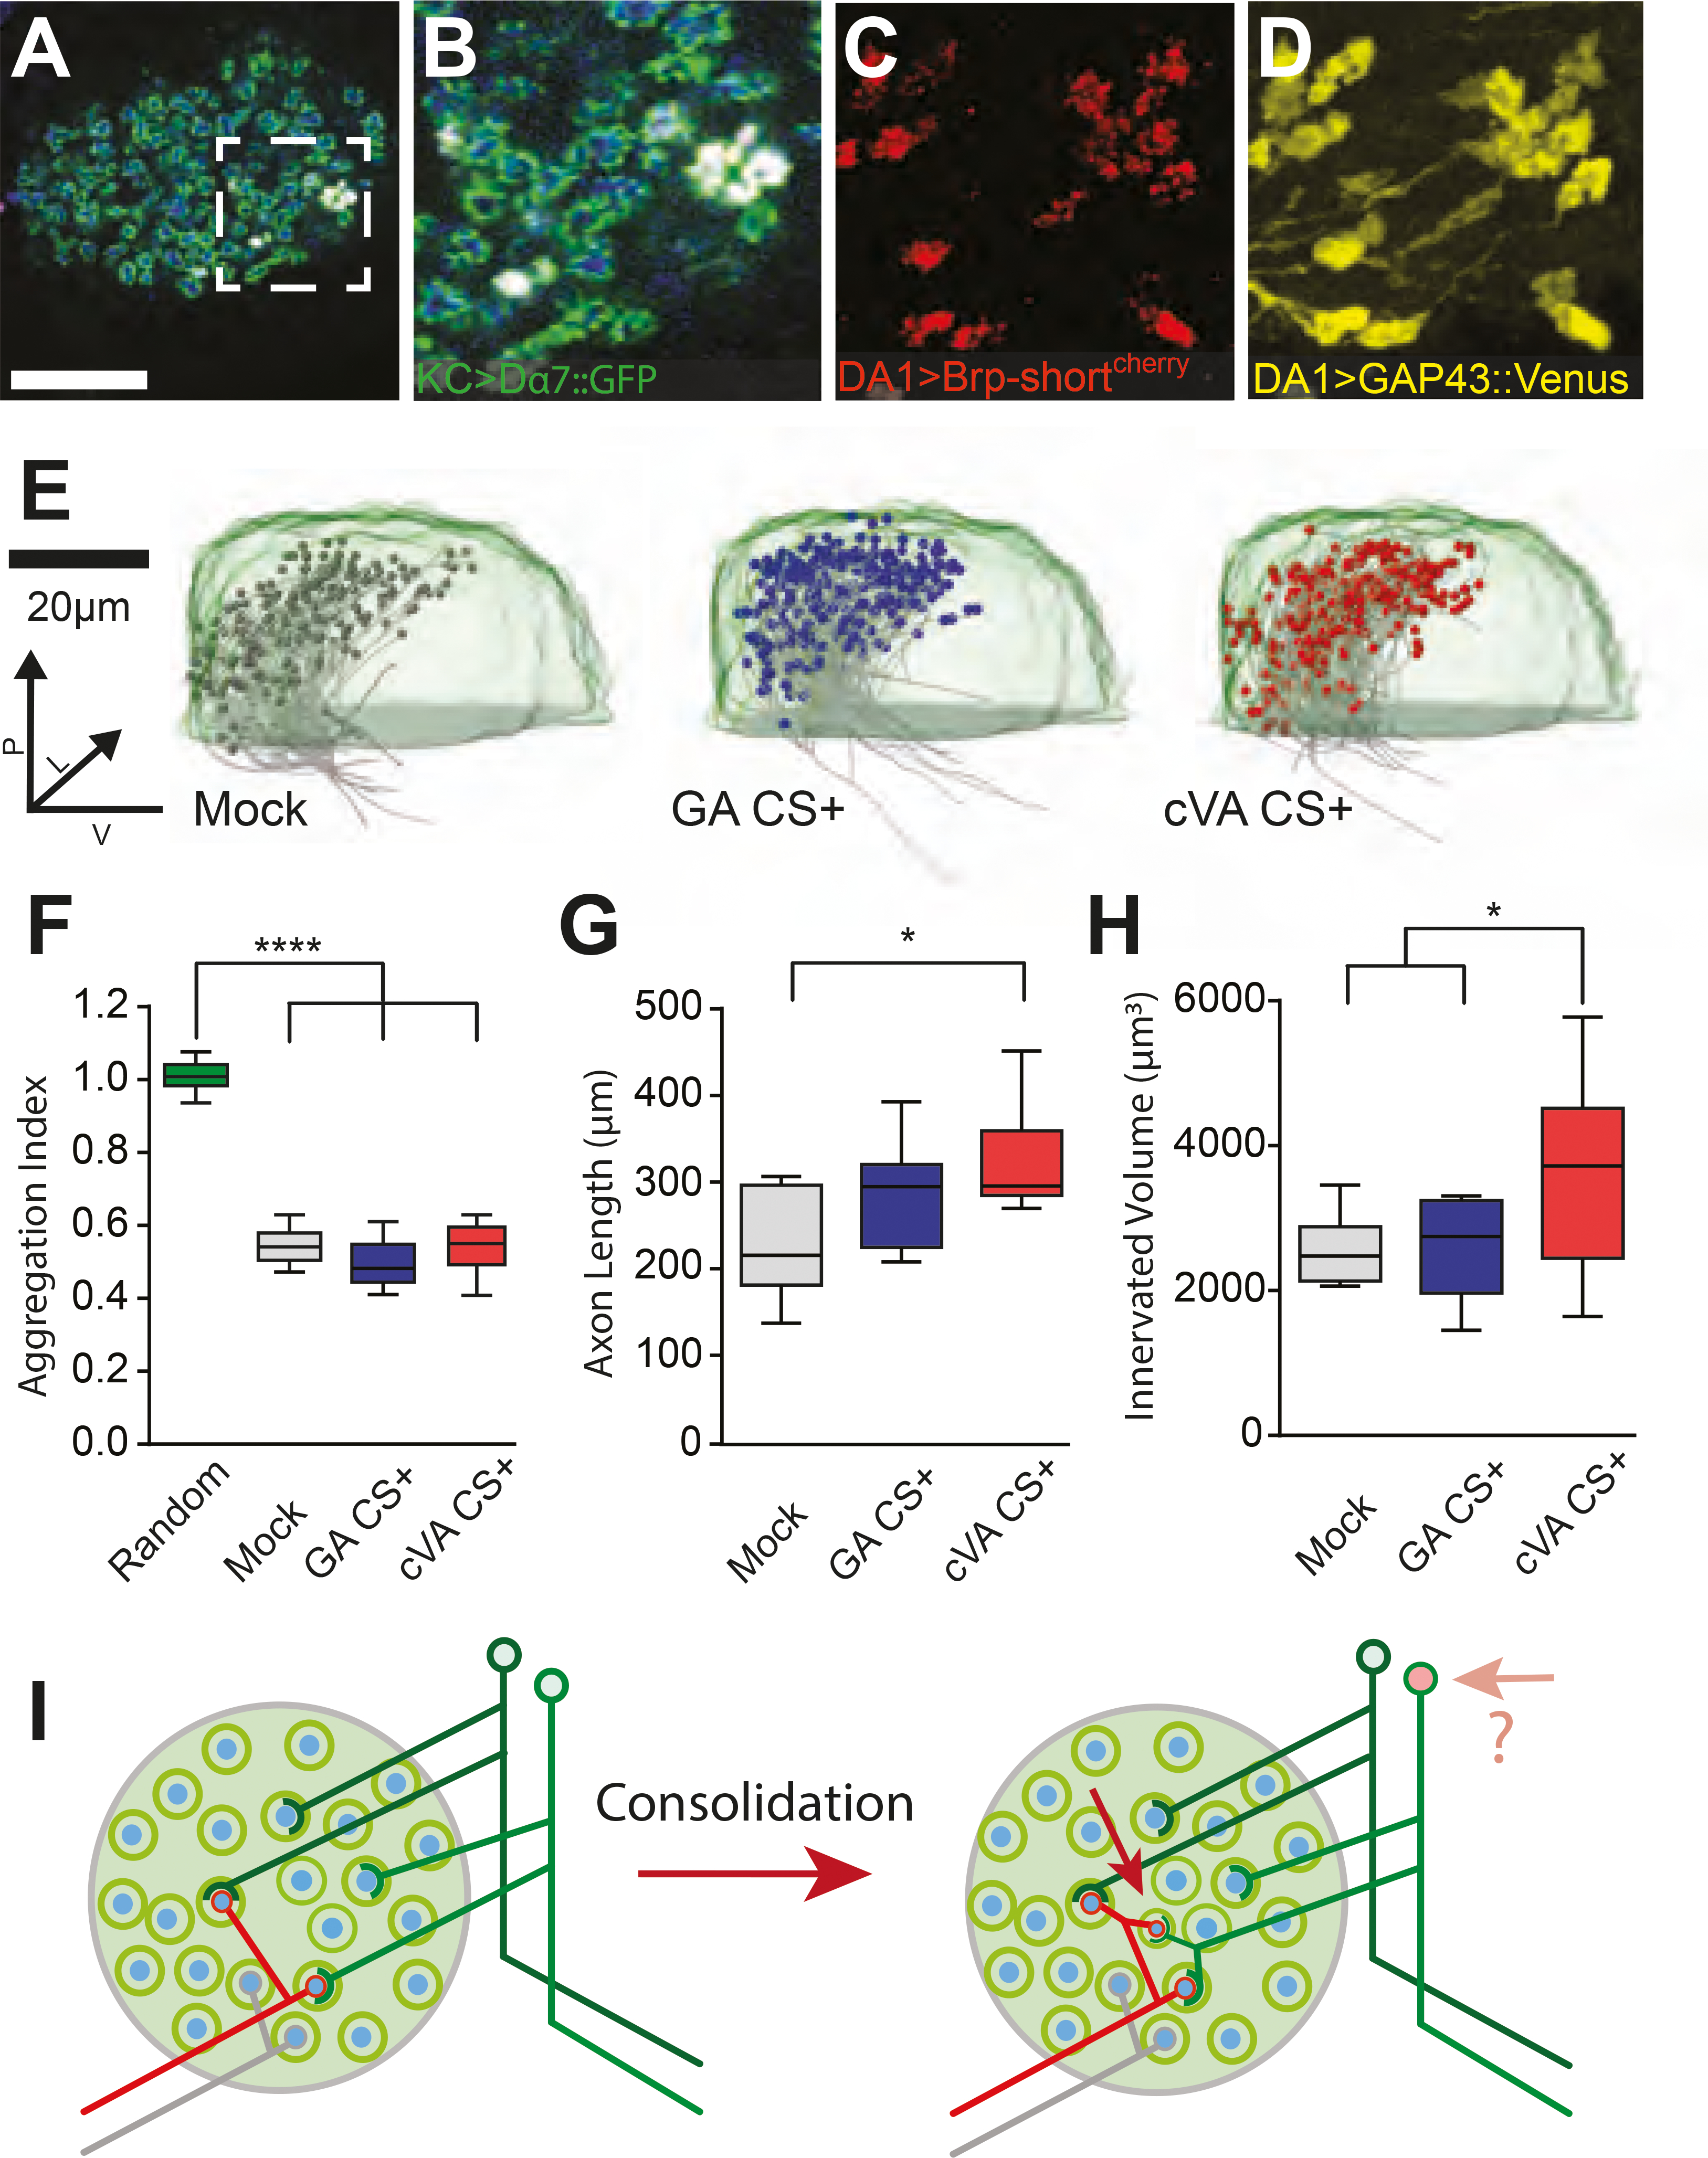
The formation and consolidation of memories are complex phenomena involving synaptic plasticity, microcircuit reorganization, and the formation of multiple representations within distinct circuits. To gain insight into the structural aspects of memory consolidation, we focus on the calyx of the Drosophila mushroom body. In this essential center, essential for olfactory learning, second- and third-order neurons connect through large synaptic microglomeruli, which we dissect at the electron microscopy level. Focusing on microglomeruli that respond to a specific odor, we reveal that appetitive long-term memory results in increased numbers of precisely those functional microglomeruli responding to the conditioned odor. Hindering memory consolidation by non-coincident presentation of odor and reward, by blocking protein synthesis, or by including memory mutants suppress these structural changes, revealing their tight correlation with the process of memory consolidation. Thus, olfactory long-term memory is associated with input-specific structural modifications in a high-order center of the fly brain.

Keywords: Drosophila; Kenyon cell; functional imaging; functional plasticity; memory consolidation; microglomerulus; mushroom body; mushroom body calyx; projection neuron; structural plasticity.


Conflict of interest statement

Declaration of interests The authors declare no competing interests.

Figures

Figure 1 |
Figure 1 |. Identification of the synapses in the MBC responding to cVA odor stimulation
(A) Schematic representation of the olfactory circuit starting from the activation of specific Olfactory Sensory Neurons (OSNs) by two exemplary odors cVA and GA. In the AL cVA-responsive OSNs converge to the DA1 glomerulus (pale red), where they synapse onto DA1-PNs (red). These deliver the cVA signal to the MBC via axon collaterals that terminate with boutons forming large synaptic complexes, the MGs (circles). Postsynaptic KCs are represented in green. (B) Reconstruction from a full confocal serial section set of the DA1-PNs (red; R37H08-Gal4> UAS GAP43::Venus); MBC (green; MB247-Dα7::GFP); DA1-PN cell bodies (*); brain neuropil (light grey; α-synapsin antibody). (C) Volumetric calcium imaging of the calyx of flies carrying MB247-Homer::GCaMP3 (grey) and in which DA1-PNs are genetically labelled (red; R37H08-Gal4> UAS tdTomato). cVA-elicited postsynaptic responses (green; cVA 1:400 dissolved in 5% EtOH) are specific to DA1-PNs as revealed by the overlap between the two channels (red + green= yellow). Generic response to the solvent (cyan= overlap of the responses to cVA 1:400 dissolved in 5% EtOH, green, and to 5% EtOH only, blue). Scale bar = 10 μm (D) Single DA1-PN (red) and the 14 KCs (green) postsynaptic to the DA1-PN bouton indicated by the arrow. Tracings performed on the EM FAFB dataset (Zheng et al., 2018). Square brackets indicate location of MBC. Different green shades represent different KC subtypes (as in E). Numbers in brackets in the legend represent the number of cells. (E) Single EM section through the MG (arrow in D). Scale bar = 1 μm. White square is magnified in left top panel with arrow pointing to a T-bar of the AZ and * labelling fine dendritic postsynaptic profiles of KCs. (F) Single plane confocal image of the MBC displaying PN boutons (blue; α-synapsin antibodies); the PSDs of KCs (green; MB247-Dα7::GFP) and the AZs of DA1-PN boutons only (red; R37H08-Gal4 > UAS-brp-shortcherry) identifying the cVA-responsive MGs. Scale bar = 10 μm. The MG in the white square is magnified in the right panels. (G) Automated 3D reconstruction of a confocal stack, including the image shown in (F). The reconstruction of MGs is based on Dα7-GFP (green) (see also Figure S1) and MGs receiving presynaptic input from DA1-PNs are marked by Brp–shortcherry (red). All other MGs are in green. Full genotypes used and statistics for all Figures are included in the Supplementary Table 2.
Figure 2 |
Figure 2 |. Microglomeruli undergo structural changes upon appetitive long-term memory formation
(A) Schematic illustration of the appetitive conditioning paradigm. For training, the conditioned odor cVA (red box) or GA (blue box) is paired with sugar. In STM experiments flies are trained for 2 min with a 2 min interval between CS+ and CS− presentation and tested 1 min after training. In LTM experiments flies are trained for 5 min + 5 min with a 2 min stimulus interval and are tested 24 h after training. In the mock control the two odors and the sugar reward are presented in a temporally spaced sequence with a 2 min inter-stimulus pause. (B, F, J) Performance indices of flies R37H08-Gal4/MB247-DαGFP, UAS-brp-shortcherry in the STM (B, ***p < 0.001, n = 19–25), or in the LTM paradigm (F, *p < 0.05, n = 14–19) and performance index of rut mutant flies in LTM (J, p > 0.05, n = 17–18). Performance index values of the mock control group (grey) were compared to groups trained with GA CS+ (blue) or cVA CS+ (red). Multiple comparisons are tested throughout this study with one-way ANOVA with Bonferroni correction. Significance level is set at p < 0.05. *p < 0.05, ****p < 0.0001. (C, G, K) The MG volume comprises the volume contained within a ring of MB247-Dα7::GFP PSDs and the volume of the MB247-Dα7::GFP PSDs. (D, H, L) The MG lumen is the volume contained within a ring of MB247-Dα7::GFP PSDs (see Figure S1D). In STM the relative volume (ratio of the average DA1-MG / non-DA1-MG per animal) of DA1- MGs (C) and of their lumen (D) is not different between groups (p > 0.05, n = 15–20). In LTM the relative MG volume (G) and lumen volume (H) of DA1- MGs in flies trained with cVA CS+ are smaller than in flies from the mock control group or of flies trained with GA CS+ (*p < 0.05, **p < 0.01, n = 19–25). (E, I, M) Number of DA1-PN positive MGs is unaffected in STM (E, p > 0.05, n = 18–24). In LTM, number of DA1-PN positive MGs in cVA CS+ trained flies is higher compared to flies of the mock control or GA CS+ group (I, *p < 0.05, n = 18–24). The structural modifications of DA1- MGs in cVA CS+ trained flies after the appetitive LTM protocol were suppressed in rut mutants (K-M, p > 0.05, n = 13–21). In all box plots, the edges of the boxes are the first and third quartiles, thick lines mark the medians, and whiskers represent data range.
Figure 3 |
Figure 3 |. Modifications of axon collaterals and wiring properties of projection neurons within the mushroom body calyx after long-term memory formation
(A) Single optical section of the MBC of flies expressing Dα7GFP (green) in the KCs and Brp-shortcherry (red) plus GAP43-Venus (yellow) in DA1-PNs (R37H08-Gal4); PN boutons (blue; anti-Synapsin antibodies). Scale bar = 20 μm. (B-D) Magnification of the white square in (A) displaying the merge as in A (B) or a maximum-intensity projection of Brp-shortcherry (C) or of GAP43-Venus (D) signals. (E) Medial view of registered PN axons (grey) with traced boutons (grey, blue, red spheres) within a standard calyx (light green). The registered PN traces are of mock (grey), GA CS+ (blue) or cVA CS+ (red) trained groups. n = 10 for each group. (F) Boutons are highly clustered independently of the treatment (Clark and Evans Aggregation index compared to a hypothetical random distribution. ****p < 0.0001, n = 10). (G) Total collateral axons length of mock control, GA CS+ or cVA CS+ flies. (*p < 0.05, n = 10). (H) The convex hull volume containing all DA1-boutons in the MBC per condition is increased in cVA CS+ flies compared to mock control and GA CS+ group (*p < 0.05, n = 10). (I) We suggest that the increased number of MGs after consolidation is due to the formation of additional boutons responding to cVA. The additional boutons form full MGs, as postsynaptic profiles of KCs surround them. It is unclear whether this reorganization might lead to the recruitment of additional responding KCs (see Discussion). In all box plots, the edges of the boxes are the first and third quartiles, thick lines mark the medians, and whiskers represent data range.
Figure 4 |
Figure 4 |. Functional plasticity in the mushroom body calyx associated with long-term memory
(A) Two-photon in vivo imaging setup. Schematic of a fly placed on a custom-made holder under a two-photon microscope equipped with a 40× 1.1 NA water immersion objective. The odor is delivered for 5s with a moisturized, constant air stream through a 1.2mm cannula. (Central panel) Z series of the entire MBC volume of flies expressing post-synapse-tagged Homer-GCaMP3 imaged during odor application at 1Hz (10 optical sections per volume, 4μm step size). (Right panel) A single slice of the image stack shown in the middle panel. Scale bar = 10 μm. (B) Representative optical section from a volumetric time series showing false-coloured response of KC dendrites to 5 s exposure to EtOH (top) or cVA + EtOH (bottom). (C) Magnification of the white square area in (B). 5×5 μm2 ROIs were classified as cVA-responsive (red) if they were only active during cVA + EtOH application, but did not respond to EtOH alone. ROIs that responded to both conditions were classified as Carrier. Scale bar = 5 μm. (D) The fraction of cVA responsive ROIs increased after LTM acquisition compared to the mock control (box plot represent first and third quartiles, thick lines mark the medians, and whiskers represent data range. *p < 0.05, n = 7). (E) Dynamics of ΔF/F% changes over time in KCs of MB247-homer::GCaMP3 flies after mock training (top) or LTM acquisition (bottom). Each row of the heat map represents average responses per animal of all cVA responsive ROIs (red) or of all carrier EtOH responsive ROIs (grey) within one MBC over time. Each column represents one 1s. Flies are first exposed to the EtOH (5s) and then to cVA + EtOH (5s) as indicated by the dashed lines. (F) Plot of average calcium dynamics over time of cVA responsive ROIs during 5 s stimulation with EtOH or with cVA in EtOH (dashed lines) in mock-trained (top) or cVA CS+ (bottom) flies (n = 7). Data represented as mean ± std.

Similar articles

Cited by

References

    1. ASO Y, HATTORI D, YU Y, JOHNSTON RM, IYER NA, NGO TT, DIONNE H, ABBOTT LF, AXEL R, TANIMOTO H & RUBIN GM 2014. The neuronal architecture of the mushroom body provides a logic for associative learning. Elife, 3, e04577. - PMC - PubMed
    1. BAILEY CH, BARTSCH D & KANDEL ER 1996. Toward a molecular definition of long-term memory storage. Proc Natl Acad Sci U S A, 93, 13445–52. - PMC - PubMed
    1. BASSETT DS, WYMBS NF, PORTER MA, MUCHA PJ, CARLSON JM & GRAFTON ST 2011. Dynamic reconfiguration of human brain networks during learning. Proc Natl Acad Sci U S A, 108, 7641–6. - PMC - PubMed
    1. BENNETT SH, KIRBY AJ & FINNERTY GT 2018. Rewiring the connectome: Evidence and effects. Neurosci Biobehav Rev, 88, 51–62. - PMC - PubMed
    1. BHANDAWAT V, OLSEN SR, GOUWENS NW, SCHLIEF ML & WILSON RI 2007. Sensory processing in the Drosophila antennal lobe increases reliability and separability of ensemble odor representations. Nat Neurosci, 10, 1474–82. - PMC - PubMed

Publication types

MeSH terms

LinkOut - more resources