. 2021 Mar 16;34(11):108858.
doi: 10.1016/j.celrep.2021.108858.

Organization and emergence of a mixed GABA-glycine retinal circuit that provides inhibition to mouse ON-sustained alpha retinal ganglion cells

Affiliations

Organization and emergence of a mixed GABA-glycine retinal circuit that provides inhibition to mouse ON-sustained alpha retinal ganglion cells

Abhilash Sawant et al. Cell Rep. .

Abstract

In the retina, amacrine interneurons inhibit retinal ganglion cell (RGC) dendrites to shape retinal output. Amacrine cells typically use either GABA or glycine to exert synaptic inhibition. Here, we combined transgenic tools with immunohistochemistry, electrophysiology, and 3D electron microscopy to determine the composition and organization of inhibitory synapses across the dendritic arbor of a well-characterized RGC type in the mouse retina: the ON-sustained alpha RGC. We find mixed GABA-glycine receptor synapses across this RGC type, unveiling the existence of "mixed" inhibitory synapses in the retinal circuit. Presynaptic amacrine boutons with dual release sites are apposed to ON-sustained alpha RGC postsynapses. We further reveal the sequence of postsynaptic assembly for these mixed synapses: GABA receptors precede glycine receptors, and a lack of early GABA receptor expression impedes the recruitment of glycine receptors. Together our findings uncover the organization and developmental profile of an additional motif of inhibition in the mammalian retina.

Keywords: GABA receptors; amacrine cells; glycine receptors; inhibition; retinal ganglion cell; synapses.


Conflict of interest statement

Declaration of interests The authors declare no competing interests.

Figures

Figure 1.
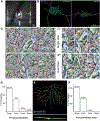
Figure 1.. Mixed GABA-glycine receptor postsynapses are localized across ONα dendrites
(A) Schematic of neural organization in mouse retina. Dim- and bright-light signals are sensed by rod and cone photoreceptors, which synapse onto rod and cone bipolar cells (BCs). Cone BCs provide direct excitatory input to ONα RGC at the inner plexiform layer, but rod BC signals are ferried to ONα RGC through AII interneurons. The ONα RGC receives inhibitory input from GABA and glycinergic amacrine cells (amacrine). (B) GABAAα3 (green) and GlyRα1 (magenta) receptor puncta within ONα RGC soma and proximal dendrites (blue) as visualized in the Thy1-YFP line. Inset shows higher magnification view of selected dendritic segment. White arrows point to three examples of colocalized GABAAα3 and GlyRα1 puncta. (C) Percentage colocalization of GlyRα1 puncta within ONα and GABAAα3 receptors. The random estimate was generated by flipping the GABAAα3 receptor channel 90° (n = 4 ONα RGCs from three retinas and three animals).
Figure 2.
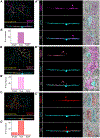
Figure 2.. GABA and glycine are not co-released from the same presynaptic release vesicle onto ONα RGCs
(A) Different scenarios as to how “mixed” GABA-glycine synapses could be organized. (B) An ONα RGC targeted for single-cell electrophysiology and filled with Alexa 594. (C) Exemplar traces of miniature inhibitory postsynaptic currents (mIPSCs) recorded from ONα in the presence of NBQX, D-APV, and TTX (control; black trace) and after application of GABAzine (red trace). (D) Quantification of mIPSC amplitude in control condition and after application of GABAzine. (E) Quantification of occurrence (frequency) of mIPSCs in control condition and after application of GABAzine. A significant reduction in mIPSC frequency (p = 0.0144) was observed. A paired two-tailed t test was performed for (D) and (E).
Figure 3.
Figure 3.. Inhibitory input with dual synaptic vesicle release sites uncovered by SBFSEM of inhibitory synapses across ONα RGCs
(A) An ONα in the Thy1-YFPH transgenic line after burning of fiduciary marks to locate and reconstruct the cell by SBFSEM. (B) Three-dimensional (3D) reconstruction of the ONα RGC and proximal dendritic arbor (RGC, cyan-green) with annotated sites of inhibitory synaptic inputs (Inh synapse, red). (C) Exemplar sections from a region of the ONα dendrite (cyan) with annotated inhibitory synapses containing single (top image) and dual (bottom image) release sites. (D) (Cʹ and Cʹʹ) Magnified view of inhibitory synapses on the ONα arbor (cyan) with single (Cʹ) and dual (Cʹʹ) synaptic vesicle release sites. Each synaptic vesicle release site is demarcated with a red line. (D) Distribution of inhibitory synapses across the ONα as sorted into synapses with single, dual, triple, and quadruple release sites. This distribution was determined from the NIRBed ONα RGC. (E) Top-down view of the dendritic arbor of an ONα RGC (cyan, reconstructed from k0725 dataset) with all dual synaptic vesicle release sites annotated (yellow). The bottom panel shows a side profile of the ONα with dual inhibitory synaptic sites distributed across both the proximal and distal dendritic arbor. (F) Distribution of inhibitory synapses across the entire dendritic arbor of the ONα as sorted into synapses with single, dual, triple, and quadruple release sites. This distribution was determined from the ONα reconstructed from the k0725 dataset from Ding et al. (2016).
Figure 4.
Figure 4.. ON-laminating widefield amacrine cells provide inhibitory input onto ONα dendrites primarily at dual release sites
(A–C) Top-down view of SBFSEM reconstructions of three widefield ON-laminating amacrine cells that provide input onto the ONα dendritic arbor (cyan) at dual synaptic vesicle release sites (yellow). Widefield ON amacrine 1, magenta (A); widefield ON amacrine 2, pink (B); widefield ON amacrine 3, red (C). Bottom panels represent side profile of the amacrine neuron and ONα with dual synaptic sites annotated. (Aʹ–Cʹ) Distribution of the number of synapses with single, dual, or triple vesicle release sites the respective widefield ON amacrine cell makes onto the ONα dendritic arbor. (Aʹʹ–Cʹʹ) Three-dimensional (3D) reconstruction of the widefield ON amacrine cell and the ONα RGC with three example raw EM images demonstrating inhibitory synaptic contact between the respective amacrine and ONα RGC at synapses with two synaptic vesicle release sites. Each synaptic vesicle release site is demarcated with a red line. All reconstructions performed on the k0725 dataset from Ding et al. (2016).
Figure 5.
Figure 5.. GABAergic synapses are established before glycinergic synapses on the ONα RGC dendritic arbor
(A) ONα RGC co-labeling with GABAAα3 and GlyRα1 across time points in the Thy1-YFP line (P, postnatal day). GABAAα3 (green) and GlyRα1 (magenta) signal within the RGC is overlaid on the RGC channel (blue), followed by a merge of only the receptor signals within the cell. (B) ONα RGCs co-labeling with gephyrin across development. Gephyrin signal within the cell (yellow) is overlaid on the RGC channel (blue). For (A) and (B), below the full RGC 3D view is a short dendritic segment at higher magnification (regions selected for each stack annotated with a rectangle). (C) Quantification of the percentage dendritic occupancy of each postsynaptic marker (GABAAα3, green; gephyrin, yellow; GlyRα1, magenta) within developing ONα RGCs. Number of cells quantified at each time point in parenthesis (the different colors correspond to the number of cells analyzed for the specific synaptic marker). N ≥ 3 animals. P8 versus P12 GABAAα3 (p = 0.0135) and P8 versus P12 GlyRα1 (p = 0.0025) RGC occupancies were significantly different. An unpaired two-tailed t test was performed. Scale bars, 30 μm.
Figure 6.
Figure 6.. ONα GlyR clusters are downregulated in the GABAAα3KO
(A) Three-dimensional (3D) en face view of an ONα RGC (red) in littermate control (Ctrl; top panel) and GABAAα3KO (α3KO; bottom panel) in Thy1-YFP × GABAAα3KO double-transgenic immunolabeled for glycine receptor a1 sites (GlyRα1, yellow; insets show higher magnification view of select dendritic segments). Detected GlyRα1 within the soma (magenta) and dendritic arbor (cyan) of the ONα were both downregulated in the α3KO RGC compared with Ctrl. (B) Quantification of the total number of detected GyRα1 puncta, GlyRα1 puncta within the dendrites, and GlyRα1 puncta within the ONα RGC soma in the α3KO and Ctrl. All fractions of GlyRα1 are significantly reduced in the α3KO compared with Ctrl. Numbers in parentheses are number of cells, number of animals sampled. An unpaired two-tailed t test was performed.
Figure 7.
Figure 7.. GABAAγ2 but not gephyrin is downregulated across ONα arbors in the absence of GABAAα3
(A) Dendritic segment of an ONα RGC in the Thy1-GABAAγ2YFP (green) transgenic line with co-labeling for GABAAα3 (red) and gephyrin (magenta) demonstrating that these postsynaptic proteins are colocalized across ONα inhibitory synapses. (B) Three-dimensional (3D) en face view of ONα RGCs in littermate control (Ctrl; top panel) and GABAAα3KO (α3KO; bottom panel) retina crossed into the Thy1-GABAAγ2YFP line. ONα RGCs in the Thy1-GABAAγ2YFP × GABAAα3KO double-transgenic were visualized by biolistic transfection (CMV-tdTomato; red). GABAAγ2 receptor puncta detected within the ONα RGC (green) are downregulated in the α3KO. (C) Co-labeling of ONα (red) in Ctrl (top panel) and α3KO-Thy1-YFP (bottom panel) retina with gephyrin (detected puncta within RGC visualized in green). (D) Top panel: quantification of total and dendritic GABAAγ2 puncta within Ctrl and α3KO ONα RGCs. Bottom panel: quantification of total and dendritic gephyrin puncta within Ctrl and α3KO ONα RGCs. Numbers in parentheses are number of cells, number of animals sampled. An unpaired two-tailed t test was performed.

Similar articles

Cited by

References

    1. Antinucci P, and Hindges R (2018). Orientation-selective retinal circuits in vertebrates. Front. Neural Circuits 12, 11. - PMC - PubMed
    1. Baden T, Berens P, Franke K, Román Rosón M, Bethge M, and Euler T (2016). The functional diversity of retinal ganglion cells in the mouse. Nature 529, 345–350. - PMC - PubMed
    1. Bagnall MW, Hull C, Bushong EA, Ellisman MH, and Scanziani M (2011). Multiple clusters of release sites formed by individual thalamic afferents onto cortical interneurons ensure reliable transmission. Neuron 71, 180–194. - PMC - PubMed
    1. Bishop D, Nikić I, Brinkoetter M, Knecht S, Potz S, Kerschensteiner M, and Misgeld T (2011). Near-infrared branding efficiently correlates light and electron microscopy. Nat. Methods 8, 568–570. - PubMed
    1. Bleckert A, Parker ED, Kang Y, Pancaroglu R, Soto F, Lewis R, Craig AM, and Wong RO (2013). Spatial relationships between GABAergic and glutamatergic synapses on the dendrites of distinct types of mouse retinal ganglion cells across development. PLoS ONE 8, e69612. - PMC - PubMed

Publication types