. 2021 Mar 16;34(11):108861.
doi: 10.1016/j.celrep.2021.108861.

Antigen presentation between T cells drives Th17 polarization under conditions of limiting antigen

Affiliations

Antigen presentation between T cells drives Th17 polarization under conditions of limiting antigen

Viola L Boccasavia et al. Cell Rep. .

Abstract

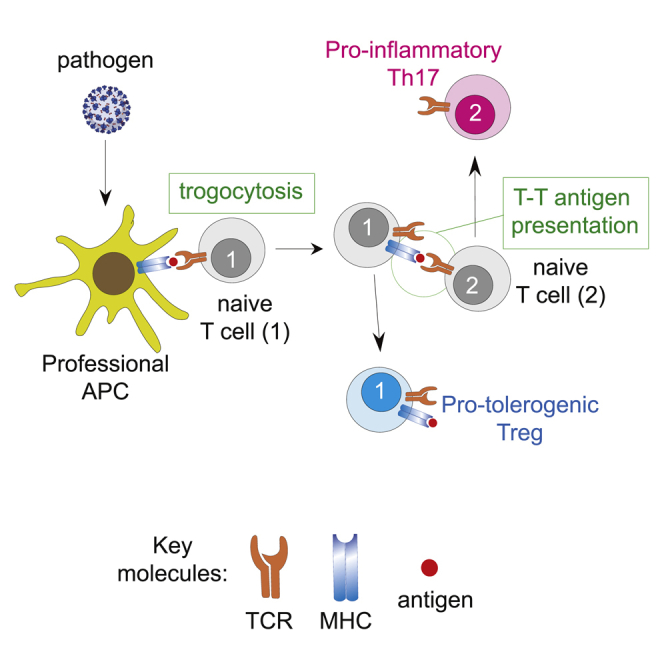
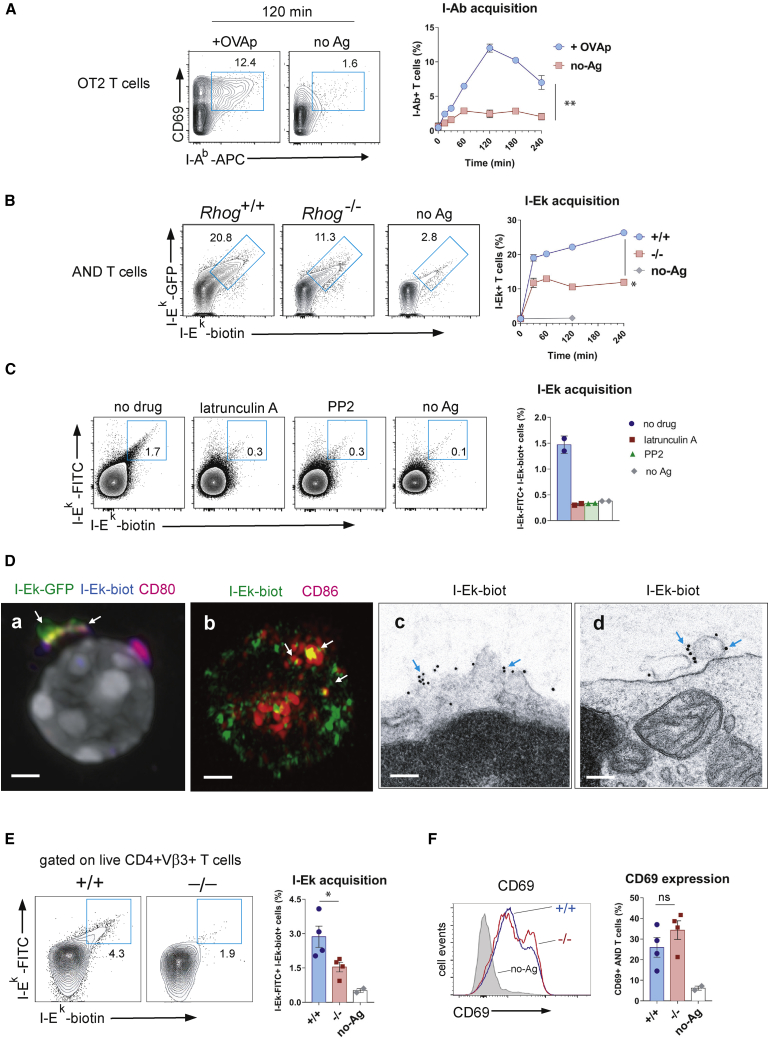
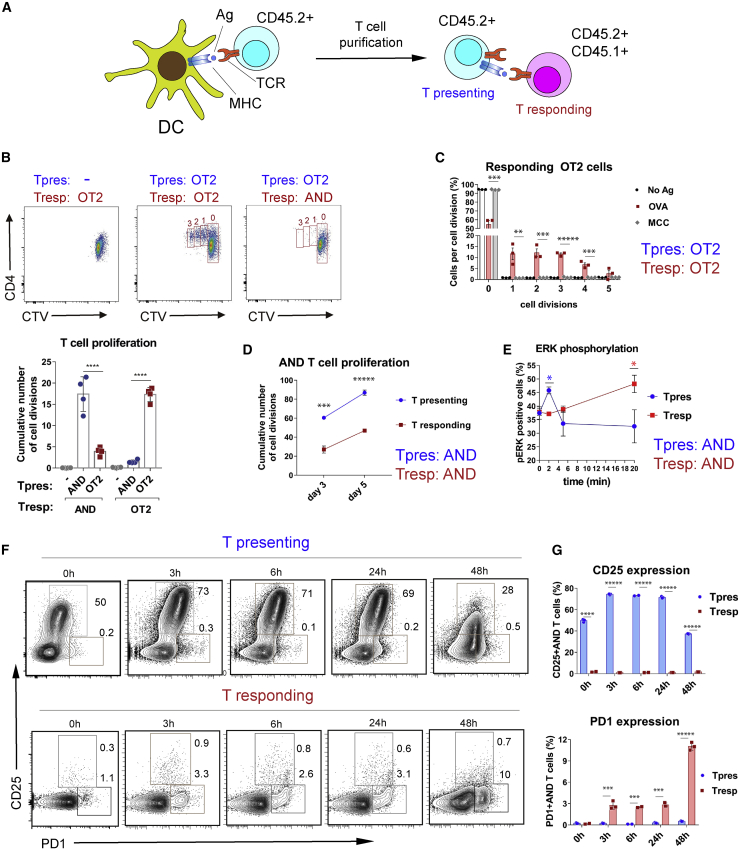
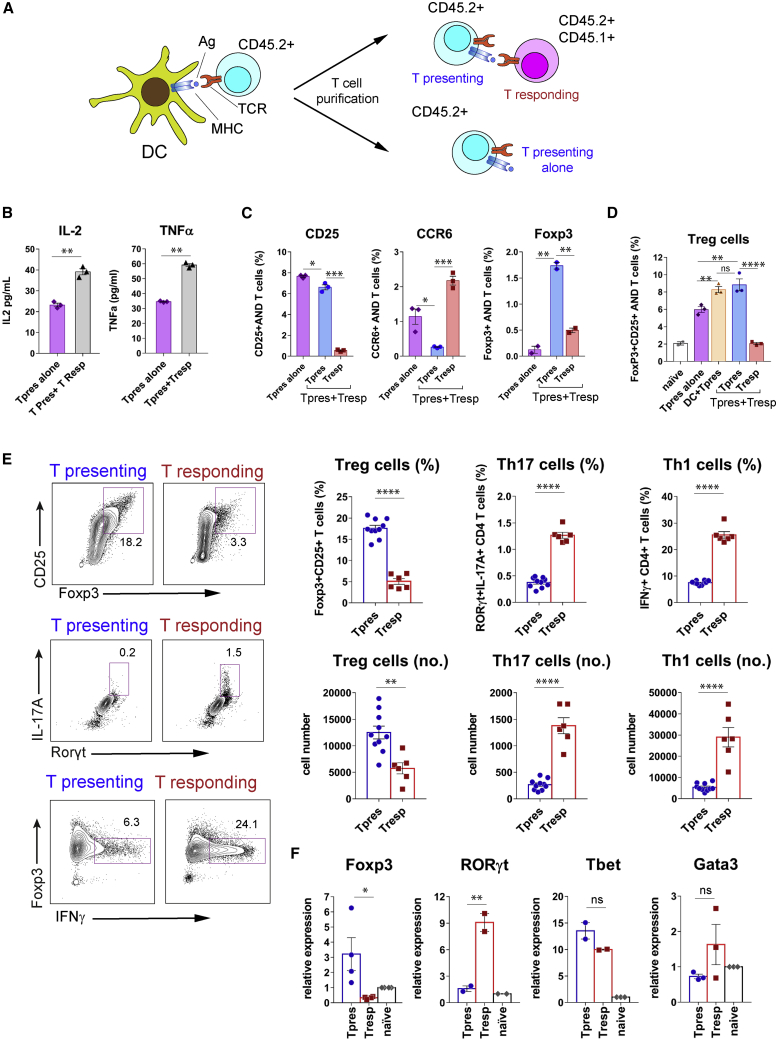
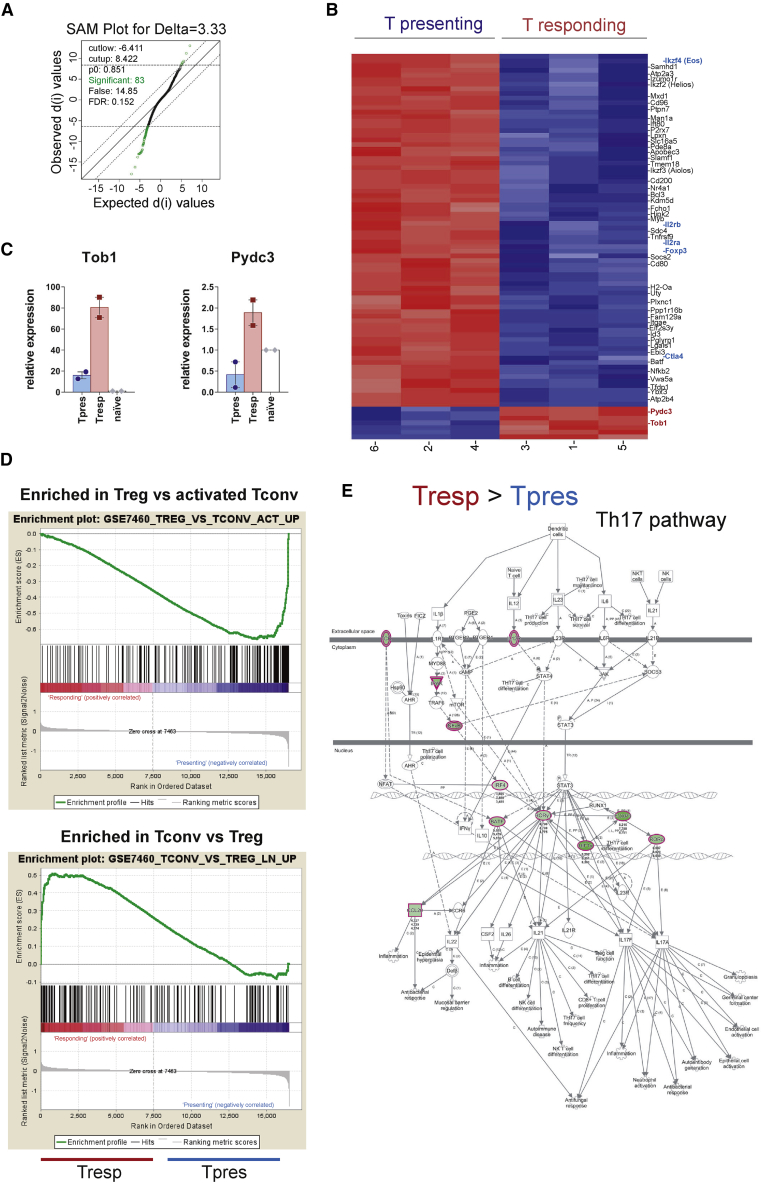
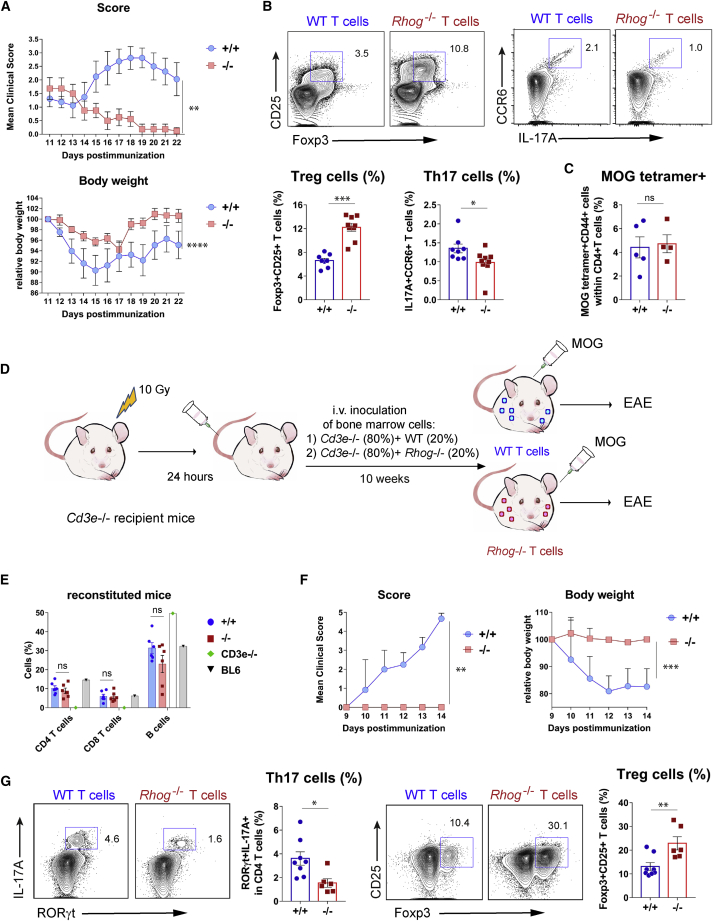
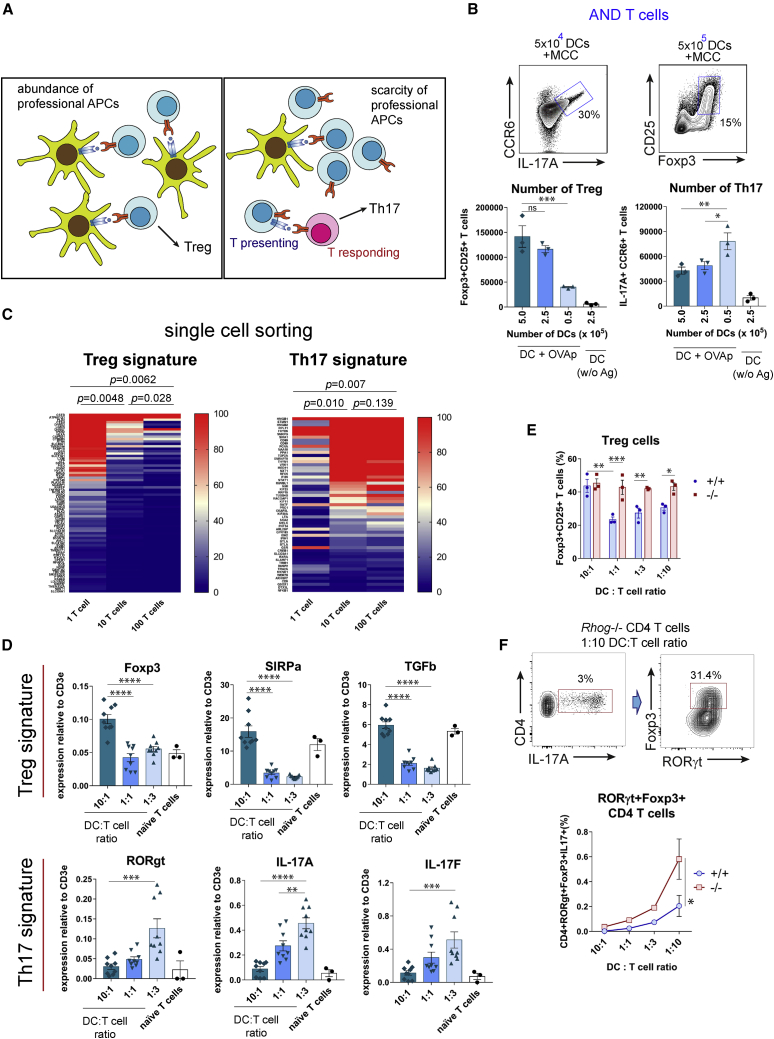
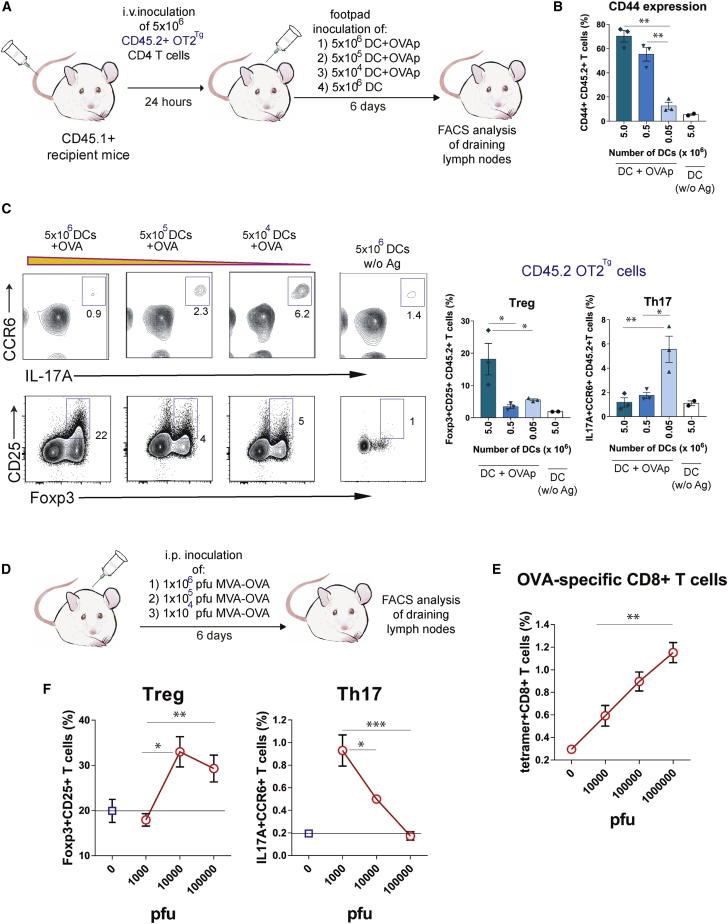
T cells form immunological synapses with professional antigen-presenting cells (APCs) resulting in T cell activation and the acquisition of peptide antigen-MHC (pMHC) complexes from the plasma membrane of the APC. They thus become APCs themselves. We investigate the functional outcome of T-T cell antigen presentation by CD4 T cells and find that the antigen-presenting T cells (Tpres) predominantly differentiate into regulatory T cells (Treg), whereas T cells that have been stimulated by Tpres cells predominantly differentiate into Th17 pro-inflammatory cells. Using mice deficient in pMHC uptake by T cells, we show that T-T antigen presentation is important for the development of experimental autoimmune encephalitis and Th17 cell differentiation in vivo. By varying the professional APC:T cell ratio, we can modulate Treg versus Th17 differentiation in vitro and in vivo, suggesting that T-T antigen presentation underlies proinflammatory responses in conditions of antigen scarcity.

Keywords: Th17; Treg; antigen presentation by T cells; limiting antigen; trogocytosis; vaccine dosing.


Conflict of interest statement

Declaration of interests The authors declare no competing interests.

Figures

None
Graphical abstract
Figure 1
Figure 1
Trogocytic CD4 T cells acquire and display cognate MHC-II complexes together with CD28 ligands on their own plasma membrane (A) Time-dependent expression of I-Ab by OT2 TCR transgenic T cells upon incubation with untreated BMDCs (no-Ag) or BMDCs loaded with antigenic OVA peptide (ovalbumin 323–339, OVAp). Two-color contour plots show the expression of I-Ab and CD69 on gated CD4 T cells from mice of the indicated genotype. Insets indicate the percentage of I-Ab+ CD69+ CD4 T cells. Quantification (means ± SEMs of triplicates) is shown in the graph to the right (∗∗p < 0.01, 2-tailed paired Student’s t test). (B) Time-dependent expression of I-Ek by AND CD4 T cells from b/b mice upon incubation with murine DCEK fibroblasts, transfected with the GFP-tagged I-Ekα subunit and loaded with antigenic MCC peptide (moth cytochrome c 88-103; MCCp). AND CD4 T cells become double positive for GFP and a biotinylated anti-I-Ek antibody added to intact cells (left). Quantification (means ± SEMs of triplicates) is shown in the graph to the right (p < 0.05, 2-tailed paired Student’s t test). (C) Expression of I-Ek on the surface of AND CD4 T cells from b/b mice after incubation for 1 h with MCCp-loaded BMDCs from k/b mice, in the presence of 20 μM of the actin polymerization inhibitor latrunculin A or 20 μM of the Src tyrosine kinase inhibitor PP2. Quantification (means ± SEMs of duplicates) is shown in the bar graph to the right. (D) Expression of acquired I-Ek and CD80 on the cell surface of AND CD4 T cells from b/b mice after 1 h of incubation with DCEK cells, transfected with the GFP-tagged I-Ekα subunit and loaded with MCCp. T cells were stained with biotin-labeled anti-I-Ek and Alexa 555-labeled anti-CD80 antibodies, as indicated, and analyzed by confocal microscopy (a midplane confocal section is shown in micrograph a, nucleus in gray). Micrograph b shows I-Ek and CD86 expression on the plasma membrane of AND T cells after incubation with MCCp-loaded BMDCs, analyzed by ELYRA super-resolution microscopy (a z axis projection of confocal sections). Analysis of I-Ek expression on AND T cells by electron microscopy (EM) after incubation with DCEK fibroblasts and purification of T cells and pre-embedding immunogold labeling with 10-nm streptavidin-gold particles (micrographs c and d). Blue arrows mark the presence of gold particles associated with the plasma membrane or with surface-bound microvesicles (micrographs c and d). Representative micrographs of 20–30 cells were taken for all techniques. (E) Flow cytometry analysis of the percentage of live anti-I-Ek-FITC+ anti-I-Ek-biotin+ Vβ3+ CD4 AND T cells in popliteal and inguinal lymph nodes 24 h after footpad immunization of AND WT and AND Rhog−/− mice in k/b background with 100 μg MCCp and 10 μg LPS or LPS only (no-Ag). Quantification (means ± SEMs of quadruplicates) is shown in the bar plot to the right (p < 0.05, 2-tailed unpaired Student’s t test). (F) CD69 expression on Vβ3+ CD4 AND T cells isolated as in (E). Quantification (means ± SEMs of quadruplicates) is shown in the bar plots to the right. Gray histogram is a control of mice injected with LPS only (no-Ag) (ns, not significant, p > 0.05, 2-tailed unpaired Student’s t test).
Figure 2
Figure 2
CD4 T cells that have trogocytosed and display MHC-II present antigen and stimulate other cognate naive T cells (A) Experimental setup. (B) Proliferation of naive OT2 and AND Tresp cells upon 3 days of co-culture with purified OT2 or AND Tpres cells previously exposed to BMDCs loaded with OVAp or MCCp, respectively. Fluorescence-activated cell sorting (FACS) plots show representative images of CTV-labeled OT2 and AND Tresp proliferation upon co-culture with or without OT2 Tpres cells. Bar graph shows quantification of AND and OT2 Tresp proliferation upon incubation with AND or OT2 Tpres cells (means ± SEMs of quadruplicates; ∗∗∗∗p < 0.0001 [2-tailed unpaired Student’s t test]). (C) Proliferation of OT2 Tresp upon 3 days of co-culture with purified OT2 Tpres cells, previously exposed to k/b BMDCs loaded with OVAp, MCCp, or no peptide (no-Ag). The number of cell divisions was calculated according to CTV dilution. The bar plot shows the means ± SEMs of triplicates.∗∗p < 0.01; ∗∗∗p < 0.001; ∗∗∗∗∗p < 0.00001 (2-tailed unpaired Student’s t test). (D) Cumulative number of cell divisions of CTV-labeled Tpres and Tresp AND T cells co-cultured for 3 and 5 days. The graph shows the means ± SEMs of quadruplicates. ∗∗∗p < 0.001; ∗∗∗∗∗p < 0.00001 (2-tailed unpaired Student’s t test). (E) Induction of ERK phosphorylation upon co-incubation of Tpres and Tresp AND T cells for the indicated time points. Line plots represent means ± SEMs (n = 3). p < 0.05 (2-tailed unpaired Student’s t test). (F) Two-color contour plots showing the expression of CD25 and PD1 activation markers by CD4 AND Tpres and Tresp cells after co-incubation for the indicated time periods. Tpres cells were previously incubated overnight with MCCp-loaded BMDCs. Time point 0 h shows marker expression before co-incubation. (G) Quantification of data shown in (F). Bar plots represent means ± SEMs (n = 3). ∗∗∗p < 0.001; ∗∗∗∗∗p < 0.00001 (2-tailed unpaired Student’s t test).
Figure 3
Figure 3
Tpres cells are enriched in Treg and Tresp cells in Th17 (A) Experimental setup. After purification by cell sorting, AND Tpres cells are incubated for 3–6 days in the absence or presence of naive AND Tresp cells. (B) ELISA measurement of IL-2 and TNF-α concentrations in supernatants of Tpres cells cultured for 3 days in the presence or absence of Tresp cells. The bar graphs show the means ± SEMs of triplicates.∗∗p < 0.01 (2-tailed unpaired Student’s t test). (C) Expression of CCR6, CD25, and Foxp3 by Tpres and Tresp cells from the experiment in (B), measured by flow cytometry. Bar graphs represent means ± SEMs (n = 3). p < 0.05; ∗∗p < 0.01; ∗∗∗p < 0.001 (2-tailed unpaired Student’s t test). (D) Generation of FoxP3+CD25+ T cells within AND Tpres and Tresp cell populations. After overnight incubation with MCCp-loaded BMDCs and purification, Tpres were cultured alone (Tpres alone) or together with naive AND Tresp cells (Tpres+Tresp) for 6 days and then analyzed by flow cytometry for Foxp3 and CD25 expression. In parallel, AND T cells were cultured uninterrupted for 6 days with MCC-loaded BMDCs (DC+Tpres). Data represent the means ± SEMs of biological triplicates. ∗∗p < 0.01; ∗∗∗∗p < 0.0001; ns, not significant (2-way ANOVA test). (E) Tpres and Tresp cells were stained with surface CD25 and intracellular IL-17A, Foxp3, RORγt, or IFNγ. Two-color contour plots are on the left and quantification in the bar plots to the right. ∗∗p < 0.01; ∗∗∗∗p < 0.0001 (2-tailed unpaired Student’s t test). (F) Quantification via qRT-PCR of mRNA expression of sorted Tpres, Tresp cells, and naive AND T cells. Data are presented as the means ± SEMs of n = 2–4 biological replicates normalized to the mean values of naive cells (set as 1). p < 0.05; ∗∗p < 0.01 (2-tailed unpaired Student’s t test).
Figure 4
Figure 4
Total gene expression analysis reveals signatures of Treg in Tpres and Th17 in Tresp cells (A) Significance analysis of microarray (SAM) plot diagram showing the comparison of transcriptomes from Tpres and Tresp FACS-sorted cells isolated at day 5 of co-culture. Transcripts differentially and not differentially expressed between the 2 cell types using a false discovery rate (FDR) of 0.152 are depicted as green and black circles, respectively. A total of 83 transcripts showed statistically significant variations between both cell types. (B) Heatmap representation of genes differentially transcribed in Tpres versus Tresp cells analyzed in biological triplicates. Red indicates the highest expression; dark blue the lowest. Genes with a functional implication in Treg are highlighted in bold blue type. Genes associated with Th17 function are highlighted in bold red type. (C) qRT-PCR analysis of Tob1 and Pydc3 gene expression in Tpres and Tresp cells after 5 days of co-culture. Bar plots show the means ± SEMs (n = 2 mice per group). Expression values are normalized to those of naive CD4 AND T cells (set as 1). (D) Gene set enrichment analysis (GSEA) from the Treg versus activated T conventional cell and from the T conventional versus Treg signatures from the Broad GSEA mSig database shows an enrichment for Treg in Tpres and for conventional T cells in Tresp. (E) The top score IPA Th17 pathway. Green-colored shapes are more highly expressed in Tresp than in Tpres. Different shapes represent the molecular classes of the proteins: kinases are shown as triangles, membrane receptors as double ellipses, transcriptional regulators as single ellipses, and cytokines and chemokines as squares. Direct and indirect interactions are indicated by solid and dashed lines, respectively.
Figure 5
Figure 5
Deficiency in T-T antigen presentation leads to reduced Th17/Treg ratios and resistance to EAE (A) Evolution of neurological symptoms (score) and body weight in MOG-immunized WT and Rhog−/− mice. Neurological scores were according to Borroto et al. (2016) Graphs represent the means ± SEMs (n = 8–9 mice per group; paired 2-tailed Student’s t test [weight] and non-parametric matched-pairs signed rank Wilcoxon 2-tailed test [score]). ∗∗p < 0.01; ∗∗∗∗p < 0.0001. (B) Two-color contour plots showing expression of Foxp3, CD25, IL-17A, and CCR6 in WT and Rhog−/− mice sacrificed at day 22 (A). Bar graphs show the percentages of Foxp3+CD25+ and IL17A+CCR6+ T cells (means ± SEMs; n = 8–9 mice per group; unpaired 2-tailed Student’s t test; p < 0.05; ∗∗∗p < 0.001). (C) WT and Rhog−/− mice were immunized with MOG, and the draining popliteal lymph nodes were collected 7 days later. The presence of MOG-reactive T cells was analyzed by flow cytometry on the CD4+CD44+ activated population by incubation with I-Ab OVA329-337 tetramer. Bar plot shows the means ± SEMs (n = 4–5 mice per group; unpaired 2-tailed Student’s t test. ns, not significant). (D) Experimental setup of the bone-marrow adoptive transfer experiment. (E) BM reconstitution was tested in the blood of chimeric mice before immunization with MOG. Bar plots show the percentage (means ± SEMs) of CD4 T, CD8 T, and B cells within the white blood cell population in bone marrow chimeras and, as reference, in Cd3e−/− and WT C57BL/6 mice. (F) Score and body weight evolution in BM chimeras reconstituted with either WT or Rhog−/− T cells. Graphs represent the means ± SEMs (n = 6–8 mice per group; 2-tailed Student’s t test [weight] and non-parametric matched-pairs signed rank Wilcoxon 2-tailed test [score]; ∗∗p < 0.01; ∗∗∗p < 0.001). (G) Two-color contour plots showing the expression and the percentages of Foxp3 and CD25 Treg markers and of the IL-17A and RORγt Th17 markers in WT and Rhog−/− BM chimeras sacrificed at day 14 (F). Bar plots show the means ± SEMs (n = 6–8 mice per group; unpaired 2-tailed Student’s t test; p < 0.05; ∗∗p < 0.01).
Figure 6
Figure 6
The DC:T cell ratio determines Treg versus Th17 differentiation in vitro (A) Graphical representation of working hypothesis on the effect of professional APC:T cell ratio on CD4 differentiation. (B) Generation of Treg and Th17 cells upon 6-day co-culture of 2.5 × 106 AND T cells with varying numbers of MCCp-loaded BMDCs. Treg versus Th17 differentiation was determined according to the expression of CD25, Foxp3, IL-17A, and CCR6 markers. Two-color contour plots show Th17 and Treg differentiation under the optimal DC doses. Bar graphs show the total number of cells with the Treg and Th17 phenotype (means ± SEMs of triplicate datasets; p < 0.05; ∗∗p < 0.01; ∗∗∗p < 0.001; 2-tailed unpaired Student’s t test). (C) Heatmap representation of genes differentially transcribed in conditions of 1, 10, or 100 AND T cells per well. Plotted genes correspond to those that have been associated with either Treg or Th17 signatures after GSEA analysis (Figure S9). Color-coded relative number of reads per gene is indicated in the scale bars to the right. Statistical analysis of expression differences was carried out by a 2-tailed paired Student’s t test. p values are considered significant if <0.05. (D) qRT-PCR analysis of genes associated with a Treg signature (Foxp3, SIRPα, and TGF-β) or a Th17 signature (RORγt, IL-17A, and IL-17F) after mRNA extraction from AND T cell and MMCp-loaded BMDC co-cultures at indicated DC:T cell ratios. Bar plots show the means ± SEMs of n = 3–9 biological replicas. mRNA expression was normalized to the expression of the T cell-restricted CD3ε gene. ∗∗p < 0.01; ∗∗∗p < 0.001; ∗∗∗∗p < 0.0001 (1-way ANOVA test). (E) Differentiation of AND T cells from WT and Rhog−/− mice according to the DC:T cell ratio after 6 days of co-culture. Bar plots show the mean ± SEM of n = 3–9 biological replicas. mRNA expression is shown relative to that of CD3ε used to normalize for T cell number. p < 0.05; ∗∗p < 0.01; ∗∗∗p < 0.001 (2-tailed unpaired Student’s t test). (F) Co-expression of RORγt and Foxp3 in Rhog−/− AND T cells co-cultured for 6 days with MCCp-loaded BMDCs at a 1:10 DC:T cell ratio. The graph shows the percentage of AND WT and Rhog−/− CD4+IL-17A+ cells that co-express RORγt and Foxp3 upon co-culture at different DC:T cell ratios. Data are shown as means ± SEMs of triplicate cultures. p < 0.05 (2-tailed paired Student’s t test).
Figure 7
Figure 7
Abundance of DCs and antigen determines Treg versus Th17 response in vivo (A) Experimental setup of the immunization protocol with different numbers of DCs. (B) OT2 CD4 response to antigen was evaluated by measuring the expression of the CD44 activation marker as a function of the dose of OVAp-loaded DCs. Bar graphs show the means ± SEMs (n = 3 mice per condition; unpaired 2-tailed Student’s t test; ∗∗p < 0.01). (C) Two-color contour plots showing percentages of Foxp3+CD25+ Treg cells and IL-17A+CCR6+ Th17 cells within the CD45.2+CD4+ OT2 cell population in the function of the dose of DC APCs. Bar plots show the means ± SEMs (n = 3 mice per condition; unpaired 2-tailed Student’s t test; p < 0.05; ∗∗∗p < 0.001). (D) Experimental setup of intraperitoneal (i.p.) infection with increasing number of plaque-forming units (PFUs) of MVA-OVA. (E) CD8 T cell response to the virus was evaluated by measuring the percentage of I-Ab-OVAp tetramer+ cells within the CD8+ T cell population. Graph shows the means ± SEMs (n = 2–4 mice per condition; unpaired 2-tailed Student’s t test; ∗∗p < 0.01). (F) Quantification of the percentage of Foxp3+CD25+ Treg and IL-17A+CCR6+ Th17 within the splenic endogenous CD4 T cell population. Graphs show the means ± SEMs (n = 2–4 mice per condition; unpaired 2-tailed Student’s t test; p < 0.05; ∗∗p < 0.01; ∗∗∗p < 0.001).

References

    1. Arnold P.Y., Mannie M.D. Vesicles bearing MHC class II molecules mediate transfer of antigen from antigen-presenting cells to CD4+ T cells. Eur. J. Immunol. 1999;29:1363–1373. - PubMed
    1. Baranzini S.E. The role of antiproliferative gene Tob1 in the immune system. Clin. Exp. Neuroimmunol. 2014;5:132–136. - PMC - PubMed
    1. Barnden M.J., Allison J., Heath W.R., Carbone F.R. Defective TCR expression in transgenic mice constructed using cDNA-based α- and β-chain genes under the control of heterologous regulatory elements. Immunol. Cell Biol. 1998;76:34–40. - PubMed
    1. Billeskov R., Wang Y., Solaymani-Mohammadi S., Frey B., Kulkarni S., Andersen P., Agger E.M., Sui Y., Berzofsky J.A. Low Antigen Dose in Adjuvant-Based Vaccination Selectively Induces CD4 T Cells with Enhanced Functional Avidity and Protective Efficacy. J. Immunol. 2017;198:3494–3506. - PMC - PubMed
    1. Borroto A., Reyes-Garau D., Jiménez M.A., Carrasco E., Moreno B., Martínez-Pasamar S., Cortés J.R., Perona A., Abia D., Blanco S. First-in-class inhibitor of the T cell receptor for the treatment of autoimmune diseases. Sci. Transl. Med. 2016;8:370ra184. - PubMed

Publication types

MeSH terms