

The Bdkrb2 gene family provides a novel view of viviparity adaptation in Sebastes schlegelii
- PMID: 33731008
- PMCID: PMC7968187
- DOI: 10.1186/s12862-021-01774-0
The Bdkrb2 gene family provides a novel view of viviparity adaptation in Sebastes schlegelii
Abstract
Background: Black rockfish (Sebastes schlegelii) is a viviparous teleost. We proposed that the rockfish ovarian wall had a similar function to the uterus of mammals previously. In the present study, the well-developed vascular system was observed in the ovarian wall and the exterior surface of the egg membrane. In gestation, adaptation of the ovary vasculature to the rising needs of the embryos occurs through both vasodilation and neovascularization. Bdkrb2, encoding a receptor for bradykinin, plays a critical role in the control of vasodilatation by regulating nitric oxide production.
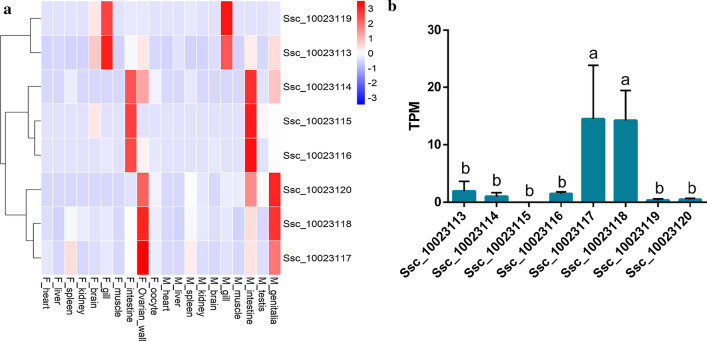
Results: Eight Bdkrb2 genes were identified in the black rockfish genome. These genes were located on chromosome 14, which are arranged in a tandem array, forming a gene cluster spanning 50 kb. Protein structure prediction, phylogenetic analysis, and transcriptome analysis showed that eight Bdkrb2 genes evolved two kinds of protein structure and three types of tissue expression pattern. Overexpression of two Bdkrb2 genes in zebrafish indicated a role of them in blood vessel formation or remodeling, which is an important procedure for the viviparous rockfish getting prepared for fertilization and embryos implantation.
Conclusions: Our study characterizes eight Bdrkb2 genes in the black rockfish, which may contribute to preparation for fertilization and embryo implantation. This research provides a novel view of viviparity adaptation and lays the groundwork for future research into vascular regulation of ovarian tissue in the breeding cycle in black rockfish.
Keywords: Adaptation; Bdkrb2; Ovarian wall; Vasodilatation; Viviparity.
Conflict of interest statement
The authors declare that they have no competing interests.
Figures


Similar articles
-
A chromosome-level genome of black rockfish, Sebastes schlegelii, provides insights into the evolution of live birth.Mol Ecol Resour. 2019 Sep;19(5):1309-1321. doi: 10.1111/1755-0998.13034. Epub 2019 Jul 9. Mol Ecol Resour. 2019. PMID: 31077549
-
Molecular characterization and expression patterns of glucocorticoid receptors in the viviparous black rockfish Sebastes schlegelii.Gen Comp Endocrinol. 2022 Jan 15;316:113947. doi: 10.1016/j.ygcen.2021.113947. Epub 2021 Nov 27. Gen Comp Endocrinol. 2022. PMID: 34848189
-
Transcriptome sequencing reveals ovarian immune response and development during female sperm storage in viviparous black rockfish (Sebastes schlegelii).Comp Biochem Physiol Part D Genomics Proteomics. 2023 Mar;45:101050. doi: 10.1016/j.cbd.2022.101050. Epub 2022 Dec 7. Comp Biochem Physiol Part D Genomics Proteomics. 2023. PMID: 36525779
-
Sequencing of the black rockfish chromosomal genome provides insight into sperm storage in the female ovary.DNA Res. 2019 Dec 1;26(6):453-464. doi: 10.1093/dnares/dsz023. DNA Res. 2019. PMID: 31711192 Free PMC article.
-
Omics insights into spermatozoa activation induced by Fetal bovine serum in viviparous black rockfish (Sebastes schlegelii).Gene. 2023 Jan 30;851:147014. doi: 10.1016/j.gene.2022.147014. Epub 2022 Oct 29. Gene. 2023. PMID: 36341728
Cited by
-
Convergent genomic signatures associated with vertebrate viviparity.BMC Biol. 2024 Feb 8;22(1):34. doi: 10.1186/s12915-024-01837-w. BMC Biol. 2024. PMID: 38331819 Free PMC article.
References
-
- Hisanari Mori MN, Soyano K, Koya Y. Annual reproductive cycle of black rockfish Sebastes schlegeli in captivity. Fish Sci. 2003;69(5):910–923. doi: 10.1046/j.1444-2906.2003.00707.x. - DOI
-
- Kusakari M. Mariculture of Kurosoi, Sebastes-Schlegeli. Environ Biol Fish. 1991;30(1–2):245–251. doi: 10.1007/BF02296892. - DOI
-
- Omoto N, Koya Y, Chin B, Yamashita Y, Nakagawa M, Noda T. Gonadal sex differentiation and effect of rearing temperature on sex ratio in black rockfish (Sebastes schlegeli) Ichthyol Res. 2010;57(2):133–138. doi: 10.1007/s10228-009-0137-7. - DOI
-
- Yan He YC, Lisui B, Mengjun Y, Rui L, Jingjing N, Guangyi F, Weihao S, Inge S, Yating Q, Xuemei L, Jinxiang L, Xiangfu K, Meiting P, Minmin S, Mengya W, Jiangbo Q, Xuangang W, Xiaobing L, Xiaolong W, Xi Z, Xuliang W, Yaolei Z, Jiao G, Yang L, Kaiqiang L, Yilin W, He Z, Longqi L, Mingyue W, Haiyang Y, Xubo W, Jie C, Zhigang W, Xun X, Jian W, Huanming Y, Simon MYL, Xin L, Quanqi Z, Jie Q. A chromosome-level genome of black rockfish, Sebastes schlegelii, provides insights into the evolution of live birth. Mol Ecol Resour. 2019;19(5):1309–1321. doi: 10.1111/1755-0998.13034. - DOI - PubMed
-
- George W, Boehlert MK, Motohiro S, Juro Y. Energetics during embryonic development in kurosoi, Sebastes schlegeli Hilgendorf. J Exp Mar Biol Ecol. 1986;101(3):239–256. doi: 10.1016/0022-0981(86)90266-2. - DOI
Publication types
MeSH terms
LinkOut - more resources
Full Text Sources
Other Literature Sources
Molecular Biology Databases