. 2021 Mar 17;40(1):103.
doi: 10.1186/s13046-021-01896-9.

CircFAM73A promotes the cancer stem cell-like properties of gastric cancer through the miR-490-3p/HMGA2 positive feedback loop and HNRNPK-mediated β-catenin stabilization

Affiliations

CircFAM73A promotes the cancer stem cell-like properties of gastric cancer through the miR-490-3p/HMGA2 positive feedback loop and HNRNPK-mediated β-catenin stabilization

Yiwen Xia et al. J Exp Clin Cancer Res. .

Abstract

Background: Circular RNAs (circRNAs) have emerged as a new subclass of regulatory RNAs that play critical roles in various cancers. Cancer stem cells (CSCs), a small subset of cancer cells, are believed to possess the capacities to initiate tumorigenesis and promote progression. Although accumulating evidence has suggested that cells with CSC-like properties are crucial for the malignancy of gastric cancer (GC), it remains unclear whether circRNAs are related to the acquisition of CSC-like properties in GC.

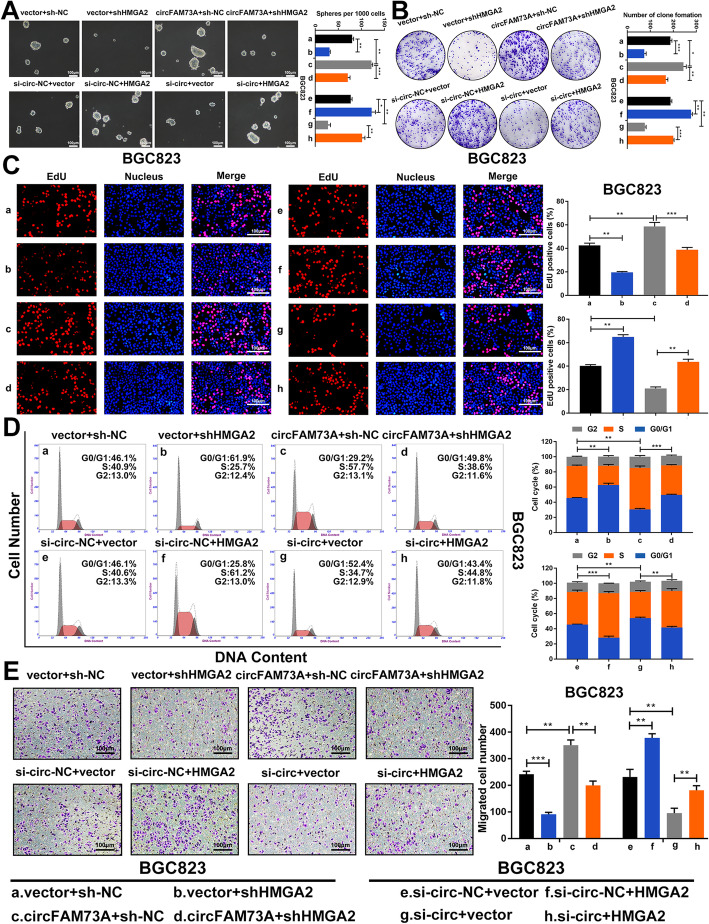
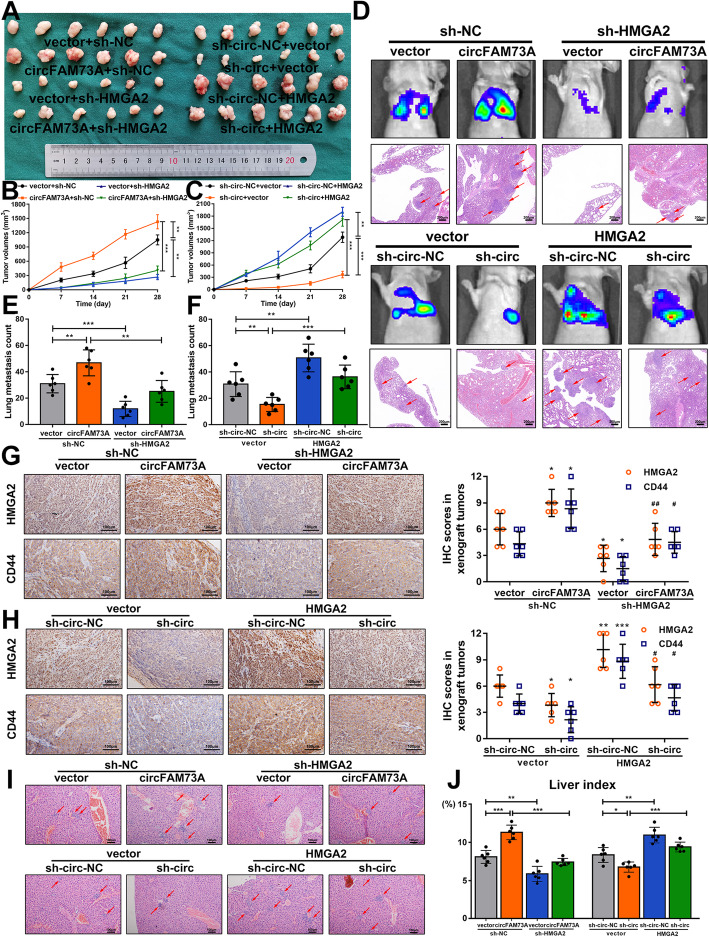
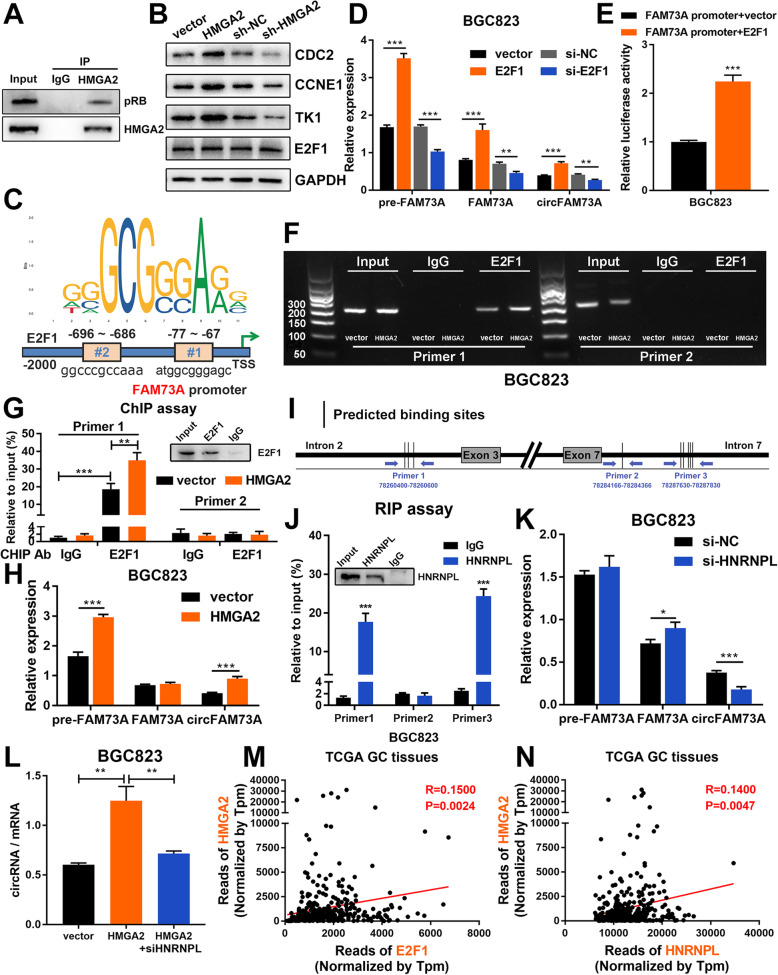
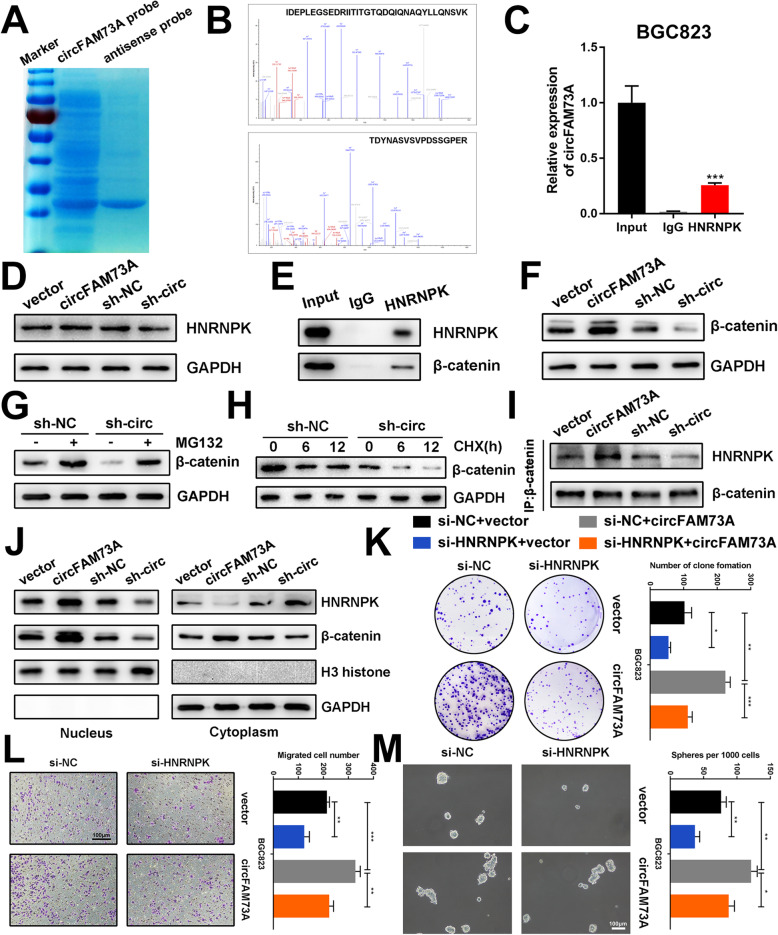
Methods: CircFAM73A expression was analyzed by GEO datasets and verified in GC samples. The roles of circFAM73A in GC cell proliferation, migration, cisplatin resistance, and CSC-like properties were determined by a series of functional experiments both in vitro and in vivo. RNA pulldown was used to explore the miRNAs and proteins binding to circFAM73A. Bioinformatic analysis and experimental verification confirmed the downstream targets of circFAM73A. The regulation of circFAM73A by HMGA2 was verified by ChIP and RIP assays.

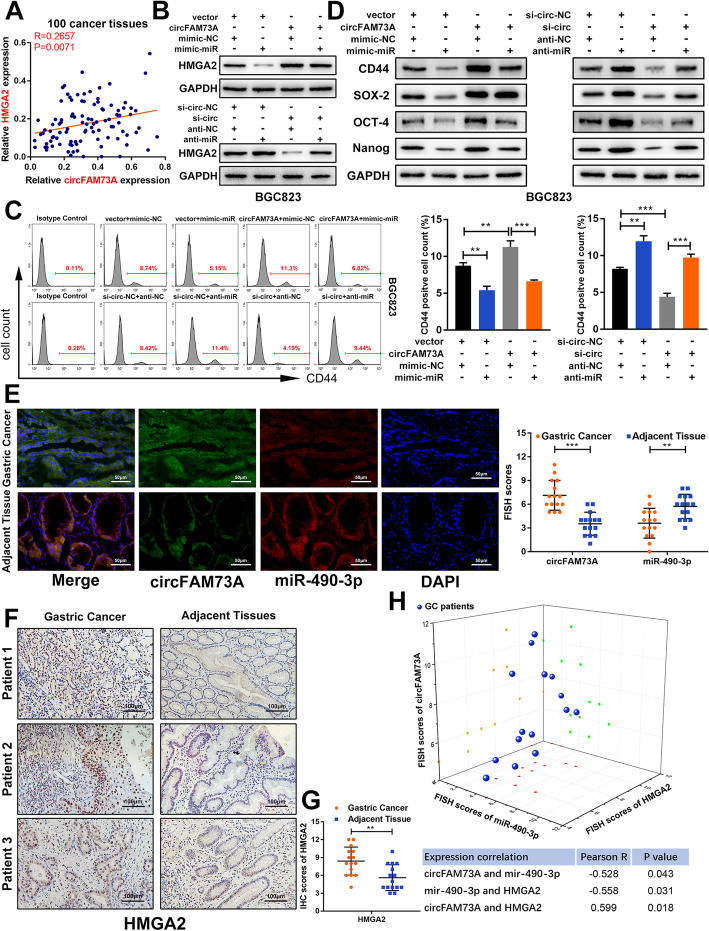
Results: Elevated circFAM73A expression was confirmed in GC tissues, and higher circFAM73A predicted poor prognosis in GC patients. The upregulation of circFAM73A enhanced CSC-like properties in GC, thus facilitating cell proliferation, migration, and cisplatin resistance. Mechanistically, circFAM73A promoted GC malignancy by regulating miR-490-3p/HMGA2 in a positive feedback loop and recruiting HNRNPK to facilitate β-catenin stabilization. Moreover, HMGA2 further enhanced E2F1 and HNRNPL activity, which in turn promoted circFAM73A expression.

Conclusions: Our work demonstrates the crucial role of circFAM73A in the CSC-like properties of GC and uncovers a positive feedback loop in circFAM73A regulation that leads to the progression of gastric cancer, which may provide new insights into circRNA-based diagnostic and therapeutic strategies.


Conflict of interest statement

The authors declare that they have no competing interests.

Figures

Fig. 1
Fig. 1
CircFAM73A is upregulated in GC and high circFAM73A predicts poor prognosis. a Validated the expression of hsa_circ_0001789, hsa_circ_0007376, hsa_circ_0052001 and hsa_circ_0002570 in the 60 paired GC and adjacent tissues by qRT-PCR. b Schematic drawing illustrating circFAM73A (hsa_circ_0002570) (700 bp) arose from exon 3,4,5,6,7 of the FAM73A gene. c Arrow represents the “head-to-tail” splicing sites of circFAM73A confirmed by Sanger sequencing. d Relative circFAM73A expression in 6 GC cell lines relative to normal human gastric epithelial cell line GES-1. e qRT-PCR analysis of the level of circFAM73A and linear FAM73A mRNA after treatment with RNase R in BGC823 and SGC7901 (normalized to mock treatment). f The existence of circFAM73A was validated in BGC823 and SGC7901 and two GC samples (T1 and T2) by RT-PCR. Divergent primers amplified circFAM73A from cDNA, but not from genomic DNA (gDNA). GAPDH was used as a negative control. g Relative levels of circFAM73A and FAM73A mRNA were measured by qRT-PCR in BGC823 treated with Actinomycin D for different periods of time. h Relative levels of GAPDH (positive control for cytoplasmic fraction), U6 (positive control for nuclear fraction), circFAM73A, and FAM73A mRNA from nuclear and cytoplasmic fractions in BGC823. i Fluorescence in situ hybridization (FISH) was conducted to determine the subcellular localization of circFAM73A in BGC823. DAPI was used for nuclei staining. Scale bar: 20 μm. j Relative circFAM73A expression in additional 100 paired GC and adjacent tissues. k Overall survival analysis based on circFAM73A expression in 100 GC patients. The median circFAM73A expression is used as a cutoff. l The association of circFAM73A expression and TMN stage through qRT-PCR. m The association of circFAM73A expression and tumor size through qRT-PCR. Graph represents mean ± SD; *p < 0.05, **p < 0.01, and ***p < 0.001
Fig. 2
Fig. 2
CircFAM73A promotes the proliferation and migration of GC in vitro. a Colony formation assay of BGC823 and SGC7901 transfected with control, circFAM73A siRNA, vector or circFAM73A plasmid. b, c CCK-8 and EdU assays were performed to evaluate cell proliferative effects of circFAM73A in BGC823 and SGC7901. Scale bar: 100 μm. d Effects of circFAM73A alteration on the growth of gastric organoids. Scale bar: 25 μm. e Effects of circFAM73A alteration on cell cycle distribution of BGC823 and SGC7901 detected by flow cytometry. f Effects of circFAM73A alteration on cell migration ability were tested by Transwell assay. Scale bar: 100 μm. Graph represents mean ± SD; *p < 0.05, **p < 0.01, ***p < 0.001
Fig. 3
Fig. 3
CircFAM73A enhances the stem cell-like property in GC cells. a Representative images of formatted spheres among indicated cells. Scale bar: 100 μm. b Sphere formation abilities were accessed by the number of spheres. c Effects of circFAM73A alteration on capacity of sphere formation were measured by extreme limiting dilution assay. d Representative flow cytometric histograms and quantification of the CD44 positive proportion among indicated cells. e Several stemness-related factors including CD44, SOX-2, OCT-4 and Nanog were measured by qRT-PCR. Pseudocolors represent the intensity scale of expression in circFAM73A vs. vector cells and si-circFAM73A vs. control cells calculated by log2 transformation. f Western blot of stemness-related factors including CD44, SOX-2, OCT-4, and Nanog among indicated cells. Graph represents mean ± SD; *p < 0.05, **p < 0.01, ***p < 0.001
Fig. 4
Fig. 4
CircFAM73A acts as a sponge of miR-490-3p, HMGA2 is the direct downstream target of miR-490-3p. a Venn diagram showing the overlap of target miRNAs of circFAM73A predicted by TargetScan and RNAhybrid and downregulated miRNAs in GC from TCGA. b The expression levels of 8 miRNAs candidate miRNAs were quantified by qRT-PCR after pull-down with biotin-labeled circFAM73A probe in BGC823 and SGC7901 cells. c Luciferase intensity in BGC823 and SGC7901 cells co-transfected with luciferase reporter containing with wild-type or mutated circFAM73A-miR-490-3p binding sequences and the mimics of miR-490-3p or control. d The expression levels of circFAM73A were tested by qRT-PCR after pull-down with biotin-labeled wild-type or mutant miR-490-3p in circFAM73A overexpressed BGC823 and SGC7901 cells. e Fluorescence in situ hybridization assay revealed the co-location between circFAM73A and miR-490-3p in cytoplasm. Scare bar = 20 μm. f Venn diagram detailing the exploration of miR-490-3p downstream targets. g The correlation between miR-490-3p and the 7 potential targets gene in TCGA database. h The mRNA expression of AURKA, ONECUT2, RNF207, and HMGA2 in 100 paired GC and adjacent tissues were determined by qRT-PCR. i Correlation between miR-490-3p and AURKA, ONECUT2, RNF207, and HMGA2 according to our GC samples. j The expression of AURKA, ONECUT2, RNF207, and HMGA2 after miR-490-3p alternation in BGC823 cells measured by qRT-PCR and Western Blot. k Overall survival analysis based on HMGA2 expression in 100 GC patients. The median HMGA2 expression is used as a cutoff. l Overall survival analysis based on HMGA2 expression in TCGA GC patients. The optimal cut-off was calculated by X-tile software. Graph represents mean ± SD; *p < 0.05, **p < 0.01, ***p < 0.001
Fig. 5
Fig. 5
CircFAM73A regulates HMGA2 expression by miR-490-3p. a Correlation between circFAM73A and HMGA2 according to our GC samples. b Western blot of HMGA2 was detected in BGC823 transfected with indicated vectors. c Representative flow cytometric histograms and quantification of the CD44 positive proportion in BGC823 transfected with indicated vectors. d Western blot of stemness-related factors including CD44, SOX-2, OCT-4, and Nanog in BGC823 transfected with indicated vectors. e FISH assay of circFAM73A and miR-490-3p in 15 paired GC and adjacent tissues from patients. FISH scores were further assessed. Nuclei were stained with DAPI. Scale bar: 50 μm. f IHC staining of HMGA2 in in 15 paired GC and adjacent tissues. Scale bar: 100 μm. g The IHC scores of HMGA2 were further quantified. h Three-dimensional scatter plot of circFAM73A, miR-490-3p and HMGA2 15 paired GC and adjacent tissues. Graph represents mean ± SD; *p < 0.05, **p < 0.01, ***p < 0.001
Fig. 6
Fig. 6
CircFAM73A promotes stem cell-like property and cell malignancy in GC cells by upregulating HMGA2 expression. a Representative images and quantification of formatted spheres among indicated cells. Scale bar: 100 μm. b Representative images and quantification of clone formation among indicated cells. c Representative images of EdU staining and quantification of EdU positive cells among indicated cells. Scale bar: 100 μm. d Representative images of cell cycle distribution among indicated cells detected by flow cytometry. e Representative images and quantification of migrated cells among indicated cells tested by Transwell assay. Scale bar: 100 μm. Graph represents mean ± SD; *p < 0.05, **p < 0.01, ***p < 0.001
Fig. 7
Fig. 7
CircFAM73A regulates HMGA2 expression level to promote GC growth and metastasis in vivo. a The images of xenograft tumors of sacrificed mice subcutaneous injected with indicated cells 4 weeks after injections. b, c Growth curves of xenograft tumors. Tumor volume was calculated by 1/2 (length × width2). d Representative images of bioluminescent images of mice by IVIS Imaging system and HE staining of lung tissues. Scale bar: 200 μm. e Quantification of metastatic foci in mice lungs injected with indicated cells. g, h Immunohistochemistry staining and IHC scores of HMGA2 and CD44 in respective xenograft tumor tissues. * vs the group of first column, # vs the group of second column. i Representative images of HE staining of liver tissues from mice with portal veins injection. Scale bar: 100 μm. j Liver indexes (liver weight/ body weight) of each group were calculated. Graph represents mean ± SD; *p < 0.05, **p < 0.01, ***p < 0.001, #p < 0.05, # #p < 0.01, # # #p < 0.001
Fig. 8
Fig. 8
HMGA2 elevates circFAM73A expression reciprocally by E2F1 and HNRNPL. a Co-immunoprecipitation was performed using control IgG or HMGA2 antibody. Immunoprecipitated proteins were detected by pRB and HMGA2 antibodies. b Western blot of E2F1 and classical E2F1 responsive effectors (CCNE1, TK1, and CDC2) in BGC823. c Putative binding sites of E2F1 in FAM73A promoter region predicted by JASPAR. d Relative expression of pre-FAM73A, FAM73A mRNA, and circFAM73A with E2F1 alteration were measured by qRT-PCR in BGC823. e Luciferase reporter assay analysis of FAM73A promoter luciferase reporters in BGC823 cells transfected with E2F1 or control. f RT-PCR was performed in BGC823 cells after chromatin immunoprecipitation by E2F1 antibody or control IgG and by two pairs of primers to validate the E2F1 binding sites in FAM73A promoter region. g qRT-PCR analysis of chromatin immunoprecipitation assay in E. h Relative expression of pre-FAM73A, FAM73A mRNA, and circFAM73A in BGC823 with HMGA2 reconstitution were measured by qRT-PCR. i Schematic diagram demonstrated three designed specific primers covering different binding site sequences in intron-2 and intron-7. j Relative enrichment of amplification sequence by three indicated primes after RNA binding protein immunoprecipitation assay by HNRNPL antibody or control IgG in BGC823. k Relative expression of pre-FAM73A, FAM73A mRNA, and circFAM73A in BGC823 with HNRNPL suppression were measured by qRT-PCR. l The ratio of circFAM73A expression to FAM73A mRNA expression in BGC823. m Correlation between E2F1 and HMGA2 according to TCGA statistics. n Correlation between HNRNPL and HMGA2 according to TCGA statistics. Graph represents mean ± SD; *p < 0.05, **p < 0.01, ***p < 0.001
Fig. 9
Fig. 9
CircFAM73A interacts with HNRNPK and facilitates β-catenin stabilization. a Coomassie blue staining of circFAM73A pulldown. b Spectra of HNRNPK identified by mass spectrometry. c Relative abundance of circFAM73A detected by qRT-PCR after RIP using HNRNPK antibody in BGC823. d Expression of HNRNPK protein of BGC823 after circFAM73A overexpression or knocking-down measured by Western Blot. e Co-IP analysis using HNRNPK protein revealing the endogenous interaction between HNRNPK and β-catenin in BGC823. f Expression of β-catenin protein in BGC823 after circFAM73A overexpression or knocking-down measured by Western Blot. g Expression of β-catenin protein in BGC823 transfected with control shRNA or sh-circFAM73A and treated with MG132 (10 μmol/L, 10 h) or untreated measured by Western Blot. h Expression of β-catenin protein in BGC823 transfected with control shRNA or sh-circFAM73A and treated with cycloheximide (CHX, 50 μg/mL) for different time measured by Western Blot. i Co-IP and Western blot showing the interaction between HNRNPK and β-catenin after circFAM73A overexpression or knocking-down in BGC823. j The nuclear and cytoplasmic expression of HNRNPK and β-catenin measured by Western Blot after circFAM73A overexpression or knocking-down in BGC823. k-m Representative images of and quantification of clone formation (k) migrated cells (l) and formatted spheres (m) in BGC823 transfected with vector or circFAM73A plasmid and co-transfected with control siRNA or si-HNRNPK. Graph represents mean ± SD; *p < 0.05, **p < 0.01, ***p < 0.001

Similar articles

Cited by

References

    1. Bray F, Ferlay J, Soerjomataram I, Siegel RL, Torre LA, Jemal A. Global cancer statistics 2018: GLOBOCAN estimates of incidence and mortality worldwide for 36 cancers in 185 countries. CA Cancer J Clin. 2018;68:394–424. doi: 10.3322/caac.21492. - DOI - PubMed
    1. Clarke MF, Dick JE, Dirks PB, Eaves CJ, Jamieson CH, Jones DL, Visvader J, Weissman IL, Wahl GM. Cancer stem cells--perspectives on current status and future directions: AACR workshop on cancer stem cells. Cancer Res. 2006;66:9339–9344. doi: 10.1158/0008-5472.CAN-06-3126. - DOI - PubMed
    1. Beck B, Blanpain C. Unravelling cancer stem cell potential. Nat Rev Cancer. 2013;13:727–738. doi: 10.1038/nrc3597. - DOI - PubMed
    1. Xu G, Shen J, Ou YX, Sasahara M, Su X. Cancer stem cells: the ‘heartbeat’ of gastric cancer. J Gastroenterol. 2013;48:781–797. doi: 10.1007/s00535-012-0712-y. - DOI - PubMed
    1. Takaishi S, Okumura T, Tu S, Wang SS, Shibata W, Vigneshwaran R, Gordon SA, Shimada Y, Wang TC. Identification of gastric cancer stem cells using the cell surface marker CD44. Stem Cells. 2009;27:1006–1020. doi: 10.1002/stem.30. - DOI - PMC - PubMed

MeSH terms