

Male Goal-Tracker and Sign-Tracker Rats Do Not Differ in Neuroendocrine or Behavioral Measures of Stress Reactivity
- PMID: 33731330
- PMCID: PMC8116112
- DOI: 10.1523/ENEURO.0384-20.2021
Male Goal-Tracker and Sign-Tracker Rats Do Not Differ in Neuroendocrine or Behavioral Measures of Stress Reactivity
Abstract
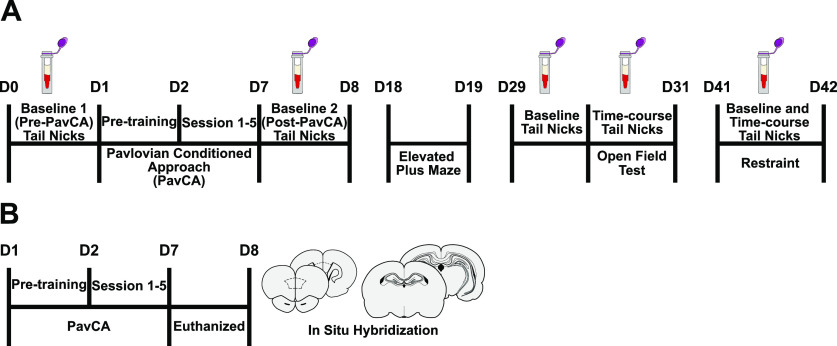
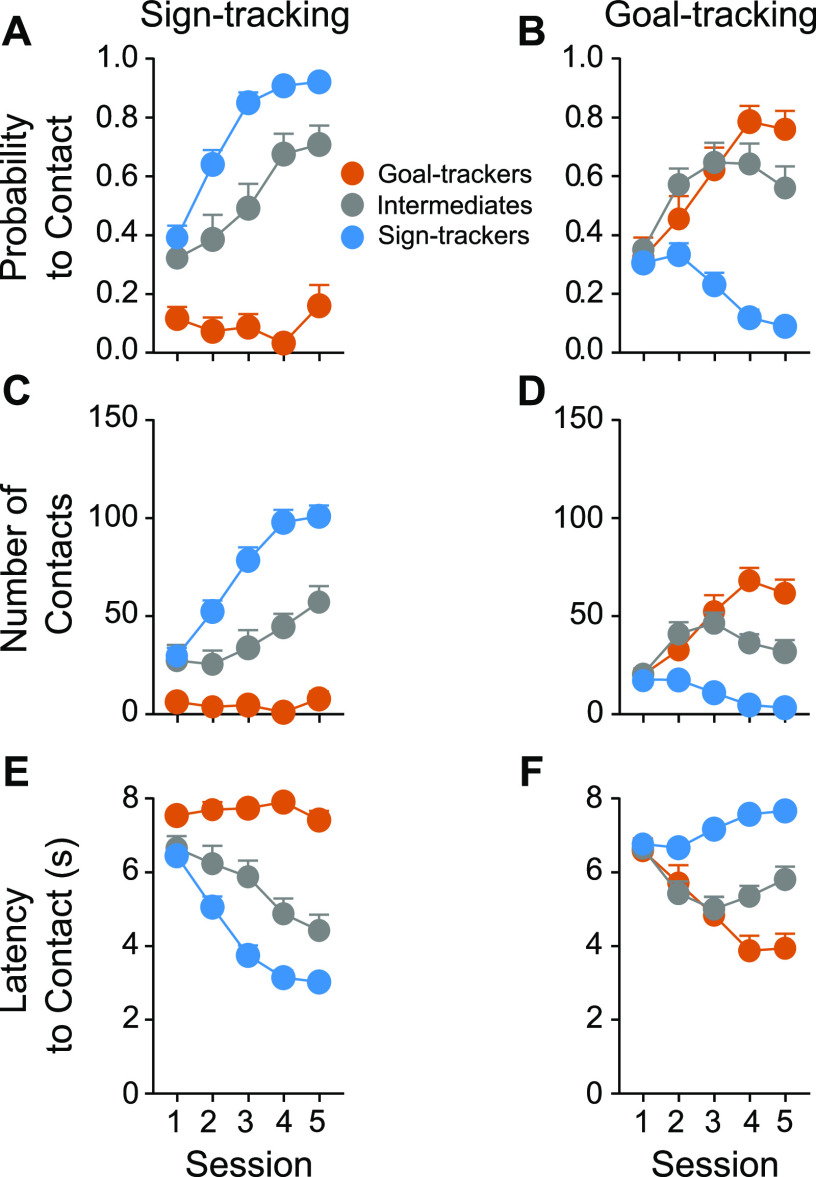
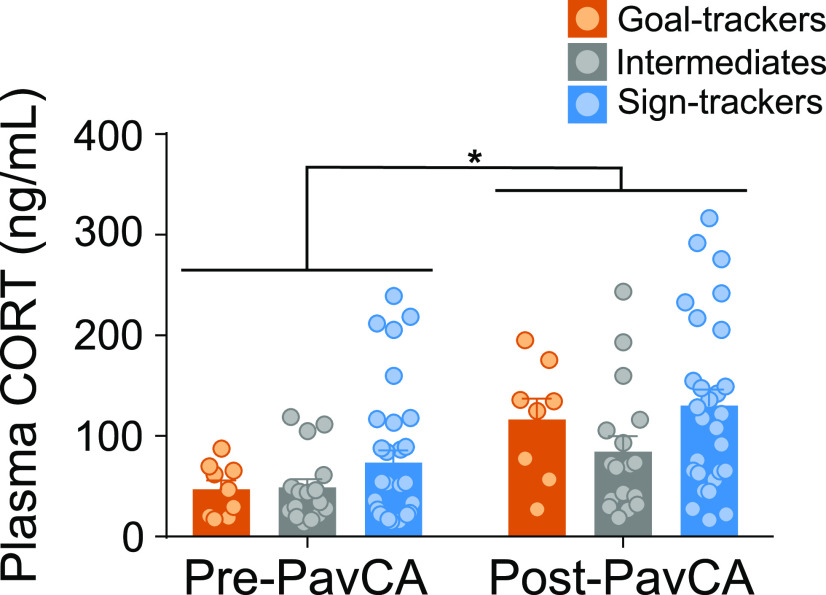
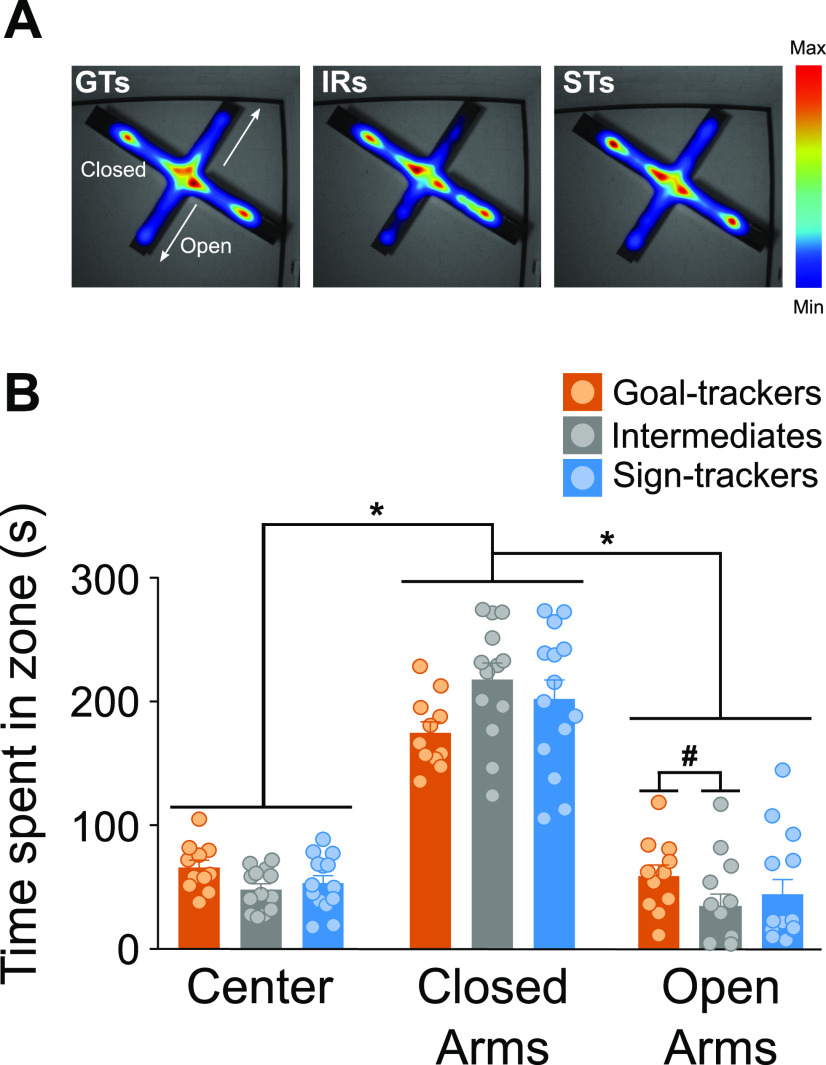
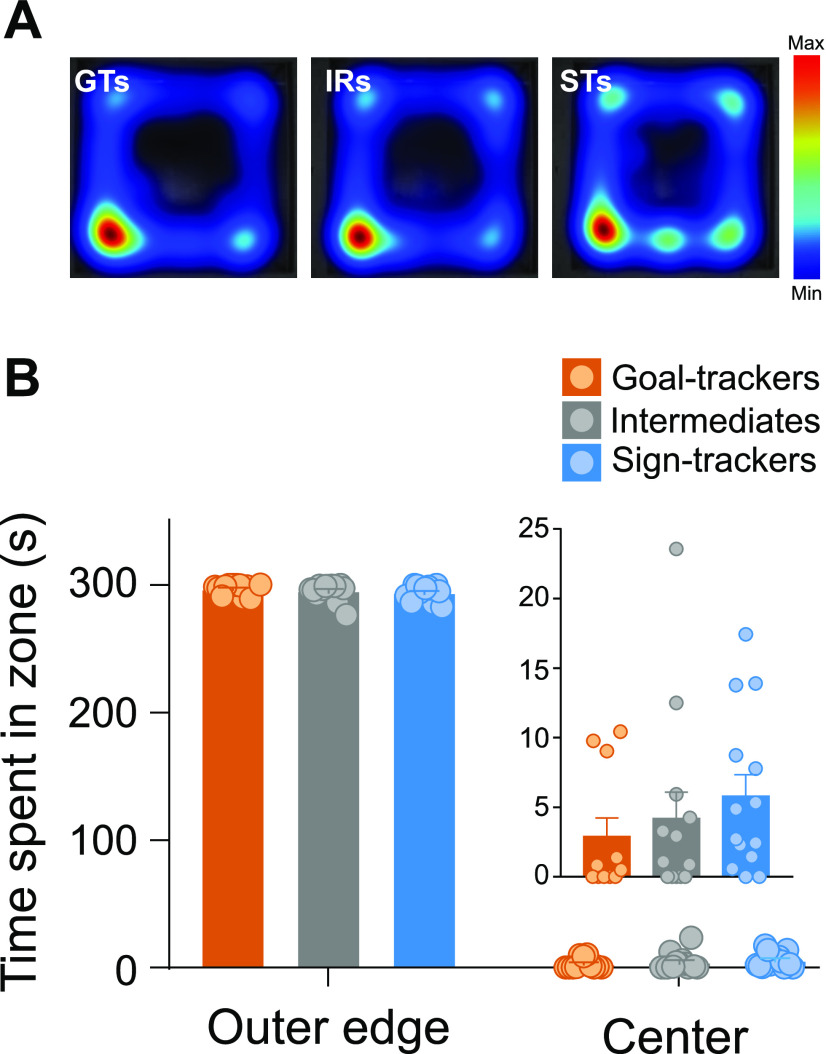
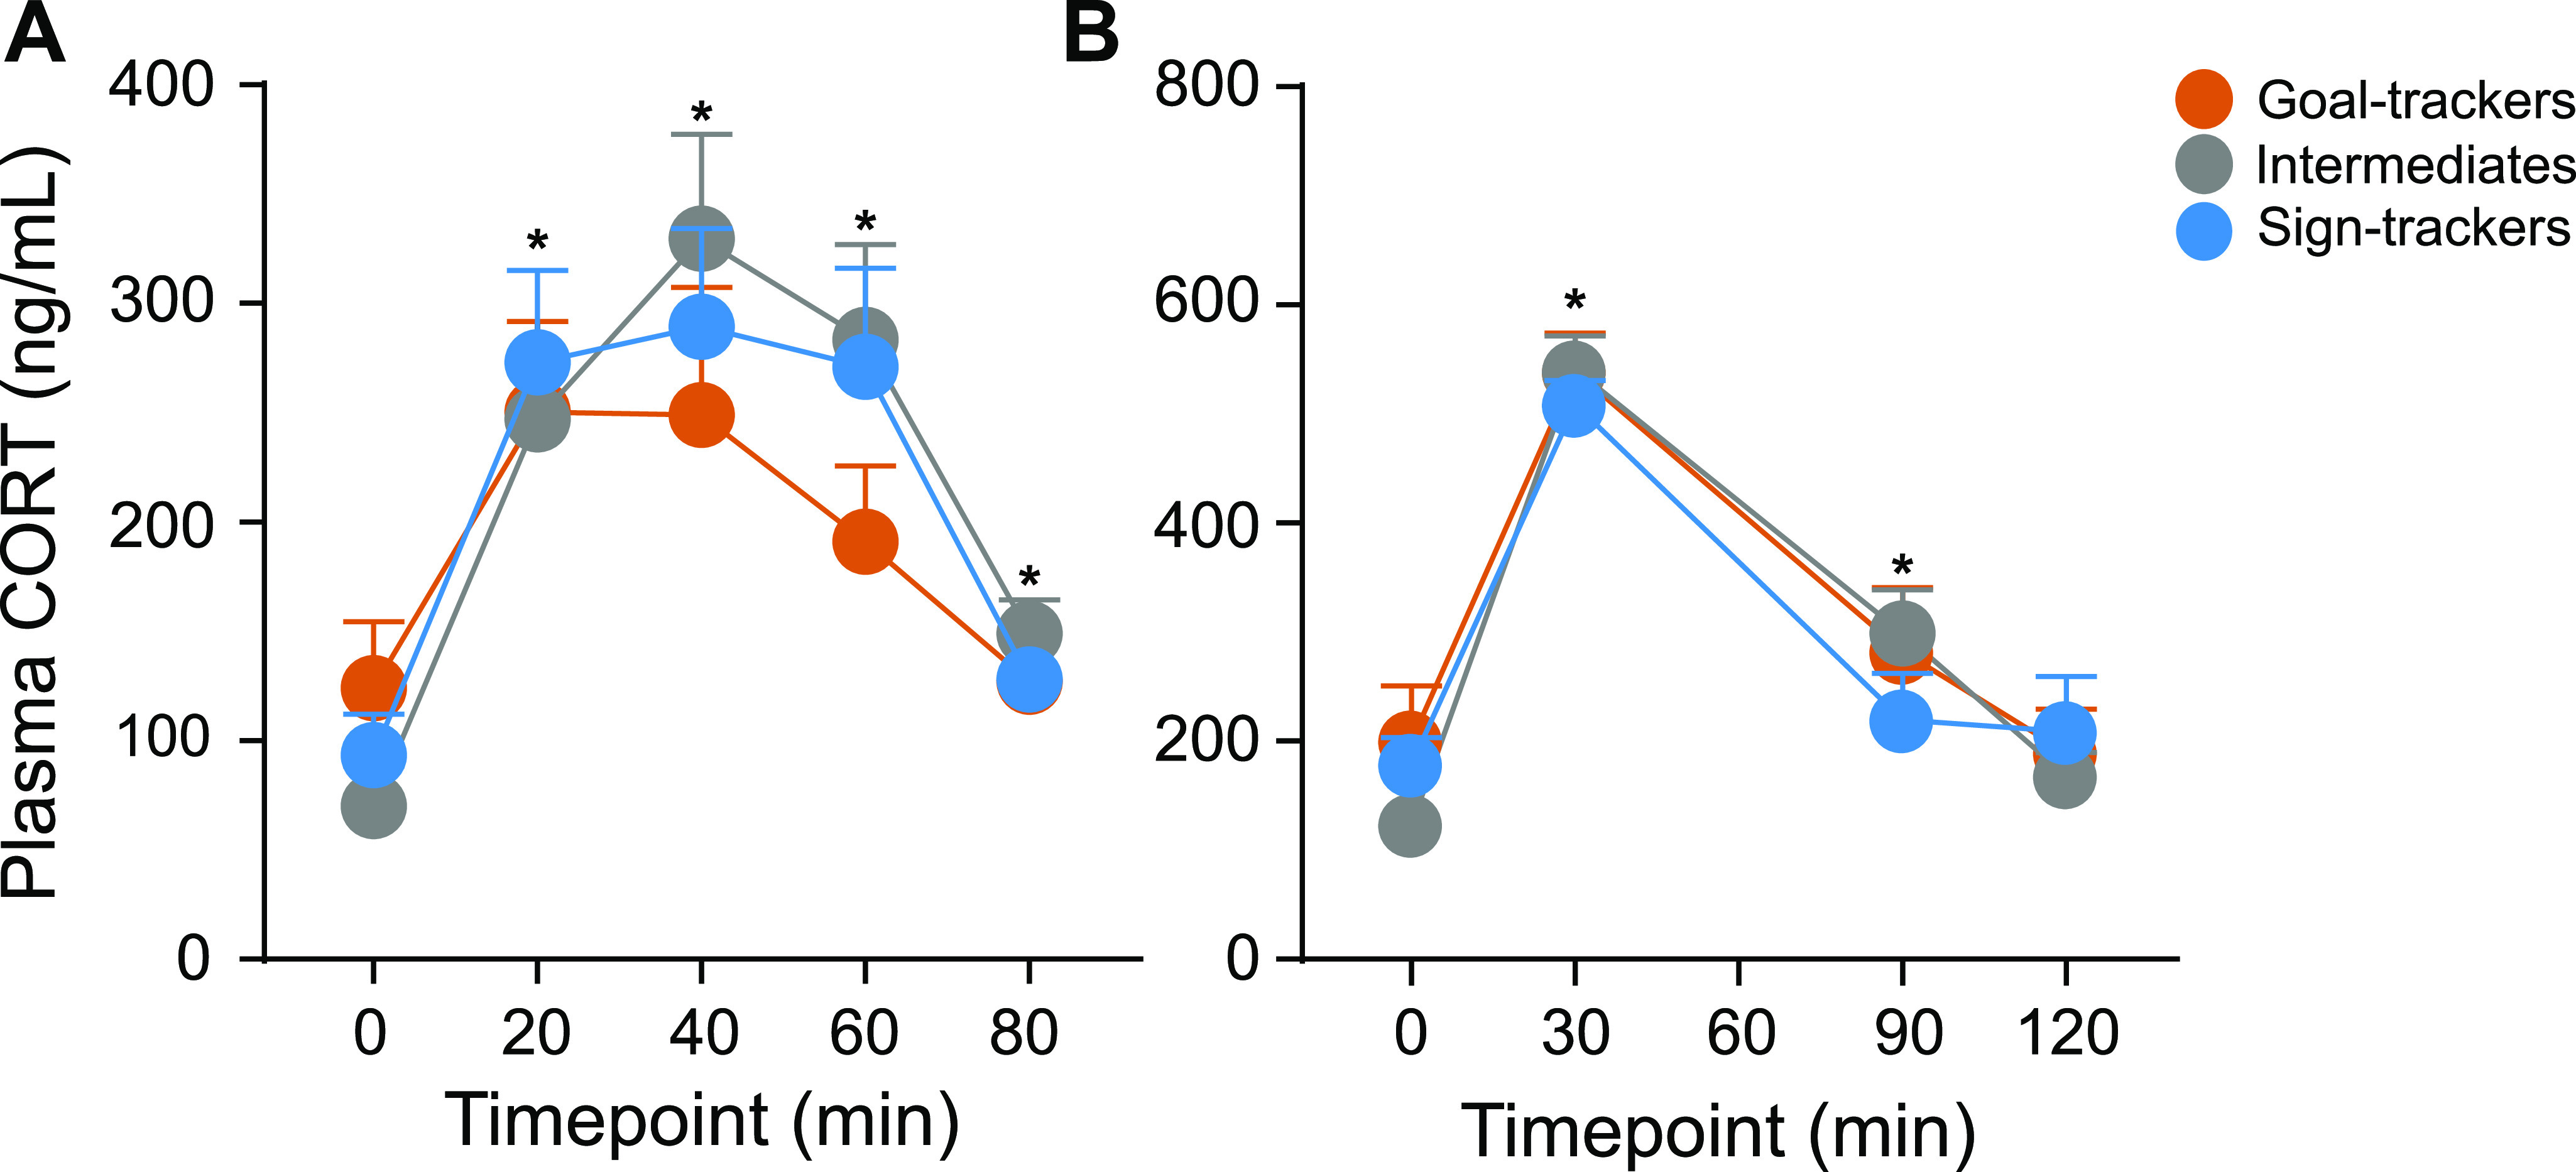
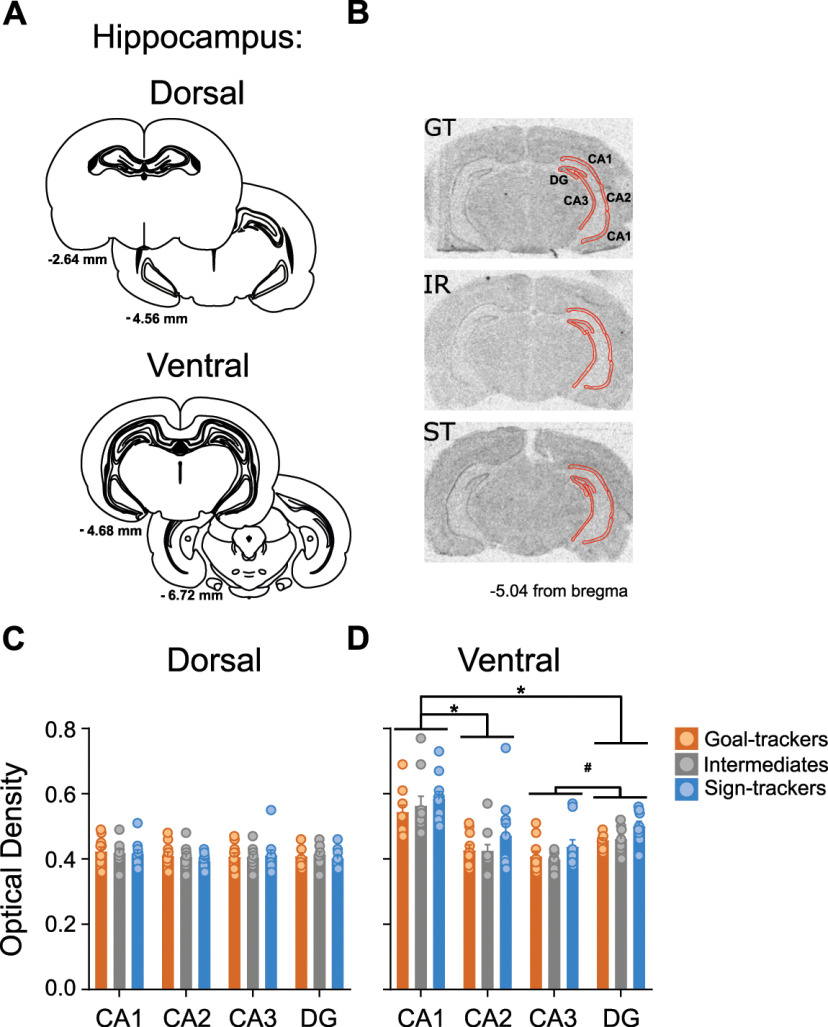
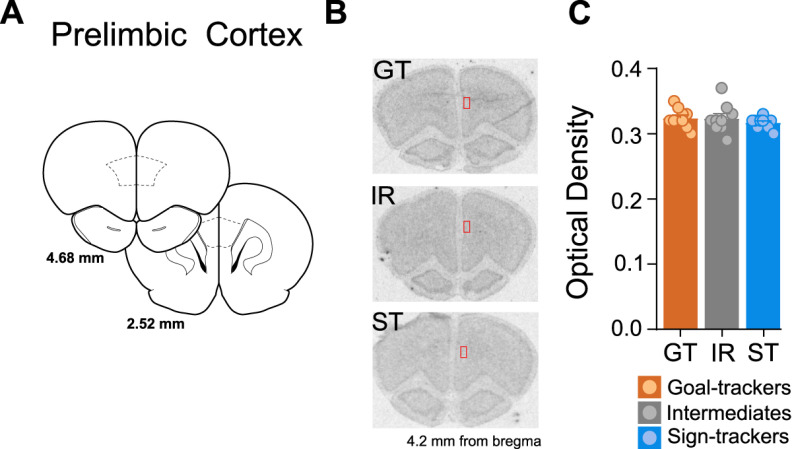
Environmental cues attain the ability to guide behavior via learned associations. As predictors, cues can elicit adaptive behavior and lead to valuable resources (e.g., food). For some individuals, however, cues are transformed into incentive stimuli and elicit motivational states that can be maladaptive. The goal-tracker (GT)/sign-tracker (ST) animal model captures individual differences in cue-motivated behaviors, with reward-associated cues serving as predictors of reward for both phenotypes but becoming incentive stimuli to a greater degree for STs. While these distinct phenotypes are characterized based on Pavlovian conditioned approach (PavCA) behavior, they exhibit differences on a number of behaviors relevant to psychopathology. To further characterize the neurobehavioral endophenotype associated with individual differences in cue-reward learning, neuroendocrine and behavioral profiles associated with stress and anxiety were investigated in male GT, ST, and intermediate responder (IR) rats. It was revealed that baseline corticosterone (CORT) increases with Pavlovian learning, but to the same degree, regardless of phenotype. No significant differences in behavior were observed between GTs and STs during an elevated plus maze (EPM) or open field test (OFT), nor were there differences in CORT response to the OFT or physiological restraint. Upon examination of central markers associated with stress reactivity, we found that STs have greater glucocorticoid receptor (GR) mRNA expression in the ventral hippocampus, with no phenotypic differences in the dorsal hippocampus or prelimbic cortex (PrL). These findings demonstrate that GTs and STs do not differ on stress-related and anxiety-related behaviors, and suggest that differences in neuroendocrine measures between these phenotypes can be attributed to distinct cue-reward learning styles.
Keywords: corticosterone; glucocorticoid receptors; incentive salience; stress reactivity.
Copyright © 2021 Lopez et al.
Figures
Similar articles
-
The effect of corticosterone on the acquisition of Pavlovian conditioned approach behavior in rats is dependent on sex and vendor.Horm Behav. 2024 Aug;164:105609. doi: 10.1016/j.yhbeh.2024.105609. Epub 2024 Jul 30. Horm Behav. 2024. PMID: 39083878
-
Inhibition of a cortico-thalamic circuit attenuates cue-induced reinstatement of drug-seeking behavior in "relapse prone" male rats.Psychopharmacology (Berl). 2022 Apr;239(4):1035-1051. doi: 10.1007/s00213-021-05894-9. Epub 2021 Jun 28. Psychopharmacology (Berl). 2022. PMID: 34181035
-
Individual differences in the propensity to approach signals vs goals promote different adaptations in the dopamine system of rats.Psychopharmacology (Berl). 2007 Apr;191(3):599-607. doi: 10.1007/s00213-006-0535-8. Epub 2006 Sep 14. Psychopharmacology (Berl). 2007. PMID: 16972103
-
The hot 'n' cold of cue-induced drug relapse.Learn Mem. 2018 Aug 16;25(9):474-480. doi: 10.1101/lm.046995.117. Print 2018 Sep. Learn Mem. 2018. PMID: 30115769 Free PMC article. Review.
-
Implementations of sign- and goal-tracking behavior in humans: A scoping review.Cogn Affect Behav Neurosci. 2025 Apr;25(2):263-290. doi: 10.3758/s13415-024-01230-8. Epub 2024 Nov 5. Cogn Affect Behav Neurosci. 2025. PMID: 39496905
Cited by
-
A mechanical task for measuring sign- and goal-tracking in humans: A proof-of-concept study.Behav Brain Res. 2023 Jan 5;436:114112. doi: 10.1016/j.bbr.2022.114112. Epub 2022 Sep 14. Behav Brain Res. 2023. PMID: 36115435 Free PMC article.
References
-
- Barr JL, Bray B, Forster GL (2017) The hippocampus as a neural link between negative affect and vulnerability for psychostimulant relapse. In: The hippocampus: plasticity and functions (Stuchlik A, ed.), pp 127–129. London: BoD.
MeSH terms
Grants and funding
LinkOut - more resources
Full Text Sources
Other Literature Sources
Research Materials
Miscellaneous